Breast Cancer
Julie A. Wallace1., Fu Li1,2., Subhasree Balakrishnan1
, Carmen Z. Cantemir-Stone1, Thierry Pecot2,3,4, Chelsea Martin1, Raleigh D. Kladney3, Sudarshana M. Sharma1, Anthony J. Trimboli2,3,
Soledad A. Fernandez5, Lianbo Yu5, Thomas J. Rosol6, Paul C. Stromberg6, Robert Lesurf7, Michael Hallett7,8, Morag Park7,9, Gustavo Leone2,3,10, Michael C. Ostrowski1,10*
1Department of Molecular and Cellular Biochemistry, College of Medicine, The Ohio State University, Columbus, Ohio, United States of America,2Department of Molecular Genetics, College of Biological Sciences, The Ohio State University, Columbus, Ohio, United States of America,3Department of Molecular Virology, Immunology and Medical Genetics, The Ohio State University, Columbus, Ohio, United States of America,4The Ohio State University Computer Science and Engineering, The Ohio State University Biomedical Informatics, The Ohio State University, Columbus, Ohio, United States of America,5Center for Biostatistics, The Ohio State University, Columbus, Ohio, United States of America,6Department of Veterinary Biosciences, College of Veterinary Medicine, The Ohio State University, Columbus, Ohio, United States of America,7Department of Biochemistry, Rosalind and Morris Goodman Cancer Centre, McGill University, Que´bec, Canada,8McGill Centre for Bioinformatics, McGill University, Que´bec, Canada,9Department of Oncology, McGill University, Que´bec, Canada,10Tumor Microenvironment Program, Comprehensive Cancer Center, The Ohio State University, Columbus, Ohio, United States of America
Abstract
Tumor fibroblasts are active partners in tumor progression, but the genes and pathways that mediate this collaboration are ill-defined. Previous work demonstrates that Ets2 function in stromal cells significantly contributes to breast tumor progression. Conditional mouse models were used to study the function ofEts2in both mammary stromal fibroblasts and epithelial cells. Conditional inactivation ofEts2in stromal fibroblasts inPyMTandErbB2driven tumors significantly reduced tumor growth, however deletion ofEts2in epithelial cells in the PyMTmodel had no significant effect. Analysis of gene expression in fibroblasts revealed a tumor- andEts2-dependent gene signature that was enriched in genes important for ECM remodeling, cell migration, and angiogenesis in bothPyMTandErbB2 driven-tumors. Consistent with these results,
PyMTandErbB2tumors lackingEts2in fibroblasts had fewer functional blood vessels, andEts2in fibroblasts elicited changes in gene expression in tumor endothelial cells consistent with this phenotype. Anin vivoangiogenesis assay revealed the ability of Ets2 in fibroblasts to promote blood vessel formation in the absence of tumor cells. Importantly, the Ets2 -dependent gene expression signatures from both mouse models were able to distinguish human breast tumor stroma from normal stroma, and correlated with patient outcomes in two whole tumor breast cancer data sets. The data reveals a key function forEts2in tumor fibroblasts in signaling to endothelial cells to promote tumor angiogenesis. The results highlight the collaborative networks that orchestrate communication between stromal cells and tumor cells, and suggest that targeting tumor fibroblasts may be an effective strategy for developing novel anti-angiogenic therapies.
Citation:Wallace JA, Li F, Balakrishnan S, Cantemir-Stone CZ, Pecot T, et al. (2013) Ets2 in Tumor Fibroblasts Promotes Angiogenesis in Breast Cancer. PLoS ONE 8(8): e71533. doi:10.1371/journal.pone.0071533
Editor:Rajeev Samant, University of Alabama at Birmingham, United States of America
ReceivedApril 12, 2013;AcceptedJune 28, 2013;PublishedAugust 16, 2013
Copyright:ß2013 Wallace et al. This is an open-access article distributed under the terms of the Creative Commons Attribution License, which permits unrestricted use, distribution, and reproduction in any medium, provided the original author and source are credited.
Funding:This work was supported by NIHPO1CA097189 (http://nih.gov/), RO1CA053271, Susan Komen Foundation (http://ww5.komen.org/), the Evelyn Simmers Foundation and Department of Defense Pre-Doctoral Fellowships GRANT00410570 and GRANT10578047. The funders had no role in study design, data collection and analysis, decision to publish, or preparation of the manuscript.
Competing Interests:The authors have declared that no competing interests exist.
* E-mail: michael.ostrowski@osumc.edu
.These authors contributed equally to this work..
Introduction
Although the microenvironment of normal tissue can inhibit tumor growth, changes induced by tumor cells actually influence this microenvironment to promote tumor progression and metastasis [1,2,3]. For example, disruption ofTgfbr2in fibroblasts leads to growth and increased oncogenic potential of adjacent epithelial cells in stomach and prostate [4]. Cancer associated fibroblasts (CAFs) were also shown to mediate immune cell recruitment in an NF-kB dependent manner in a mouse model of squamous cell carcinoma [5]. In addition, recent evidence demonstrates that a human stromal gene signature can be correlated with tumor prognosis and evolution of breast cancer
[6]. Stromal fibroblasts are one of the major components within the tumor microenvironment that drive a number of character-istics associated with tumor malignancy, including remodeling of the extracellular matrix, immune cell recruitment and modulation, angiogenesis and tumor cell proliferation and invasion [7,8]. Identification of specific molecules and signaling pathways within this stroma which promote tumor initiation and progression is essential for the potential development of novel therapeutics to be used independently or in combination with other tumor cell-specific treatments [9].
prostate [10,11]. As a downstream effector of the Ras/Raf/ MAPK pathway, Ets2 regulates the expression of a number of genes with potentially important functions in the tumor microen-vironment, including growth factors, adhesion molecules, extra-cellular proteases and anti-apoptotic genes. In mouse mammary tumor models,Ets2was shown to support tumor growth from an undefined cell population in the tumor stroma [12,13].
Previous work from our group has shown Ets2 functions to promote tumor progression and metastasis in at least two compartments of the mammary tumor microenvironment, including tumor macrophages and breast stromal fibroblasts in which Pten was deleted [14,15]. However, questions concerning both the fibroblast-specific and oncogene-dependent functions of
Ets2, as well as the molecular and cellular mechanisms of action remain unanswered. To address these issues, we used aCre/loxP
genetic approach to investigate the role of Ets2 in mammary epithelial cells and mammary fibroblasts in the context ofPyMT
andErbB2driven tumors. This approach revealed that fibroblast
Ets2promotes tumor growth and progression, whereas its function in epithelial cells is dispensable for tumor progression. Tran-scriptome profiling of both normal and tumor fibroblasts revealed tumor specific targets ofEts2 including genes involved in matrix remodeling and angiogenesis in the context of both PyMTand
ErbB2. Consistent with the gene expression results, loss ofEts2in tumor fibroblasts decreased tumor associated blood vessels in both models. Additionally, Ets2 deficiency in tumor fibroblasts signif-icantly impaired angiogenesisin vivoin matrigel plug assays. The fibroblastEts2transcriptomes were represented in human breast cancer stroma and correlated with patient outcome in independent whole-tumor breast cancer gene expression data sets. These results indicate thatEts2functions in a tumor-dependent but tumor cell non-autonomous manner to affect tumor growth and angiogenesis.
Methods
Ethics Statement
The use of animals was in compliance with federal and University Laboratory Animal Resources at The Ohio State University regulations and was conducted under under protocol number 2007A0120-R1 which was reviewed and approved by the Ohio State University Institutional Animal Care and Use Committee.
Tumor Studies
All mice used in these studies were inbred 10 generations to the FVB/N (F10) background. The generation ofFsp-CreandEts2loxP
mice has been previously described [15,16].Ets2db
mice were a gift from Dr. Robert Oshima (The Burnham Institute, La Jolla, California). PyMT tumor bearing mice were sacrificed 4 weeks after palpable tumors were identified. Excised tumors were weighed and processed for histological analysis. X-gal staining was done as described elsewhere [16].ErbB2mice were sacrificed at 16 weeks of age, and all mammary glands were harvested and processed for histological analysis. The total area of tumor lesions was calculated using Zeiss AxioVision 3.1 software.
Lectin Injections and Matrigel Plug Assay
Fluorescein or DyLight 594 Lycopersicon esculentum lectin (Vector Laboratories) was used to visualize blood vessels as described [17]. For the in vivo matrigel angiogenesis assays, 250,000 primary fibroblasts were mixed with ice cold growth factor reduced matrigel (BD Bioscience) and subcutaneously injected into the flanks of two month old FVB/N mice. Matrigel plugs were retrieved 5 days post injection for subsequent analysis.
X-gal Staining, Immunostaining, Gelatinasein situ
Zymography, and Microscopy Imaging and Quantification
X-gal staining was performed as previously described [15]. The following antibodies were used in this study: CD31 (BD Bioscience), Ki67 (Dako) and cleaved caspase- 3 (Cell Signaling). Appropriate secondary antibodies were used for IF or IHC as described elsewhere [15]. DQ-gelatin (Molecular Probes) was used for gelatinasein situzymography as described by Mooket al. [18]. For CD31 and lectin quantification, images were made from multiple tumors in at least three different mice; a minimum of five images were taken per mouse from random tumor fields. Microscopic images for CD31, lectin and zymography quantifi-cation were acquired with a Zeiss Axiocam HRc camera and quantified using ImageJ (http://rsbweb.nih.gov/ij/), Fiji [19] or MetaMorph softwares, whereby the percentage of total positive area was calculated. For quantification of Ki67 and cleaved caspase 3 staining, images from random tumor fields were taken, and the total number of positive cells was represented as a percentage of the total number of tumor cells.
Whole mount staining. Inguinal mammary glands were isolated from 6 week or 14 days pregnant female mice and mounted on glass slides using a Q-tip to spread the tissue. Tissue was fixed using Carnoy’s fixative (60% ethanol, 30% chloroform and 10% acetic acid) at 4uC overnight, and then stained with carmine alum stain (Sigma) for 12 hours. After thorough rinsing in water, mammary glands were dehydrated with alcohol and preserved in xylene.
Primary Mammary Fibroblast Culture, Endothelial Cell Isolation and Microarray Analysis
Mammary fibroblasts were isolated from female mice using gravity separation [20]. Briefly, mammary tissue was digested with collagenase/hyaluronidase overnight in a CO2 incubator. After
neutralization, cells were separated by gravity five times. Supernatant containing stromal cells was plated with 10% FBS DMEM. Second passage cells were used for subsequent analysis. For endothelial cell isolation, mammary glands were digested with collagenase until a single cell suspension was achieved. Cells were then stained with fluorescently conjugated CD31 antibody (BD Pharmingen) and subjected to cell sorting. RNA was extracted with Trizol (Invitrogen) and purified with RNAeasy kit (Qiagen) following manufacturers’ instructions. Microarray profiling was performed with Affymetrix Mouse Genome 430A 2.0 or 430 2.0 GeneChips at the OSUCCC microarray facility. All microarray data has been deposited and can be accessed through the following links:
http://www.ncbi.nlm.nih.gov/geo/query/acc. cgi?token = dberdqwuosoegdi&acc = GSE16989
http://www.ncbi.nlm.nih.gov/geo/query/acc. cgi?token = flmxjguyowqmojq&acc = GSE44166
http://www.ncbi.nlm.nih.gov/geo/query/acc. cgi?token = txmnnecmegeaopw&acc = GSE44118
Differentially expressed genes were identified by the WEDGE++ method [21] or Robust Multichip Average method (RMA) [22]. Quantitative RT procedures are described elsewhere [23]. Primers and probes used for real time PCR are available in Table S6.
Western Blot
Western blotting was performed as previously described [15].
categories in ToppGene Suite [25]. Statistical significance was determined using 1,000 random permutations of each gene set to obtain a nominal P value.
Generating the human stroma heat map using theEts2 gene lists. Of the 107 and 69 genes regulated byEts2inPyMT
and ErbB2 derived tumor fibroblasts, 88 and 61 had human orthologs identified using Ensembl and MGI databases. When queried against the McGill Cancer Center’s Breast Stroma Microarray data (GSE9014 and GSE4823), 85 and 57 genes were also represented on the Agilent custom array used by the McGill group. To identify the genes most differentially expressed in human tumor stroma versus normal stroma, a variance cutoff of.0.5 was applied across the multiple human samples. The 38
PyMTderived and 36ErbB2derived genes which met this cutoff criterion were subsequently used to generate a heat map for the human stroma dataset (52 normal stroma and 49 tumor stroma samples). The separation of normal stroma and tumor stroma was significant using gene signatures from both models (P = 0.00085 for PyMT and 0.00004 for ErbB2), as determined by 10,000 random permutations using the one sided Wilcoxon rank sum test. Similar analysis was used for our PyMTderivedEts2 dependent endothelial cell data, with 22 of 33 human orthologs represented in the McGill breast stroma data. In this case, the separation of normal stroma and tumor stroma was not found to be significant (p-value = 0.1014).
Kaplan-meier survival analysis. TheEts2tumor fibroblast 38 and 36 gene signatures as well as the endothelial 22 gene signature were used to query gene expression data from three independent breast cancer microarrays - Rosetta (NKI) dataset, Stockholm (GSE1456) and the McGill University (GSE9014) dataset. A Cox proportional hazards model associated to a L2 norm constraint [26] was applied to estimate the coefficients b associated to each gene from the human orthologs corresponding to the Ets2- tumor fibroblast 38 or 36 gene signatures. A prognostic index for each patient is defined as the sum of the gene expression levels pondered by the estimated coefficientsb. A 10-fold cross validation was used to predict the outcome for each patient: the patients are randomly divided into 10 groups; 9 groups are chosen to form the training set while the last group represents the test set. The coefficientsbare estimated from the training set and the prognostic index for each patient in the test set is computed. This step is repeated 10 times to consider each group of patients as the test set once. The 10-fold cross validation is performed 10 times in order to be independent of the random partitioning. A prognostic index threshold is then defined as the 50 percentile of all prognostic indexes. All the patients that have a prognostic index superior (respectively inferior) to this threshold are considered as high risk (respectively low risk) patients. A log-rank test is finally applied to evaluate the statistical significance between the two groups.
Statistical Analysis
Number of animals and experiments are as indicated in the figures. Analysis of variance (ANOVA) model assuming unequal variance with Holm’s methods was used to study the differences
among groups in the PyMT tumor study (Fig. 1A). A
non-parametric Mann-Whitney test was used to compare lesion sizes in
ErbB2tumors (Fig. 2A, left panel). A Chi square test was used to compare the number ofErbB2lesions larger than 1mm2(Fig. 2A, right panel). A Welch’s t-test assuming unequal variance was used to calculate p-values for Ki67 staining and all other immunoflu-orescence staining.
Results and Discussion
Ets2 Deletion Specifically Effects Tumor Progression from the Fibroblast Compartment in Multiple Breast Cancer Models
The ablation of a conditional Ets2loxP allele [27] was studied both in mammary stromal fibroblasts and in mammary tumor epithelial cells in the MMTV-PyMT (PyMT) mammary cancer model [28]. For this purpose, Fibroblast Specific Protein 1 promoter-Cre (Fsp-Cre) was used for specific deletion in tumor fibroblasts, while MMTV-Cre was used to target epithelial cells [15,29]. Initial experiments indicated that deletion of both alleles in homozygous Ets2loxP/loxP mice was inefficient with several different Cre-driver lines [14,15], including Fsp-Cre (data not shown). In order to facilitate the complete ablation ofEts2within the fibroblast and epithelial compartments, mice were generated carrying theCretransgene along with one conditionalEts2loxPallele and a conventional Ets2 knockout allele targeting the DNA-binding domain,Ets2db
[30]. We evaluated tumor development in both PyMT;Fsp-Cre;Ets2db/loxP and PyMT;MMTV-Cre;Ets2db/loxP
experimental groups and in control PyMT;Ets2db/loxP mice. No difference was observed in tumor initiation; however tumor progression was significantly impeded by the ablation of Ets2
specifically in mammary fibroblasts. The average weight of tumors 30 days after tumor initiation inPyMT;Fsp-Cre;Ets2db/loxPmice was 1.5-fold lower than in either control PyMT;Ets2db/loxP or
PyMT;MMTV-Cre;Ets2db/loxPmice (P,0.01, Fig. 1A). Additionally, H&E staining of inguinal mammary glands from control
PyMT;Ets2db/loxP mice showed solid tumors throughout the mammary gland, whereas tumors had not invaded the entire fat pad ofPyMT;Fsp-Cre;Ets2db/loxPmammary glands (Fig. 1B, yellow outline indicates area with less tumor invasion).
The specificities of bothFsp-CreandMMTV-Crewere confirmed by introducing theRosa26LoxPreporter gene into a subset of the experimental mice [31]. X-gal staining of mammary tumor sections confirmed the stromal- or epithelial-specific expression of the respectiveCretransgenes (Fig. S1A). PCR-based analysis of genomic DNA from epithelial cells isolated fromPyMT;Ets2db/loxP
or PyMT;MMTV-Cre;Ets2db/loxP mice demonstrated efficient re-combination of the singleEts2loxP
allele (Fig. S1B). Western blot assays confirmed the loss of ETS2 [32] protein in mammary stromal fibroblasts isolated from PyMT;Fsp-Cre;Ets2db/loxP mice (Fig. S1C). Cultured mammary fibroblasts stained with anti-phospho-Ets2pT72antibody further demonstrated the loss of ETS2 activation in fibroblasts from PyMT;Fsp-Cre;Ets2db/loxP mice [15] (Fig. S1D). Interestingly, whole mount analysis of normal developing and pregnant mammary glands showed similar branching of epithelial ducts in both Ets2db/loxP and Fsp-Cre;Ets2db/loxPanimals (Fig. S1F, S1G), suggestingEts2expression in fibroblasts was not essential for proper mammary gland development. Additionally, whole mount analysis of mammary glands isolated form 6-week oldPyMT;Ets2db/loxPanimals revealed extensive neoplastic progression, however tumors in mammary glands fromPyMT;Fsp-Cre;Ets2db/loxP mice remained restricted to the nipple area, with little or no invasion into and beyond the mammary lymph node (Fig. S1H).
Careful examination of tumor histology revealed complete disruption of the basement membrane and invasive carcinoma in tumors fromPyMT;Ets2db/loxPmice, while many tumor lesions in
failed to detect any difference in apoptosis between genetic groups (Fig. S1E), indicating that stromal Ets2 impacts tumor growth through modulation of epithelial proliferation.
To determine if fibroblast Ets2 function was oncogene
dependent, we combined the MMTV-ErbB2 oncogene with
Ets2db/loxP and Fsp-Cre;Ets2db/loxP mice. Since an expected delay Figure 1.Ets2ablation in stromal fibroblasts restrictsPyMTdriven mammary tumorigenesis. A.Dissected tumor weight in grams isolated from 14 week oldPyMT;Ets2db/loxP(n = 21, 12.3663.8),PyMT;Fsp-Cre;Ets2db/loxP(n = 17, 7.8362.7), andPyMT;MMTV-Cre;Ets2db/loxP(n = 15, 11.364.7) mice (**P,0.01, *P,0.05, adjusted P-values were obtained from an ANOVA model assuming unequal variance with Holm’s methods).B.Representative H&E stained mammary glands from 14 week oldPyMT;Ets2db/loxPandPyMT;Fsp-Cre;Ets2db/loxPmice. Area outlined in yellow represents less advanced tumor progression. Scale bar, 2mm.C.Representative histological sections from mammary glands of 10 week oldPyMT;Ets2db/loxPand PyMT;Fsp-Cre;Ets2db/loxP
mice. Scale bar, 50mm.D.Left: representative IHC staining for Ki67 in mammary glands of 10 week oldPyMT;Ets2db/loxPand PyMT;Fsp-Cre;Ets2db/loxPmice. Scale bar, 50mm. Right: graph represents percentage of Ki67 positive epithelial cells (n = 3, bars represent means6SD, **P,0.01, unpaired Welch’s t-test assuming unequal variance).
doi:10.1371/journal.pone.0071533.g001
Figure 2.Ets2deletion in stromal fibroblasts reduces size and number of tumor lesions inErbB2breast cancer model. A.Left: graph represents carcinoma lesion sizes in mm2from 16 week oldErbB2;Ets2db/loxP
(n = 5, 2.2864.16) andErbB2;Fsp-Cre;Ets2db/loxP(n = 5, 1.8367.96) mice (**P,0.01, Non-parametric Mann-Whitney test). Right: graph represents number of lesions larger than one mm2in mammary glands of 16 week old ErbB2;Ets2db/loxP(n = 5) andErbB2;Fsp-Cre;Ets2db/loxP(n = 5) mice (**P,0.01, Chi Square test).B.Representative H&E stained mammary glands from 16 week oldErbB2;Ets2db/loxP
andErbB2;Fsp-Cre;Ets2db/loxP
mice. Scale bar, 2mm. LN, lymph node. T, tumor.C.Representative histological sections from mammary glands of 16 week oldErbB2;Ets2db/loxPandErbB2;Fsp-Cre;Ets2db/loxPmice. Scale bar, 50mm.D.Left: representative IHC staining for Ki67 in mammary glands from 16 week oldErbB2;Ets2db/loxP
andErbB2;Fsp-Cre;Ets2db/loxP
mice. Scale bar, 50mm. Right: graph represents percentage of Ki67 positive epithelial cells (n = 3, bars represent means6SD, **P,0.01, Welch’s t-test assuming unequal variance).
in tumor progression was predicted based on our results in the
PyMTmodel, mice harboring theErbB2oncogene were harvested at 16 weeks of age, just before palpable tumors were detected in this model. Using consecutive histological sections, we calculated the number and sizes of carcinoma lesions. The ErbB2;Fsp-Cre;Ets2db/loxP mice had nearly half as many overall lesions compared to those found in ErbB2;Ets2db/loxP mice (P,0.01, Fig. 2A, left panel, Fig. 2B). The lesions were also significantly smaller inErbB2;Fsp-Cre;Ets2db/loxPcompared to controls (Fig. 2A). Closer examination of the data revealed a three-fold decrease in the number of lesions.1mm2 in size in mammary glands from
ErbB2;Fsp-Cre;Ets2db/loxP mice (P,0.01, Fig. 2A, right panel). As illustrated by higher magnification H&E staining, deletion ofEts2
in tumor fibroblasts significantly reduced the expansion of carcinoma lesions into the surrounding fat pad tissue (Fig. 2C). As in thePyMTmodel, Ki67 staining revealed a 2-fold decrease in proliferation of epithelial cells surrounded byEts2null fibroblasts, implicating a similar mechanism of controlling tumor growth in this model as well (Fig. 2D). Collectively, these data support a stromal fibroblast-specific function for Ets2 in facilitating the
progression and invasion of mammary tumors induced by both
PyMTandErbB2epithelial expression.
Gene Expression Changes Reveal the Tumor Specific Effects ofEts2
To uncover the molecular mechanisms underlyingEts2function in stromal fibroblasts in bothPyMTandErbB2induced tumors, we profiled RNA isolated from primary mammary fibroblasts for changes in global gene expression (Affymetrix Mouse Genome 430A 2.0 GeneChip platform or 430 2.0 GeneChip platform). Fibroblasts were isolated when tumors were not yet invasive, from 9-week old mice in thePyMTmodel and from 16-week old mice in theErbB2model. Fibroblasts fromEts2db/loxPandFsp-Cre;Ets2db/loxP
control mice were also isolated at the same time points and RNA was subjected to gene expression profiling. Assessment of cultured fibroblast purity has been previously described [15]; staining of cultured mammary fibroblasts with both vimentin and anti-phospho-Ets2pT72 antibodies confirmed both the enrichment for fibroblasts (.95% fibroblasts) and the efficiency ofEts2 condi-tional knockout (Fig. S1D).
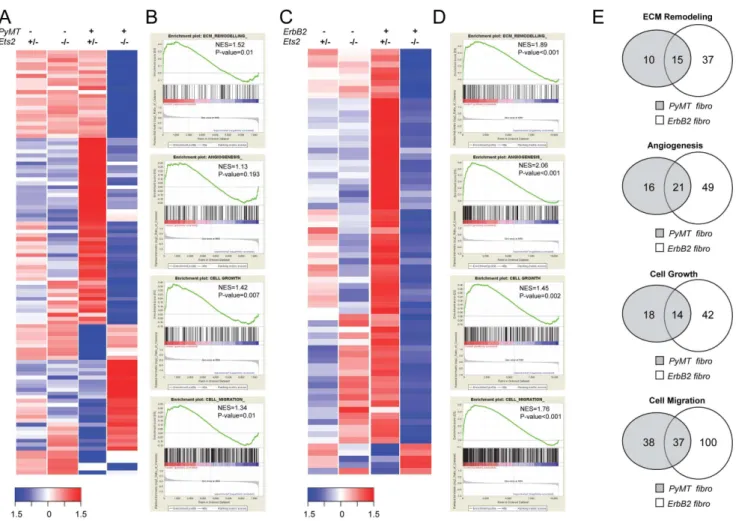
Figure 3.Ets2regulates tumor fibroblast specific transcription program. A.Heatmap representing expression levels of 107 upregulated and downregulated genes inPyMT;Ets2db/loxP
vs.PyMT;Fsp-Cre;Ets2db/loxP
fibroblasts in all indicated genotypes harvested from 9 week old mice (n = 1, Log fold change.2, Negative Log P value (NLP).4.5).B.GSEA plots depicting ECM remodeling, angiogenesis, cell growth and cell migration to be enriched in PyMT;Ets2db/loxP
fibroblasts as compared to PyMT;Fsp-Cre;Ets2db/loxP
fibroblasts. NES: normalized enrichment score. C. Heatmap representing expression levels of 69 upregulated and downregulated genes inErbB2;Ets2db/loxPvs.ErbB2;Fsp-Cre;Ets2db/loxPfibroblasts in all indicated genotypes harvested from 16 week old mice (n = 1, Log fold change.2).D.GSEA plots depicting ECM remodeling, angiogenesis, cell growth and cell migration to be enriched in ErbB2;Ets2db/loxP fibroblasts as compared toErbB2;Fsp-Cre;Ets2db/loxP fibroblasts. NES: normalized enrichment score.
E.Venn diagrams depicting the number of common genes in the leading edge subset of indicated GO categories enriched inPyMT;Ets2db/loxP fibroblasts (gray circles) andErbB2;Ets2db/loxPfibroblasts (white circles).
To identify Ets2 target genes specifc to tumor fibroblasts, we compared expression changes between normal fibroblasts at both ages (Fsp-Cre;Ets2db/loxP vs. Ets2db/loxP) and tumor associated fibroblasts from both models (TAFs; PyMT;Fsp-Cre;Ets2db/loxP vs.
PyMT;Ets2db/loxPandErbB2;Fsp-Cre;Ets2db/loxPvs.ErbB2;Ets2db/loxP). Comparison of normal fibroblasts from 9-10 week old mice identified only 22 genes to be differentially expressed uponEts2
inactivation (fold change.4 and negative log p-value (NLP).4.5, Fig. S2A and Table S1). In contrast, when thePyMToncongene was present in epithelial cells, 107 genes were differentially expressed with Ets2 ablation in fibroblasts (fold change.4 and NLP.4.5, Fig. 3A, Fig. S2A and Table S2). Consistent with a tumor-specific role forEts2, only 4 genes were in common between normal and tumor fibroblasts (Fig. S2A). Our analysis using samples from the ErbB2 model yielded a similar tumor specific
Ets2-dependent gene expression pattern, with 15 genes identified as differentially expressed in normalEts2null fibroblasts isolated
from 16-week old mice compared to controls, whereas 69 genes changed when Ets2 was inactivated in ErbB2 tumor associated fibroblasts (Fig. 3C, Fig. S2C, Table S3 and Table S4). In the
ErbB2 model 1 gene was commonly mis-regulated in between normal and tumor fibroblasts. (Fig. S2C). Quantitative real-time PCR (qRT-PCR) was used to confirm the microarray data, and.85% of the expression changes were verified in at least two independent sets of RNA from tumor fibroblasts isolated from either genetic model (Fig. S2E, S2F).
Gene set enrichment analysis (GSEA) was used to analyze the data [24]. ECM remodeling, cell migration and cell growth-related gene sets were found to be significantly differentially expressed in
PyMTtumor fibroblasts compared to cells lackingEts2(Fig. 3B). Angiogenesis was another biological process affected by Ets2
deletion, but the trend did not reach statistical significance (Fig. 3B). GSEA analysis of the ErbB2 model identified ECM remodeling, cell migration, cell growth-related genes and angio-Figure 4.Ets2in fibroblasts controls tumor angiogenesis. A.Left:in vivotumor vasculature visualized by intracardiac injection of FITC lectin (green). Scale bar, 200mm. Right: graph represents percent lectin positive area quantified using ImageJ, Fiji(n = 3, bars represent means6SD, ** P,0.01, Welch’s t-test assuming unequal variance).B.Left: immunofluorescence staining for CD31 (red) in mammary gland tumors from 10 week old PyMT;Ets2db/loxP
andPyMT;Fsp-Cre;Ets2db/loxP
mice. Scale bar, 200mm. Slides were counterstained with DAPI (blue). Right: graph represents percent CD31 positive area quantified using ImageJ, Fiji (n = 3, bars represent means6SD, **P,0.01, Welch’s t-test assuming unequal variance).C.Left: in vivotumor vasculature visualized by intrafemoral injection of DyLight 594 lectin (green). Scale bar, 200mm. Right: graph represents percent lectin positive area quantified using ImageJ, Fiji (n = 3, bars represent means 6SD, ** P,0.01, Welch’s t-test assuming unequal variance). D. Left: immunofluorescence staining for CD31 (red) in mammary gland tumors from 16 week oldErbB2;Ets2db/loxPandErbB2;Fsp-Cre;Ets2db/loxPmice. Scale bar, 200mm. Slides were counterstained with DAPI (blue). Right: graph represents percent CD31 positive area quantified using ImageJ, Fiji (n = 3, bars represent means6SD, **P,0.01, Welch’s t-test assuming unequal variance).E.Heatmap depicting the genes significantly differentially regulated in endothelial cells isolated fromPyMT;Ets2db/loxP
vs.PyMT;Fsp-Cre;Ets2db/loxP
mammary glands harvested at 9 weeks (n = 3, fold change.2, *P#0.05).F.
GSEA plots depicting ECM remodeling, cell adhesion and cell chemotaxis to be enriched in endothelial cells isolated fromPyMT;Ets2db/loxPmammary glands as compared toPyMT;Fsp-Cre;Ets2db/loxP
genesis to be significantly differentially regulated in tumor associated fibroblasts compared toEts2null fibroblasts (Fig. 3D). To determine whether the same genes were driving the enrichment of these biological processes in the two different breast cancer models, the number of overlapping genes present in the leading edge subset for each gene ontology (GO) category was determined (Fig. 3E). Interestingly, between 15–20% of genes present in the leading edge subset of GO categories in thePyMT
samples were also present in the leading edge in the ErbB2
samples. This indicates that although Ets2 may have unique targets that are specific to a particular oncogene, a significant portion of targets are regulated similarly by Ets2 independent of the oncogene. Manual annotation of differentially expressed genes in fibroblasts from both PyMT and ErbB2 models confirmed that genes known to be involved in angiogenesis and ECM remodeling were targets ofEts2(Fig. S2B and S2D).
Ets2in Fibroblasts Promotes Angiogenesis in a Cell Autonomous Manner
To verify whether Ets2 deletion in fibroblasts compromised angiogenesis as predicted by the microarray results, tumor vasculature was quantified by intracardiac or femoral vein injection of tomato lectin [33]. This analysis revealed a marked decrease in the vascular network in Ets2-deleted versus non-deleted control tumors in both the PyMT and ErbB2 models
(P,0.01, Fig. 4A, C). Additionally, staining using the endothelial cell specific marker CD31 revealed a decrease in the recruitment of new vasculature in PyMT or ErbB2 tumors lacking Ets2 in fibroblasts compared to controls (P,0.01, Fig. 4B, D, see S3A and S3B for additional representative images).
To better understand how Ets2 function in tumor associated fibroblasts promotes angiogenesis, we isolated endothelial cells from the mammary glands of 9-week old PyMT;Ets2db/loxP and
PyMT;Fsp-Cre;Ets2db/loxP mice and performed gene expression profiling on isolated endothelial cell RNA (Affymetrix Mouse Genome 430 2.0 GeneChip platform). Our comparison of endo-thelial cells from PyMT;Ets2db/loxP and PyMT;Fsp-Cre;Ets2db/loxP
mammary glands (n = 3 biological replicates) identified 33 differentially regulated genes (fold change.2, P,0.05, Fig. 4E, Table S5). Using GSEA we observed differential regulation of genes involved in ECM remodeling, cell adhesion and cell chemotaxis in tumor endothelial cells when Ets2 was deleted in fibroblasts (Fig. 4F). Although further analysis is required to determine the exact mechanism by which Ets2 signaling in fibroblasts affects endothelial cells, our results highlight crosstalk among these different cells in the tumor microenvironment.
To experimentally establish whether these effects on angiogen-esis were dependent on the cell autonomous function ofEts2 in fibroblasts, we isolated primary PyMTtumor fibroblasts with or without Ets2 and used these cells for an in vivo matrigel plug angiogenesis assay (Fig. 5A) [34,35]. Matrigel containing
PyM-Figure 5.Ets2regulation of angiogenesis and ECM remodeling is tumor cell independent. A.Experimental strategy of matrigel plug assay.B.Left: CD31 staining (red) in matrigel plugs containing eitherPyMT;Ets2db/loxP
orPyMT;Fsp-Cre;Ets2db/loxP
tumor fibroblasts. Scale bar, 200mm. Slides were counterstained with DAPI (blue). Right: graph represents percent CD31 positive area quantified using MetaMorph Software (n = 4, bars represent means6SD, **P,0.01, Welch’s t-test assuming unequal variance).C.Right: gelatinasein situzymography for MMP9 activity (green) of matrigel plugs containing primary fibroblasts of indicated genetic groups. Scale bar, 50mm. Right: graph representing fluorescence intensity quantified using MetaMorph Software (n = 4, bars represent means6SD, **P,0.01, Welch’s t-test assuming unequal variance).
T;Ets2db/loxP
and PyMT;Fsp-Cre;Ets2db/loxP
tumor fibroblasts was injected subcutaneously into opposite flanks of syngeneic mice, and plugs were harvested 5 days later for analysis by CD31 staining. These experiments revealed that fibroblasts containing
Ets2 promoted recruitment of endothelial cells more efficiently than fibroblasts lackingEts2(P,0.01, Fig. 5B). The results directly
implicateEts2 as a driving factor in tumor fibroblasts inde novo
blood vessel formation.Mmp9, a gene directly regulated byEts2
[15], is known to play a critical role in angiogenesis, including in the release of active VEGF-A in the ECM [36]. To determine if MMP9 activity was also dependent onEts2function in fibroblasts irrespective of tumor cells, matrigel plugs were analyzed byin situ
Figure 6.Ets2gene signatures are represented in human breast tumor stroma. A.Heat map displaying the expression of the human orthologs of thePyMTderived 38-geneEts2signature in normal- and tumor-stroma from human breast cancer patients. 16 genes were upregulated (denoted by red bar on the y-axis) and 22 genes were downregulated (denoted by the blue bar on the y-axis) inEts2null tumor fibroblasts. Red and blue regions inside the heat map indicate relative gene expression levels (red, increased and blue, decreased) between the normal and tumor stroma (P = 0.00085, one-sided Wilcoxon rank sum test, based on 10,000 permutations).B.Heat map displaying the expression of the human orthologs of theErbB2derived 36-geneEts2signature in normal- and tumor-stroma from human breast cancer patients. 3 genes were upregulated (denoted by red bar on the y-axis) and 33 genes were downregulated (denoted by the blue bar on the y-axis) inEts2null tumor fibroblasts. Red and blue regions inside the heat map indicate relative gene expression levels (red, increased and blue, decreased) between the normal and tumor stroma (P = 0.00004, one-sided Wilcoxon rank sum test, based on 10,000 permutations).C.Expression of the 29PyMT-drivenEts2-dependent genes present in the NKI whole tumor data set correlates with patient outcome. Kaplan-Meier curves of high risk and low risk groups based on expression of the 29Ets2tumor specific genes (**P,0.0001).D.Expression of the 30ErbB2-drivenEts2-dependent genes present in the NKI whole tumor data set correlates with patient outcome. Kaplan-Meier curves of high risk and low risk groups based on expression of the 30Ets2tumor specific genes (**P,0.0001).
E.Expression of the 7 endothelial cell genes dependent onEts2fibroblast signaling present in the NKI whole tumor data set correlates with patient outcome. Kaplan-Meier curves of high risk and low risk groups based on expression of the 7 endothelial cell genes (**P,0.0001).
zymography, revealing a 2-fold decrease in MMP9 activity when
Ets2 was deleted in tumor fibroblasts (P,0.01, Fig. 5C). The results of these in vivoexperiments supports the cell autonomous role of fibroblastEts2in ECM remodeling and angiogenesis.
Ets2Fibroblast Gene Signatures are Represented in Human Breast Cancer Stroma and Correlate with Worsened Patient Outcomes
To evaluate the relevance of our findings to human breast cancer, we compared thePyMTdrivenEts2-dependent fibroblast transcriptome to gene expression data derived from laser-captured human breast tumor stroma and normal stroma [6]. The expression of the human orthologs of 38 genes regulated byEts2
in thePyMTmodel (see Materials and Methods) could significantly distinguish human breast tumor stroma from normal stroma compared to 10,000 random gene lists (P = 0.00085, Fig. 6A). Similar results were observed when Principal Component Analysis (PCA) was used (Fig. S4A). Importantly, the Ets2gene signature enriched in human tumor stroma correlated with poor patient outcome in two independent and well-annotated whole tumor breast cancer gene expression datasets, the NKI and Stockholm datasets [37,38], (Fig. 6C and Fig. S4C); the 38-gene Ets2
expression signature also correlated with patient outcome in the McGill dataset (Fig. S4C).
TheErbB2derivedEts2tumor fibroblast gene signature was also compared to human breast cancer stroma (see Materials and Methods). The 36 gene signature was found to be significantly enriched in human breast tumor stroma with only 2 patients mis-categorizing (P = 0.00004, Fig. 6B). PCA confirmed the result (Fig. S4B). The expression of these 36 genes was significantly correlated with patient outcomes in the NKI dataset, as well as in the Stockholm and McGill datasets (Fig. 6D and Fig. S4D, respec-tively).
In contrast to the results we obtained using our fibroblast gene signatures, the endothelial cell gene signature was not able to distinguish human breast tumor stroma from normal stroma (Fig. S5A, S5B). However, 9 variably expressed genes (variance cutoff.0.5, see Materials and Methods) used for the analysis were able to significantly predict patient outcome in the NKI data set, as well as in the Stockholm and McGill datasets (Fig. 6E and Fig. S5C, respectively).
Conclusions
The tumor fibroblast is critical to breast tumor progression and metastasis, and may provide novel therapeutic opportunities for cancer treatment. In this context, the results presented here provide three significant and inter-related conceptual advances for the breast tumor microenvironment field.
First, the genetic studies demonstrate that Ets2 regulates an oncogenic gene expression program in tumor stromal fibroblasts that promotes tumor growth. This role ofEts2 is specific to the stroma since Ets2 is dispensable for tumor progression in malignant epithelial cells. Although the exact genes regulated by
Ets2 in mammary fibroblasts vary depending on the oncogenic signals coming from the tumor cell, there is a significant overlap of target genes and the overall outcome of increased tumor growth and tumor angiogenesis remain consistent with both oncogenes tested. The activation ofEts2stromal fibroblast-specific expression programs represents one mechanism by which the tumor co-opts the microenvironment to serve in its progression to malignancy.
The lack of Ets2 function in the tumor cells shown here is consistent with a previous report from the Oshima lab [13]. Careful examination of this earlier study indicated that the activity
of MMTV-Cre utilized was highly mosaic and thus inefficient recombination of the DNA binding region of thisEts2allele could account for the apparent lack ofEts2function in epithelial cells. In the current work, we used a different Ets2 conditional allele targeting exons 3–5 configured so that only one floxed allele needs to undergo recombination mediated byMMTV-Cre. Our study, ensuring more efficient recombination of the conditional Ets2
allele, unequivocally demonstrates that Ets2 is not required in
mammary tumor cells in the PyMT model employed in both
studies. Functional redundancy of Ets2 with other Ets-family members and/or collaborating transcription factors could account for the lack of a significant effect on tumor growth in epithelial cells. Studies in colon cancer mouse models and more recently in human prostate cancer samples provide evidence that Ets2 can also function as a tumor suppressor gene [39,40,41]. In either scenario, cell context is critical in determining whether Ets2
promotes tumor progression.
A second significant finding presented here is that the consequence of inactivating thisEts2-driven stromal program is tumor specific, sparing normal development of the mammary gland. Comparisons with human stromal gene expression dem-onstrate the mouseEts2pathway functions in human breast cancer progression and correlates with worsened patient outcomes. The results of the matrigel plug assay results imply that fibroblasts acquire a tumor associated ‘‘memory’’ likely dependent on epigenetic changes in these cells, and responsible for the constitutive activation of fibroblasts. Targeting Ets2-dependent DNA and histone modifications in tumor associated fibroblasts may lead to more effective treatments in patients with breast tumors without toxicity to normal tissues [42].
Finally, theEts2 mechanism involves the activation of a gene expression program that leads to increased angiogenesis. Target-ing the tumor vasculature remains an attractive therapeutic target. However, current strategies in which single molecules like VEGF are targeted have demonstrated limited success clinically. Our results indicate that the changes in tumor angiogenesis observed
in vivoare likely regulated by the cumulative action of manyEts2
target genes acting in concert. Defining and targeting the pathway hubs controlled by Ets2 provides an alternative strategy that should be more effective at altering multiple cell and cell-matrix interactions required for tumor angiogenesis.
In conclusion, we have identified Ets2 as a fibroblast-specific effector of tumor growth through a mechanism that involves increased tumor angiogenesis. The results emphasize the potential utility of identifying tumor-dependent, stromal-specific targets for therapeutic intervention in human breast cancer.
Supporting Information
Figure S1 A.X-gal staining of 10 week old mammary glands from PyMT;Ets2db/loxP, PyMT;Fsp-Cre;Ets2db/loxP and
PyMT;MMTV-Cre;Ets2db/loxP animals. Scale bar, 50mm. B.
Genotyping ofEts2allele in epithelial cells from indicated genetic groups. C. Western blot analysis of ETS2 protein levels in fibroblasts isolated from PyMT;Ets2db/loxP and PyMT;Fsp-Cre;Ets2db/loxP mice, a-tubulin blotted as loading control. D. Immunofluorescence staining of cultured mammary fibroblasts from PyMT;Ets2db/loxP (left panel) and PyMT;Fsp-Cre;Ets2db/loxP
mammary glands (n = 2, bars represent means 6 SD, P.0.05, Welch’s t-test assuming unequal variance). F. Whole mount carmine staining of inguinal mammary glands from 6 week old
Ets2db/loxP and Fsp-Cre;Ets2db/loxP mice. L.N., lymph node. Scale
bar, 2mm. G. Whole mount carmine staining of inguinal
mammary glands from 14 days pregnant Ets2db/loxP and Fsp-Cre;Ets2db/loxPmice. L.N., lymph node. Scale bar, 2mm.H.Whole mount carmine staining of inguinal mammary glands from 6 week old PyMT;Ets2db/loxP and PyMT;Fsp-Cre;Ets2db/loxP mice. L.N., lymph node. Scale bar, 2mm.
(TIF)
Figure S2 A.Venn diagram depicting the number of similarly regulated genes in normal fibroblasts (Ets2db/loxPvs.Fsp-Cre;Ets2db/ loxP
, gray circle) and tumor fibroblasts (PyMT;Ets2db/loxP vs.
PyMT;Fsp-Cre;Ets2db/loxP, white circle) harvested from 9 week old mice.B.Functional annotation of tumor-specific (PyMT;Ets2db/loxP
vs.PyMT;Fsp-Cre;Ets2db/loxP) target genes ofEts2.C.Venn diagram depicting number of similarly regulated genes in normal fibroblasts (Ets2db/loxP
vs.Fsp-Cre;Ets2db/loxP
, gray circle) and tumor fibroblasts (ErbB2;Ets2db/loxP vs. ErbB2;Fsp-Cre;Ets2db/loxP, white circle) har-vested from 16 week old mice.D.Functional annotation of tumor-specific (ErbB2;Ets2db/loxPvs.ErbB2;Fsp-Cre;Ets2db/loxP) target genes ofEts2.E, F.Quantitative RT-PCR analysis of indicated genes in independent primary fibroblasts of indicated genotypes. Gene expression is normalized toRpl4expression, and graphed as fold difference between genotypes (values are means between dupli-cates of one representative sample6SD).
(TIF)
Figure S3 A. Immunofluorescence staining for CD31 (red) in mammary gland tumors from 10 week oldPyMT;Ets2db/loxP(panels on the left) andPyMT;Fsp-Cre;Ets2db/loxPmice (panels on the right) shows a decrease in tumor angiogenesis when Ets2 is deleted in stromal fibroblasts. Scale bar, 200mm. Slides were counterstained with DAPI (blue).B.Immunofluorescence staining for CD31 (red) in mammary gland tumors from 16 week old ErbB2;Ets2db/loxP
(panels on the left) and ErbB2;Fsp-Cre;Ets2db/loxP mice (panels on the right) shows a decrease in tumor angiogenesis when Ets2 is deleted in stromal fibroblasts. Scale bar, 200mm. Slides were counterstained with DAPI (blue).
(TIF)
Figure S4 A. Principal Component Analysis (PCA) to show separation of tumor stroma (n = 49, black circles) and normal stroma (n = 52, gray circles) using 38-gene subset PyMT-driven
Ets2 signature.B.Principal Component Analysis (PCA) to show separation of tumor stroma (n = 49, black circles) and normal stroma (n = 52, gray circles) using 36-gene subset ErbB2-driven
Ets2signature.C.Expression of the 38 and 36PyMT-drivenEts2 -dependent genes present in the McGill (left panel) and Stockholm (right panel) stroma and whole tumor data sets, respectively, correlate with patient outcome. Kaplan-Meier curves of high risk and low risk groups based on expression of the 38 and 36Ets2
tumor specific genes (*P,0.05 for McGill data set and *P#0.05 for Stockholm data set).D.Expression of the 36 and 33ErbB2 -drivenEts2-dependent genes present in the McGill (left panel) and Stockholm (right panel) stroma and whole tumor data sets, respectively, correlate with patient outcome. Kaplan-Meier curves of high risk and low risk groups based on expression of the 36 and 33 Ets2 tumor specific genes (*P,0.05 for McGill data set and *P#0.05 for Stockholm data set).
(TIF)
Figure S5 A.Heat map displaying the expression of the human orthologs of the PyMT derived fibroblast Ets2-dependent
endo-thelial cell 9 gene signature in normal- and tumor-stroma from human breast cancer patients. Red and blue regions inside the heat map indicate relative gene expression levels (red, increased and blue, decreased) between the normal and tumor stroma. (P = 0.1014, one-sided Wilcoxon rank sum test, based on 10,000 permutations).B.Principal Component Analysis (PCA) to show separation of tumor stroma (n = 49, black circles) and normal stroma (n = 52, gray circles) with 9 gene fibroblastEts2dependent endothelial cell signature.C.Expression of 7PyMT-drivenEts2 -dependent genes in endothelial cells present in the McGill (left panel) and Stockholm (right panel) stroma and whole tumor data sets, respectively, correlate with patient outcome. Kaplan-Meier curves of high risk and low risk groups based on expression of 7
Ets2tumor-specific genes in endothelial cells (*P,0.05 for McGill data set and *P,0.05 for Stockholm data set).
(TIF)
Table S1 Comparison of gene expression changes in fibroblasts from 9–10 week old Ets2db/loxP and Fsp-Cre;Ets2db/loxP mice identifies 22 genes differentially expressed upon loss of Ets2 (Log fold change.2 and negative log p-value (NLP).4.5).
(DOCX)
Table S2 Gene expression analysis of tumor associated fibroblasts from 9–10 week old PyMT;Ets2db/loxP and PyMT;Fsp-Cre;Ets2db/loxP mice reveals the differential expression of 107 genes withEts2ablation in fibroblasts (Log fold change.2 and NLP.4.5).
(DOCX)
Table S3 Comparison of gene expression changes between normal fibroblasts from 16 week oldEts2db/loxP andFsp-Cre;Ets2db/loxPmice identifies 15 genes regulated byEts2(Log fold change.2).
(DOCX)
Table S4 Gene expression analysis of tumor associated fibroblasts from 16 week old ErbB2;Ets2db/loxP and ErbB2;Fsp-Cre;Ets2db/loxP mice reveals the differential expression of 69 genes when Ets2 is deleted in fibro-blasts (Log fold change.2).
(DOCX)
Table S5 List of 33 differentially expressed genes in endothelial cells from 9–10 week PyMT;Ets2db/loxPand PyMT;Fsp-Cre;Ets2db/loxPmice as a consequence ofEts2 function in PyMT tumor associated fibroblasts (Log fold change.2).
(DOCX)
Table S6. List of qRT-PCR primers and probes used for confirmation of gene expression changes.
(DOCX)
Acknowledgments
We thank L. Cooper and K. Huang for help using quantification software, K. Kornacker and H. Auer for analysis of the microarray data and S. Ghosh for help with GSEA file preparations and analysis runs.
Author Contributions
References
1. Wiseman BS, Werb Z (2002) Stromal effects on mammary gland development and breast cancer. Science 296: 1046–1049.
2. Nelson CM, Bissell MJ (2006) Of extracellular matrix, scaffolds, and signaling: tissue architecture regulates development, homeostasis, and cancer. Annu Rev Cell Dev Biol 22: 287–309.
3. Mueller MM, Fusenig NE (2004) Friends or foes - bipolar effects of the tumour stroma in cancer. Nat Rev Cancer 4: 839–849.
4. Bhowmick NA, Chytil A, Plieth D, Gorska AE, Dumont N, et al. (2004) TGF-beta signaling in fibroblasts modulates the oncogenic potential of adjacent epithelia. Science 303: 848–851.
5. Erez N, Truitt M, Olson P, Arron ST, Hanahan D (2010) Cancer-Associated Fibroblasts Are Activated in Incipient Neoplasia to Orchestrate Tumor-Promoting Inflammation in an NF-kappaB-Dependent Manner. Cancer Cell 17: 135–147.
6. Finak G, Bertos N, Pepin F, Sadekova S, Souleimanova M, et al. (2008) Stromal gene expression predicts clinical outcome in breast cancer. Nat Med 14: 518– 527.
7. Bhowmick NA, Neilson EG, Moses HL (2004) Stromal fibroblasts in cancer initiation and progression. Nature 432: 332–337.
8. Kalluri R, Zeisberg M (2006) Fibroblasts in cancer. Nat Rev Cancer 6: 392–401. 9. Albini A, Sporn MB (2007) The tumour microenvironment as a target for
chemoprevention. Nat Rev Cancer 7: 139–147.
10. Hsu T, Trojanowska M, Watson DK (2004) Ets proteins in biological control and cancer. J Cell Biochem 91: 896–903.
11. Buggy Y, Maguire TM, McDermott E, Hill AD, O’Higgins N, et al. (2006) Ets2 transcription factor in normal and neoplastic human breast tissue. Eur J Cancer 42: 485–491.
12. Man AK, Young LJ, Tynan JA, Lesperance J, Egeblad M, et al. (2003) Ets2-dependent stromal regulation of mouse mammary tumors. Mol Cell Biol 23: 8614–8625.
13. Tynan JA, Wen F, Muller WJ, Oshima RG (2005) Ets2-dependent microen-vironmental support of mouse mammary tumors. Oncogene 24: 6870–6876. 14. Zabuawala T, Taffany DA, Sharma SM, Merchant A, Adair B, et al. (2010) An
ets2-driven transcriptional program in tumor-associated macrophages promotes tumor metastasis. Cancer Res 70: 1323–1333.
15. Trimboli AJ, Cantemir-Stone CZ, Li F, Wallace JA, Merchant A, et al. (2009) Pten in stromal fibroblasts suppresses mammary epithelial tumours. Nature 461: 1084–1091.
16. Trimboli AJ, Fukino K, de Bruin A, Wei G, Shen L, et al. (2008) Direct evidence for epithelial-mesenchymal transitions in breast cancer. Cancer Res 68: 937– 945.
17. Inai T, Mancuso M, Hashizume H, Baffert F, Haskell A, et al. (2004) Inhibition of vascular endothelial growth factor (VEGF) signaling in cancer causes loss of endothelial fenestrations, regression of tumor vessels, and appearance of basement membrane ghosts. Am J Pathol 165: 35–52.
18. Mook OR, Van Overbeek C, Ackema EG, Van Maldegem F, Frederiks WM (2003) In situ localization of gelatinolytic activity in the extracellular matrix of metastases of colon cancer in rat liver using quenched fluorogenic DQ-gelatin. J Histochem Cytochem 51: 821–829.
19. Schindelin J, Arganda-Carreras I, Frise E, Kaynig V, Longair M, et al. (2012) Fiji: an open-source platform for biological-image analysis. Nat Methods 9: 676– 682.
20. Soule HD, McGrath CM (1986) A simplified method for passage and long-term growth of human mammary epithelial cells. In Vitro Cell Dev Biol 22: 6–12. 21. Auer H, Newsom DL, Nowak NJ, McHugh KM, Singh S, et al. (2007)
Gene-resolution analysis of DNA copy number variation using oligonucleotide expression microarrays. BMC Genomics 8: 111.
22. Irizarry RA, Bolstad BM, Collin F, Cope LM, Hobbs B, et al. (2003) Summaries of Affymetrix GeneChip probe level data. Nucleic Acids Res 31: e15. 23. Sharma SM, Bronisz A, Hu R, Patel K, Mansky KC, et al. (2007) MITF and
PU.1 recruit p38 MAPK and NFATc1 to target genes during osteoclast differentiation. J Biol Chem 282: 15921–15929.
24. Subramanian A, Tamayo P, Mootha VK, Mukherjee S, Ebert BL, et al. (2005) Gene set enrichment analysis: a knowledge-based approach for interpreting genome-wide expression profiles. Proc Natl Acad Sci U S A 102: 15545–15550. 25. Chen J, Bardes EE, Aronow BJ, Jegga AG (2009) ToppGene Suite for gene list enrichment analysis and candidate gene prioritization. Nucleic Acids Res 37: W305–311.
26. Goeman JJ (2010) L1 penalized estimation in the Cox proportional hazards model. Biom J 52: 70–84.
27. Wei G, Srinivasan R, Cantemir-Stone CZ, Sharma SM, Santhanam R, et al. (2009) Ets1 and Ets2 are required for endothelial cell survival during embryonic angiogenesis. Blood 114: 1123–1130.
28. Lin EY, Jones JG, Li P, Zhu L, Whitney KD, et al. (2003) Progression to malignancy in the polyoma middle T oncoprotein mouse breast cancer model provides a reliable model for human diseases. Am J Pathol 163: 2113–2126. 29. Wagner KU, Wall RJ, St-Onge L, Gruss P, Wynshaw-Boris A, et al. (1997)
Cre-mediated gene deletion in the mammary gland. Nucleic Acids Res 25: 4323– 4330.
30. Yamamoto H, Flannery ML, Kupriyanov S, Pearce J, McKercher SR, et al. (1998) Defective trophoblast function in mice with a targeted mutation of Ets2. Genes Dev 12: 1315–1326.
31. Soriano P (1999) Generalized lacZ expression with the ROSA26 Cre reporter strain. Nat Genet 21: 70–71.
32. Fowles LF, Martin ML, Nelsen L, Stacey KJ, Redd D, et al. (1998) Persistent activation of mitogen-activated protein kinases p42 and p44 and ets-2 phosphorylation in response to colony-stimulating factor 1/c-fms signaling. Mol Cell Biol 18: 5148–5156.
33. Chantrain CF, Shimada H, Jodele S, Groshen S, Ye W, et al. (2004) Stromal matrix metalloproteinase-9 regulates the vascular architecture in neuroblastoma by promoting pericyte recruitment. Cancer Res 64: 1675–1686.
34. Norrby K (2006) In vivo models of angiogenesis. J Cell Mol Med 10: 588–612. 35. Crawford Y, Kasman I, Yu L, Zhong C, Wu X, et al. (2009) PDGF-C mediates the angiogenic and tumorigenic properties of fibroblasts associated with tumors refractory to anti-VEGF treatment. Cancer Cell 15: 21–34.
36. Bergers G, Brekken R, McMahon G, Vu TH, Itoh T, et al. (2000) Matrix metalloproteinase-9 triggers the angiogenic switch during carcinogenesis. Nat Cell Biol 2: 737–744.
37. Pawitan Y, Bjohle J, Amler L, Borg AL, Egyhazi S, et al. (2005) Gene expression profiling spares early breast cancer patients from adjuvant therapy: derived and validated in two population-based cohorts. Breast Cancer Res 7: R953–964. 38. van de Vijver M (2005) Gene-expression profiling and the future of adjuvant
therapy. Oncologist 10 Suppl 2: 30–34.
39. Grasso CS, Wu YM, Robinson DR, Cao X, Dhanasekaran SM, et al. (2012) The mutational landscape of lethal castration-resistant prostate cancer. Nature 487: 239–243.
40. Munera J, Cecena G, Jedlicka P, Wankell M, Oshima RG (2011) Ets2 regulates colonic stem cells and sensitivity to tumorigenesis. Stem Cells 29: 430–439. 41. Sussan TE, Yang A, Li F, Ostrowski MC, Reeves RH (2008) Trisomy represses
Apc(Min)-mediated tumours in mouse models of Down’s syndrome. Nature 451: 73–75.