Estrogen Receptor Dependent
Genetic and Epigenetic Factors
of Tamoxifen Resistance
Dissertation submitted to
Faculdade de Ciências Médicas
Universidade Nova de Lisboa for the degree of
Doctor in Oncology - Breast Cancer
Sandra Margarida Caldas Amaral
The research described in this thesis was carried out at the Dr.
Margarete Fischer-Bosch-Institute of Clinical Pharmacology,
Stuttgart and University Tuebingen, Germany under the
supervision of Prof. Dr. Hiltrud Brauch and Prof. Dr. José Luis
Passos Coelho.
This work was financially supported by a grant from Fundação
para a Ciência e a Tecnologia, Lisboa, Portugal and by 5FP Marie
Curie Training Program “Fighting Breast Cancer” (EU 5FP;
HPTM-CT-2001-00269)
“The real voyage of discovery consists not in seeking new
landscapes, but in having new eyes”
To all breast cancer patients
Acknowledgments
First of all I would like to show my true gratitude to Dr. phil. nat. Werner
Schroth, post-doc at my working group, with whom I have learned all
laboratory methodologies, scientific thinking, research organization, and
“bench” persistence. Dr. Schroth is not only an outstanding scientist and
teacher but also a great friend.
To Prof. Dr. Hiltrud Brauch, my direct supervisor in Germany, I would like to
show my appreciation for constant support, enthusiasm, and scientific
discussion.
I would like also to thank my supervisor in Portugal, Prof. Dr. José Luis
Passos Coelho, for being available to all my contacts, doubts and scientific
discussion.
To Prof. Dr. Peter Fritz, previous chief director of the pathology department of
the Robert-Bosch hospital, I would like to thank for working side by side with
me, namely on scoring stained paraffin sections; and for having an open mind
to discuss scientific knowledge and IHC methods.
To Dr. Christina Justenhoven, a post-doc at my working group, for being
available both for professional as well as personal support.
I would like to show my appreciation to Matjaž Rokavec, PhD student at my
working group, for being always available to exchange his technical skills,
scientific knowledge and support, besides being a good friend.
To Dr. Monica Istrate, great friend and PhD colleague from the Institute, for
being always available to share scientific knowledge and discussion; and
I would like to thank my great friend and PhD colleague from the Institute,
Lydia Antoniadou, for a wonderful friendship and constant support.
I would like to show my appreciation to Prof. Dr. Michel Eichelbaum, previous
director of the Institute for Clinical Pharmacology in Stuttgart, for being
attentive and having a critical attitude to the scientific output of all groups,
dispensing some of his time to show recognition to foreigner students like me.
To all colleagues in the Institute for the scientific and cultural exchange.
To my parents and sisters, for believing in me and above all, showing their
unconditional support.
To my son for teaching me priorities in life.
__
I would like to acknowledge the Fundação para a Ciência e a Tecnologia in
Scientific publications as PhD work
• Sandra Amaral, Werner Schroth, Sibylle Kugler, Peter Fritz, Wolfgang Simon, Hiltrud Brauch. The promoter C specific ER isoform is associated with tamoxifen outcome in breast cancer. Breast Cancer Res Treat 118, 323-331, 2009
• Matjaž Rokavec, Werner Schroth, Sandra Amaral, Peter Fritz, Lydia Antoniadou, Damjan Glavač, Wolfgang Simon, Mathias Schwab, Michel Eichelbaum, and Hiltrud Brauch: A polymorphism in the TC21
promoter associates with an unfavorable tamoxifen treatment outcome in breast cancer. Cancer Research 68: 9799-9808, 2008
• Sandra Amaral, Werner Schroth, Peter Fritz, Hiltrud Brauch: Promoter Usage of Estrogen Receptor Isoforms and Prognostic Value in Breast Cancer. AACR Special Conference Proceedings, Advances in Breast Cancer Research: Genetics, Biology, and Clinical Applications abstract A51, 2005
• Sandra Amaral, Schroth W, Fritz P, and Brauch H: Expression regulation of ER-alpha by ESR1 promoter methylation and prognostic value of ESR1 isoform C for survival of breast cancer patients. Breast Disease 25: 60, 2006
• Peter Fritz, Sebastian Klenk, Werner Schroth, Sandra Amaral, Lydia Antoniadou, Andreas Gerteis, Wolfgang Simon, Elke Heidemann, Friedhelm Brinckmann, German Ott, Hiltrud Brauch, Elisabeth Lüttgen, Mathias Schwab: Database long-time follow-up as a molecular biology instrument for analysis in breast carcinoma. Conference Proceedings, 53rd Annual meeting for German association of medical informatics, biometry and epidemiology abstractM17-4, 2008
Abbreviations
aa – amino acids
AB – antibody
AF-1 – transcription activation function 1
AF-2 – transcription activation function 2
AI – aromatase inhibitors
AIB1 - amplified in breast cancer
AKT - protein kinase B
amp – ampicillin
AP1 - activator protein 1
bp – base pairs
BRA – bisulfite restriction analyses
CCND1 – cyclin D1 gene
CCS – charcoal stripped calf serum
cDNA – complementary DNA
COBRA - combined bisulfite restriction analysis
CpG – cytosine-phospho guanine
Ct - threshold cycle
DAB – diaminobenzidine
DBD – DNA binding domain
DCC – dextran-coated charcoal assay
DCIS – ductal cancinoma in situ
DEPC – diethylpyrocarbonate
DMEM – Dulbecco's Modified Eagle's Medium
DNA – deoxyribonucleic acid
EDTA – ethylenediaminetetraacetic acid
EGFR – epidermal growth factor receptor
EMSA – electrophoretic mobility shift assay
ER – estrogen receptor
ERα – estrogen receptor alpha ERß – estrogen receptor beta
ERBF-1 – estrogen receptor binding factor 1
ERK - extracellular signal-regulated kinase
ESR1 – estrogen receptor 1 gene
ESR2 – estrogen receptor 2 gene
FCS – fetal calf serum
G3PD – glyceraldehyde-3-phosphate dehydrogenase gene
GUS – ß-Glucuronidase gene
H12 – helix 12
HDAC – histone deacetylases
HER – human epidermal receptor
HPLC – high performance liquid chromatography
HRP – horse reddish peroxidase
HRT – hormone replacement therapy
IGF-1 – insulin-like growth factor 1
IHC – immunohistochemistry
Ki-67 – Kiel 67 antigen
LB – Luria broth
LBA – ligand-binding assay
LBD – ligand-binding domain
LCIS – lobular carcinoma in situ
LHRH – luteinizing hormone-releasing hormone
MALDI-TOF MS – matrix-assisted laser desorption/ionization time-of-flight
mass spectrometry
MAPK – mitogen-activated protein kinase
MAS – massARRAY system
ME – 2-mercaptoethanol
min – minutes
M-MLV – moloney murine leukemia virus
MSP – methylation-specific polymerase chain reaction
NO – nitric oxide
4-OH-Tam – 4-hydroxy-tamoxifen
o/n – overnight
PAGE – polyacrylamide gel electrophoresis
PBS – phosphate buffered saline
PCR – polymerase chain reaction
PgR – progesterone receptor gene
PI3K - phosphatidylinositol-3-kinase
pS2 – trefoil factor 1 gene
RNA – ribonucleic acid
rpm – rotations per minute
RT – room temperature
SAP – shrimp alkaline phosphatase
SDS – sodium dodecyl sulfate
sec – seconds
SERM – selective estrogen-receptor modulator
SNP - single nucleotide polymorphism
SOC – super optimal broth with catabolic repression
SP1 - stimulatory protein 1
Src - celular-sarcoma gene
18S-rRNA – ribosomal 18S ribonucleic acid gene
STAR – Study of tamoxifen and raloxifen
TAE – tris, acetic acid, ethylenediaminetetraacetic acid
TDLU – terminal duct’s lobuloalveolar units
TGFα - transforming growth factor alpha TK – tyrosine kinase
TSG – tumor suppressor gene
5’UTR – 5’-untranslated region
List of Figures
pageFig. 1 Pathways of peripheral estrogen biosynthesis 23
Fig. 2 Mechanisms of ER action 25
Fig. 3 ER as a co-activator 26
Fig. 4 ER activation by MAPK pathawys 27
Fig. 5 Homology domains between ERα and ERß 31
Fig. 6 ERß protein isoforms 34
Fig. 7 ESR1 gene 36
Fig. 8 ESR2 gene 37
Fig. 9 ER tissue specific effects 43
Fig. 10 Types of drug resistance to SERM’s action 46
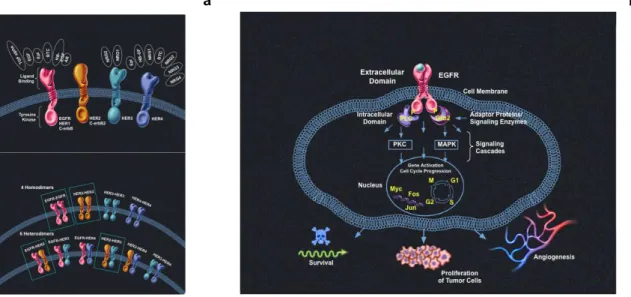
Fig. 11 HER family 49
Fig. 12 Hollow needle punching device 54
Fig. 13 ESR1 Real-time PCR amplicons annotation 59
Fig. 14 ESR2 Real-time PCR amplicons annotation 60
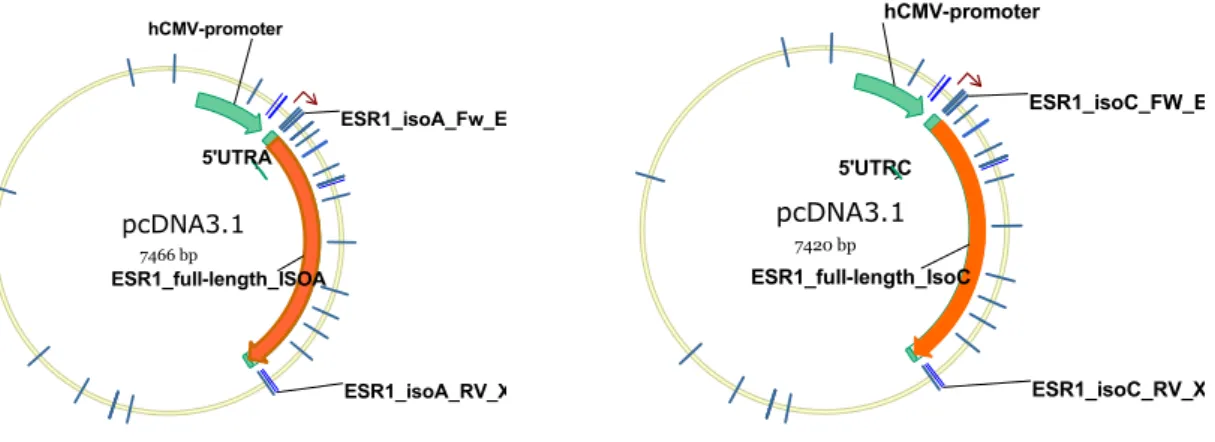
Fig. 15 Full-length cDNA ESR1_A and ESR1_C constructs 66
Fig. 16 ESR1 methylation amplicons annotation (qualitative study) 73
Fig. 17 ESR2 methylation amplicons annotation (qualitative study) 74
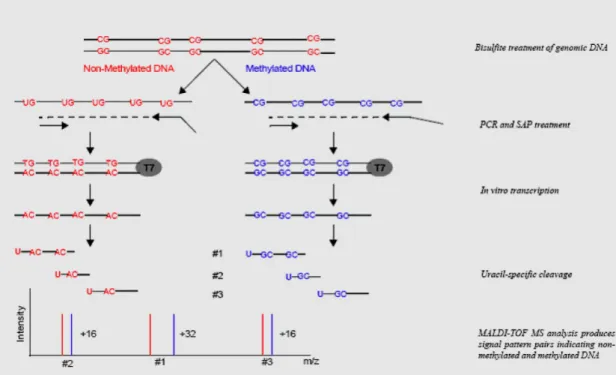
Fig. 18 Workflow for methylation massArray analyses 78
Fig. 19 CpG islands prediction 80
Fig. 20a Levels of expression of ESR1 transcripts 90
Fig. 20b Correlation of ESR1 transcripts with ERα-status 90 Fig. 21 Example for breast cancer tissue ERß1 IHC staining 91
Fig. 22 ERß1 and ERß-all protein expression 91
Fig. 23 Relative expression of ESR2 transcript levels 92
Fig. 24 Correlation of ESR2 isoforms with ERα-status 93 Fig. 25 Correlation of ESR2 transcript levels with ERß1 protein 94
Fig. 26a Kaplan Meier curves (OS) by ERα-status 95 Fig. 26b Kaplan Meier curves (OS) by ESR1_ex3 expression levels 95
Fig. 26c Kaplan Meier curves (OS) by ESR1_C expression levels 95
Fig. 28a Kaplan Meier curves (OS) for tamoxifen treated patients 96
Fig. 28b Kaplan Meier curves (OS) for ERα/PgR double positive cases 96
Fig. 29 Example for MSP gel patterns 97
Fig. 30 CpG methylation at ESR1 promoters and ERα-status 98
Fig. 31 Example for BRA patterns (TaiI diagnosis) 98 Fig. 32 CpG methylation at ESR1 promoters and ESR1 transcripts 99
Fig. 33 Example for BRA patterns (BstUI diagnosis) 100
Fig. 34 CpG methylation at ESR2 promoters and ESR2 transcripts 100
Fig. 35 Histograms for mean quantified methylation at ESR1 promoters 101
Fig. 36 Representation of quantitative methylation results 102
Fig. 37 CpG quantified methylation at ESR1 and transcript levels 103
Fig. 38 CpG quantified methylation in breast tumor and normal samples 104 Fig. 39 mRNA half-lives for ESR1 transcripts in MCF-7 cell line 105
Fig. 40 mRNA half-lives for ESR1 transcripts in MDA-MB-231 cell line 106
Fig. 41 Western-blot for ERα protein at transfected cell lines 106
Fig. 42a Western-blot for ERα protein of actinomycin D treated cells 107
Fig. 42b Densitometry for ERα protein in transfected cells 107
Fig. 43 Predicted mRNA secondary structure 108
Fig. 44 EMSA for ERBF-1 specific probe 109
Fig. 45 ESR1_C expression in 4-OH-Tam treated transfected cells 110
Fig. 46 ESR1_A expression in 4-OH-Tam treated transfected cells 111
Fig. 47 ESR1_ex3 expression in 4-OH-Tam treated transfected cells 112
Fig. 48 pS2 expression in 4-OH-Tam treated transfected cells 112
Fig. 49 PgR expression in 4-OH-Tam treated transfected cells 113
List of Tables
pageTable 1 Patients and samples 53
Table 2 DNase treatment 56
Table 3 cDNA synthesis 57
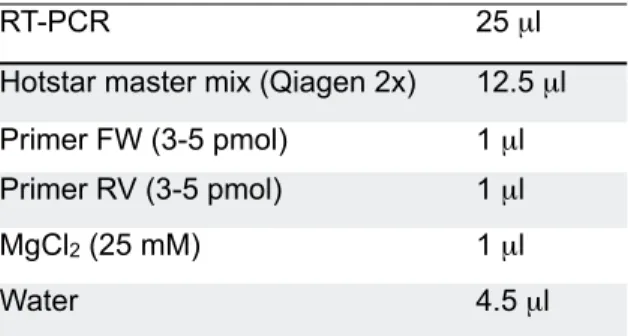
Table 4 RT-PCR reaction 58
Table 5 Real-time mix 58
Table 6 RT-PCR primers 59
Table 7 ESR1_A and 18s-rRNA primers 61
Table 8 PgR, CCND1 and pS2 primers 62
Table 9 Transfection reaction 64
Table 10 Amplification of full-length ESR1_A and ESR1_C cDNA 65
Table 11 Tagging inserts 65
Table 12 Ligation of insert to vector 66
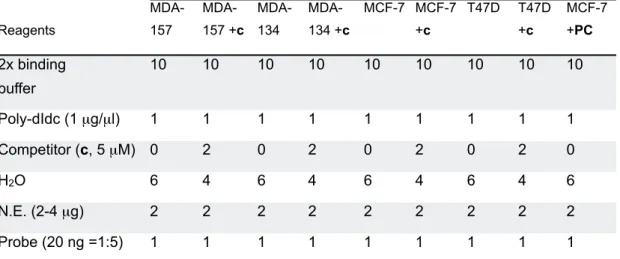
Table 13 Preparation of fluorescent labeled probe (EMSA) 68
Table 14 DNA-protein binding reaction 69
Table 15 Primers for bisulfite restriction analysis 75
Table 16 Methylation Specific PCR reaction 76
Table 17 Methylation Specific PCR primers 77
Table 18 Bisulfite sequencing reaction 77
Table 19 MassArray PCR reaction 79
Table 20 MassArray primers 80
Table 21 SAP reaction 81
Table 22 Reverse transcription reaction 81
Table of Contents
...
Abstract
19
...
Resumo
20
...
Chapter 1. Introduction
22
...
1.1. Epidemiology of breast cancer
22
...
1.2. Estrogens
22
... 1.2.1. Synthesis, transport and metabolism 22
... 1.2.2. Molecular mechanisms and actions 24
...
1.3. Estrogen Receptors
30
...
1.3.1. Discovery of ER 30
...
1.3.2. ER protein structure 31
...
1.3.3. ER genes: ESR1 and ESR2 35
...
1.3.4. Expression of ER subtypes 38
...
1.3.5. Methods for ER assessment 38
...
1.4. Molecular regulation
40
...
1.4.1. Epigenetic regulation 40
... 1.4.2. Regulation by transcription factors 41
...
1.4.3. ER regulation by estradiol 41
...
1.5. Hormonal therapy
42
...
1.5.1. SERMs 42
...
1.5.2. Pure anti-estrogens and AIs 45
...
1.5.3. Resistance mechanisms 46
...
Chapter 2. Study Aims
51
...
Chapter 3. Patients and Methods
53
...
3.1. Patients’ samples
53
...
3.2. DNA and RNA extraction
54
.. 3.2.1. Isolation from formalin fixed paraffin-embedded tissue blocks 54
... 3.2.2. Isolation from breast cancer cell lines 55
...
3.3. mRNA expression
57
...
3.3.1. cDNA synthesis 57
...
3.3.2. RT-PCR 57
...
3.3.3. Real-Time PCR 58
...
3.3.4. mRNA stability assay 60
... 3.3.5. mRNA expression of target genes upon treatment 61
... 3.3.6. In Silico analysis of ESR1 RNA secondary structure 62
...
3.3.7. Statistical analysis 62
...
3.4. Culture of breast cancer cells
63
...
3.4.1. Cell culture 63
...
3.4.2. Transient transfections 64
...
3.5. Cloning
65
... 3.5.1. Generation of full length cDNA ESR1 constructs 65
... 3.5.2. Transformation of Top10 chemically competent E.Coli cells 67
...
3.6. Electrophoretic Mobility Shift Assay (EMSA)
67
... 3.6.1. Preparation of nuclear extracts from cells 67
... 3.6.2. Preparation of the fluorescence labeled probe 68
...
3.6.3. DNA-protein binding reaction 69
...
3.7. Immunohistochemistry
70
...
3.7.1. Tissue microarray (TMA) 70
...
3.7.2. Staining for ERα 70
...
3.7.3. Staining for ERß isoforms 70
...
3.8. Western blotting
72
...
3.9. Methylation study
73
...
3.9.1. Bisulfite treatment 74
... 3.9.2. Bisulfite restriction analyses 74
...
3.9.3. Methylation specific PCR 75
...
3.9.4. Bisulfite sequencing 77
. 3.9.5. MassARRAY system (EpiTYPER) for quantitative methylation 78
...
3.10. Buffers
82
...
3.10.1. Basic buffers 82
... 3.10.2. Buffers and solutions for nucleic acids extraction 83
... 3.10.3. Buffers and solutions for Agarose-electrophoresis 83
... 3.10.4. Solutions for the cell culture 84
... 3.10.5. Solutions for bacteria transformation 84
... 3.10.6. Buffers for nuclear cell extracts 85
...
3.10.7. Buffers for EMSA 85
...
3.10.8. Buffers for SDS-PAGE 86
...
3.10.9. Buffers for IHC 87
... 3.10.10. Solutions to purify sequencing products 88
...
Chapter 4. Results
89
...
4.1. Tumor specific expression patterns of ER
89
...
4.1.1. ERα protein expression 89
...
4.1.2. ERα mRNA expression 89
...
4.1.3. ERß protein expression 90
...
4.1.4. ERß mRNA expression 92
...
4.2. ER expression and survival
93
...
4.3. ER expression and prediction of tamoxifen response
96
4.4. Characterization of methylation status at ESR1 and ESR2
...
promoters
97
...
4.4.1. Qualitative assessment 97
...
4.4.2. Quantitative assessment 100
...
4.5. Mechanistic investigations
104
4.5.1. ESR1_C and ESR1_A transcript stability in relation to the whole ...
ESR1 mRNA (ESR1_ex3) 104
4.5.2. Investigation of the ERα protein translated from ESR1_C and
...
ESR1_A transcripts 106
4.5.3. Comparison of ESR1_C and ESR1_A transcript secondary ... structure influencing translation efficiency 108
4.5.4. Investigation of ESR1 promoter C regulation by transcription ...
factor-promoter interactions 108
4.5.5. Study of differential activation of downstream target genes ... between ESR1_C and ESR1_A transcripts 110
...
Chapter 5. Discussion
115
...
Chapter 6. References
126
Abstract
The decision of endocrine breast cancer treatment relies on ERα IHC-based assessment. However, ER positivity does not predict response in all cases in
part due to IHC methodological limitations. We investigated whether ESR1
and ESR2 gene expression and respective promoter methylation may be
related to non-favorable outcome of a proportion of tamoxifen treated patients
as well as to ERα and ERß loss. Formalin-fixed paraffin-embedded breast cancer samples from 211 patients diagnosed between 1988 and 2004
were submitted to IHC-based ERα and ERß protein determination. ESR1
whole mRNA and promoter C specific transcript levels, as well as ESR2_ß1,
ESR2_ß2/cx, and ESR2_ß5 transcripts were assessed by real-time PCR.
ESR1 promoters A and C, and ESR2 promoters 0N and 0K were investigated
by CpG methylation analysis using bisulfite-PCR for restriction analysis, or
methylation specific PCR. Due to the promising results related to ESR1
promoter methylation, we have used a quantification method by
matrix-assisted laser desorption/ionization time-of-flight mass spectrometry
(MALDI-TOF MS) together with Epityper software to measure methylation at
promoters A and C. mRNA stability was assessed in actinomycin D treated
MCF-7 and MDA-MB-231 cells. ERα protein was quantified using transiently
transfected breast cancer cells. Low ESR1_C transcript levels were
associated with better overall survival (p = 0.017). High levels of ESR1_C
transcript were associated with non-favorable response in tamoxifen treated
patients (HR = 2.48; CI 95% 1.24-4.99), an effect that was more pronounced
in patients with ERα/PgR double-positive tumors (HR = 3.41; CI 95%
1.45-8.04). The ESR1_C isoform had a prolonged mRNA half-life and a more
relaxed 5’UTR structure compared to ESR1_A isoform. Western-blot analysis
showed that at protein level, the promoter selectivity is undistinguishable.
There was no correlation between levels of ESR2 isoforms or ESR2 promoter
methylation and ERß protein staining. ESR1 promoter C CpG methylation and
not promoter A was responsible for ERα loss. We propose ESR1_C levels as a putative novel marker for breast cancer prognosis and prediction of
Resumo
A decisão da terapêutica hormonal no tratamento do cancro da mama
baseia-se na determinação do receptor de estrogénio alfa por imunohistoquímica
(IHC). Contudo, a presença deste receptor não prediz a resposta em todas as
situações, em parte devido a limitações do método IHC. Investigámos se a
expressão dos genes ESR1 e ESR2, bem como a metilação dos respectivos
promotores, pode estar relacionada com a evolução desfavorável de uma
proporção de doentes tratados com tamoxifeno assim como com a perda dos
receptores de estrogénio alfa (ERα) e beta (ERß). Amostras de 211 doentes com cancro da mama diagnosticado entre 1988 e 2004, fixadas em formalina
e preservadas em parafina, foram utilizadas para a determinação por IHC da
presença dos receptores ERα e ERß. O mRNA total do gene ESR1 e os níveis específicos do transcrito derivado do promotor C (ESR1_C), bem como
dos transcritos ESR2_ß1, ESR2_ß2/cx, and ESR2_ß5 foram avaliados por
Real-time PCR. Os promotores A e C do gene ESR1 e os promotores 0K e
0N do gene ESR2 foram investigados por análise de metilação dos
dinucleotidos CpG usando bisulfite-PCR para análise com enzimas de
restrição, ou para methylation specific PCR. Atendendo aos resultados
promissores relacionados com a metilação do promotor do gene ESR1,
complementamos o estudo com um método quantitativo por matrix-assisted
laser desorption/ionization time-of-flight mass spectrometry (MALDI-TOF MS)
suportado pelo software Epityper para a medição da metilação nos
promotores A e C. Fez-se a avaliação da estabilidade do mRNA nas linhas
celulares de cancro da mama MCF-7 e MDA-MB-231 tratadas com
actinomicina D. Baixos níveis do transcrito ESR1_C associaram-se a uma
melhor sobrevivência global (p = 0.017). Níveis elevados do transcrito
ESR1_C associaram-se a uma resposta inferior ao tamoxifeno (HR = 2.48; CI
95% 1.24-4.99), um efeito mais pronunciado em doentes com tumores de
fenótipo ERα/PgR duplamente positivo (HR = 3.41; CI 95% 1.45-8.04). A
isoforma ESR1_C mostrou ter uma semi-vida prolongada, bem como uma
estrutura secundária da região 5’UTR muito mais relaxada em comparação
proteína, a selectividade de promotores é indistinguivel. Não se detectou
qualquer correlação entre os níveis das isoformas do gene ESR2 ou entre a
metilação dos promotores do gene ESR2, e a detecção da proteína ERß. A
metilação do promotor C do gene ESR1, e não do promotor A, foi
responsável pela perda do receptor ERα. Estes resultados sugerem que os níveis do transcrito ESR1_C sejam usados como um novo potencial
marcador para o prognóstico e predição de resposta ao tratamento com
Chapter 1. Introduction
1.1. Epidemiology of breast cancer
At the outset of the 21st century, breast cancer remains one of the most
prevalent cancers, the leading cause of cancer death among women
worldwide1. Incidence rates have risen approximately 30% over the past 25
years in western countries. The same tendency has been seen in developing
countries. Although the reasons are not completely understood, changes in
reproductive patterns, increased screening and decrease on physical activity
are thought to be involved. The most recent report of the American Cancer
Society estimates for US, during 2008, are 182,460 new cases of invasive
breast cancer and 67,770 new cases of carcinoma in situ2. According to this
source, in the period of 2001-2004, there was a decrease in the incidence of
breast cancer in the US due to reduction of hormone replacement therapy, as
well as from mammography screening. Differently from other cancers where
the socioeconomic context directly influences the onset of distinct types of
cancer, breast cancer incidence follows a similar tendency in developed and
developing countries.
1.2. Estrogens
1.2.1. Synthesis, transport and metabolism
The investigation of factors affecting the development of breast cancer has
shown that steroid hormones have a central role in directing the growth of
these tumors. Among naturally occurring C18 steroid hormones
androstenedione and testosterone derived from cholesterol are the obligatory
precursors of estrogens. In three consecutive hydroxylating reactions the
P450 aromatase monooxygenase enzyme complex catalyzes their conversion
into estrone and estradiol, respectively. This aromatization reaction is the last
step in the estrogen formation (Figure 1). In the liver, estradiol can be
converted into estriol. In pre-menopausal women, estradiol originates from the
theca and granulosa cells of the ovaries that produce both androgens and
estrogens. In men, aromatase activity is located in Leydig cells of the testis.
sexes3. In post-menopausal women estrone is the predominant estrogen
synthesized through extra-gonadal testosterone conversion as a function of
age and body weight. In fact, in peripheral tissues, estrogens production and
inter-conversion depend on the local expression and activity of the aromatase,
while during the reproductive period gonadotropines control estrogen
production. Estrogens are metabolized by hydroxylation and subsequent
methylation forming catechol and methoxylated estrogens, namely
2-hydroxyestrogens, 4-2-hydroxyestrogens, and 16α-hydroxyestrogens. Among the various phase 1 metabolites, 4-hydroxyestrone and 16α-hydroxyestradiol are considered to be carcinogenic4. Elimination takes place by sulfation and
glucuronidation, and the conjugates are excreted into the bile or urine.
Fig. 1 Pathways of estrogen biosynthesis. DHEA, Dihydroepiandrosterone; E1, Estrone; E2, 17ß-Estradiol; HSD, Hydroxysteroid dehydrogenase; CYP, Cytochrome P450 enzymes; scc,
steroid cholesterol side chain scission; arom, aromatase; KSR, ketosteroid redutase. From
the obligatory estrogen precursors androstenedione is the main form in ovaries and
testosterone in extra-gonodal tissues.
1.2.2. Molecular mechanisms and actions
The specific nuclear actions of estrogens are determined by the subtype, or
by isoforms of the ER involved, the structure of the hormone, the
characteristics of the target gene promoter, and the balance of co-activators
and co-repressors that modulate the final transcriptional response to
complexes of estrogen and ER3.
The classical pathway
Ligand dependent receptor activation
The ER is a transcription factor that once activated establishes nuclear
inter-action by binding to regulatory regions of estrogen target genes. Free
estrogen diffuses into the cell and binds to the Ligand Binding Domain (LBD)
of the ER protein. ER is a predominantly nuclear protein existing in an inactive
complex with receptor-associated proteins such as heat-shock protein 90.
These proteins serve as chaperones that stabilize the un-activated receptor
and quench the DNA Binding Domain (DBD). Upon ligand binding, the
receptor dissociates from its cytoplasmatic chaperons and the estrogen-ER
complex translocates into the cell nucleus. Hormone binding induces
conformational changes that activate the receptor5, allow it to dimerize, and to
bind to specific consensus sites in promoters of target genes (Figure 2a). For
ER, these elements are evolutionary conserved palindromic sequences
separated by three variant bases (5’-GGTCAnnnTGACC-3’), also known as
estrogen responsive elements (ERE). Activated ligand-receptor complex
recruits co-activators to induce transcription of target downstream genes.
Variants of ERE, differing in one or more bases, or even being partial ERE
separated by many base pairs have been described. The former type of
variant affects affinity to ER6 and the latter can confer estrogen
responsiveness when partial elements act in combination7. When estrogen
target genes lack functional ERE, estrogen may act by modulating the activity
of other transcription factors such as the activating protein 1 (AP-1). In this
case the binding of ER to the sub-units of AP-1, Jun and Fos, generates the
formation of a transcription factor8.
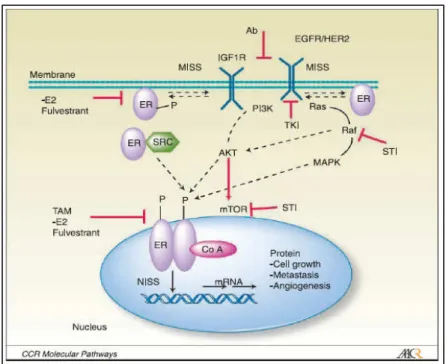
Fig. 2 Mechanisms of ER action. The classical pathway is represented by nuclear models and the alternative pathway by plasma membrane/nuclear models.
Alternative pathways
Ligand independent activation of ER
In the absence of hormonal ligand, the ER function can be altered by means
of phosphorylation at specific serine or tyrosine residues. Mitogen-activated
protein kinases (MAPK) and receptor tyrosine kinases (TK) mediate this
reaction upon activation by growth factors signals. Activated MAPK elicit the
transduction of extra-cellular signals to intracellular targets through membrane
receptors9. Cross-talk between signal pathways have been reported in
activation of estrogen-independent ER by dopamine, epidermal growth
factor10, transforming growth factor α, insuline-like growth factor-1, heregulin,
and cyclic AMP3 (Figure 2d). Serine residues are the predominantly modified
amino-acids in ER, some of them being located in the amino-terminus of the
AF-1 region (see below) like Ser-104, Ser-106, Ser-118, and Ser-16711. In
addition, ER co-activators such as AIB1 may be subjected to phosphorylation
by these kinase pathways12.
Non-classical binding through AP-1
ER can activate transcription through protein-protein interactions excluding
Fos transcription factor family together with other factors and through sites
that bind SP1. According to Kushner13 there may exist at least two
mechanisms by which ER can increase the activity of Jun/Fos complexes,
depending on the ER subtype and the specific ligand used (Figure 2b). One
hypothesis is that estrogen- or anti-estrogen-bound ERα complexes use AF-1 and AF-2 domains to bind to the p160 SRC component of the co-activator
complex already recruited by Jun/Fos, triggering the co-activator pathway to a
higher state of activity (Figure 3). An alternative mechanism suggests that
ERß or truncated variants at the amino-terminus of ERα lacking AF-1 region, when bound by specific anti-estrogens/SERM, use their DBD to detach HDAC
co-repressor complexes from Jun/Fos complexes. As a consequence, activity
of the co-activators on these AP-1 sites becomes unrestrained. With regard
to the AF-1 independent hypothesis, anti-estrogens are preferred ligands at
AP-1 sites, with the pure anti-estrogen (fulvestrant) and raloxifen being the
most potent followed by tamoxifen, and estrogens which have almost no
effect. In this context, the ratio of ERß/ERα in a given tumor cell may affect the response to tamoxifen. Moreover, tamoxifen resistance has been
associated with increase in AP-1 activity14.
Non-genomic signaling
Some of the estrogen actions occur too fast to be explained by the classical
estrogen-ER nuclear interaction since the latter takes minutes or hours.
Evidence for a plasma membrane ER was proposed in the late seventies,
based on studies focused on the vascular system where estrogen exert
effects mediated in part by the endothelium-derived signaling molecule nitric
Fig. 3 ER as a co-activator. Estrogen-bound ERα complexes use AF-1 and AF-2 domains to bind to the
SRC component of the co-activator complex already
oxide (NO)16. Indeed, the rapid onset of estrogenic action is due to
cell-surface moieties of ER on cell membranes, e.g. short-term vasodilatation of
coronary arteries, the rapid insulinotropic effect of estradiol on pancreatic beta
cells, and the rapid activation of growth-factor-related signaling pathways in
neuronal cells3,17. This is achieved by the presence of cell membrane ER
localized in cell-membrane invaginations called caveolae18 (Figure 2c). From
this point, cell membrane ER are linked to the MAPK pathway originating a
rapid non-nuclear effect. This has been demonstrated in osteoblasts,
endothelial cells, neurons, and human breast cancer cells19. Furthermore, an
estrogen-dependent interaction of membrane-bound ERα with the p85 regulatory subunit of phosphatidylinositol 3-kinase (PI3K) induces activation of
the PI3K/Akt pathway resulting in a rapid non-genomic activation of
endothelial NO synthase20. This pathway has only been shown for ERα
(Figure 4).
Fig. 4 ER can be activated by MAPK pathways upon EGF or IGF treatment through phosphorylation of Ser118 at AF-1 site (un-bounded activated receptor). GFs increase the
levels of protein kinases (phosphorilators) and decrease levels of protein phosphatases.
Activated ER can also activate other tyrosine-kinase receptors21.
Actions on body tissues other than breast
Estrogens stimulate growth, blood flow, and water retention in sexual organs.
In the liver, estrogens increase lipoprotein receptors, resulting in a decrease in
serum concentration of low-density lipoprotein cholesterol22.
In aging skin, it increases turgor and collagen production, reducing the depth
of wrinkles3. The rate of aromatization of androgens to estrogen in the brain is
low, compared to other tissues, even so, local production of estrogens was
suggested to have neuroprotective effects: induce synaptic and dendritic
remodeling, cause glial activation, increase density of specific receptors at the
hippocampus, and establish synergistic action with neurotrophins3. ER is
present in endothelial cells and smooth-muscle cells of coronary arteries,
where estrogens cause short-term vasodilatation and reduce vascular tonicity.
The protective effect against atherosclerosis is still controversial. In addition,
estrogens increase the potential for coagulation. Estrogen deficiency
accelerates bone loss and increases susceptibility to fractures. In fact,
estrogens inhibit osteoclastic function acting as anti-reabsortive agents. In
post-menopausal women with osteoporosis, bone extracts show high levels of
interleukin-6 and interleukin-1, which indirectly stimulate osteoclast
differentiation.
Actions on breast tissue
Development of the mammary gland
There is no breast development in the absence of functional ovaries and the
premature loss of ovarian function has an important impact on reducing breast
cancer risk. Hence, ovarian steroids are involved in both normal and abnormal
processes. From puberty onward, ovaries secrete estradiol and progesterone
that will act on a network of epithelial ducts leading to the formation of
terminal end buds. It is from these ducts ending with club-like structures that
the terminal duct’s lobuloalveolar units (TDLU), or lobules, are formed
corresponding to the functional milk-producing units of the breast. Maturation
of these lobules is initiated after menarche when alveolar ducts are
transformed into several blind-ending, grape-like, secretory sacs, known as
acini, alveoli, or ductules23. In breast tissue, estrogens stimulate the growth
cylindric cells, and stimulate the growth of connective tissue3. However breast
development only achieves full maturity and function during pregnancy and
lactation. Once lactation period ends, the lobules regain the structure present
in a non-pregnant gland but retain a larger number of individual alveoli per
lobule than before24.
Pathogenesis of breast cancer
According to histopathological observations, the TDLU is the site where many
epithelial hyperplasia and carcinomas frequently arise25. Estrogens have long
been considered as the major mitogens involved in proliferation and
differentiation of normal human mammary epithelium and in the etiology and
progression of breast neoplasia26,27,28. Estrogens may affect carcinogenesis
by acting either as initiators28 (i.e. direct DNA damage by hydroxylated
estrogen metabolites) or as promoters17 (i.e. promoting the growth and
survival of initiated cells). More than 75% of breast tumors express steroid
receptors suggesting they arise from the proliferative luminal cell population29.
Consequently, the majority of breast carcinomas are invasive ductal or lobular
carcinomas. The longer women are exposed to estrogens, either through
early menarche and late menopause and/or through estrogen replacement
therapy, the higher is the risk of developing breast cancer17. Furthermore,
reduction of estrogen levels by frequent and long-term breast-feeding or by
removal of the ovaries, especially at an early age, can dramatically lower the
cancer risk30. In vivo studies, using human breast epithelium implanted into
athymic nude mice have shown that epithelial proliferation is induced by
estrogens in a dose-dependent manner, and that progesterone –either alone
or in combination with estrogen– had no effect on epithelial proliferation31.
However, data on the combined administration of estrogen and progestins in
the context of hormone replacement therapy (HRT) point to an increased risk
for breast cancer compared to estrogen-HRT alone27,32. These contradictory
results have been attributed to different epithelial responses in pre- and
post-menopausal women. The finding that the most undifferentiated structures
cause the most aggressive neoplasms has important implications given the
nulliparous women, who have the higher risk to develop breast cancer33.
Moreover, studies from Russo et al show that parous women developing
breast cancer had late full-term pregnancies or a family history of breast
cancer34. Based on findings that the breast architecture of nulliparous women
is similar to that of parous women with cancer, the authors suggest that the
degree of mammary tissue development is important in the susceptibility to
carcinogenesis. They also hypothesize that parous women developing breast
cancer may have an altered/defective response to the differentiating influence
of pregnancy hormones. Since breast cancer is an hormone-dependent
malignancy, whose association with estrogen exposure is known since
Beatson’s first report on oophorectomy results in 1896, it is of crucial
importance to understand the role of the human receptor involved, i.e. the
estrogen receptor (ER).
1.3. Estrogen Receptors
1.3.1. Discovery of ER
In 1958, during the 4th International Congress of Biochemistry in Vienna,
Jensen reported the presence of characteristic hormone-binding components
in estrogen responsive tissues, later called estrophiles or estrogen receptors.
In the 50’s, enzymes were the major focus of biochemistry and, consequently,
the scientific community supported the hypothesis that estrogen action was
due to its metabolic change. Jensen continued his research to prove that the
ER transformation was an important step in estrogen action and that the role
of the hormone was to induce conversion of the receptor to a biochemical
functional form35. More than just identifying the first hormone receptor,
Jensen’s work was the pioneer of target therapy. Indeed, by measuring the
binding of tritiated estradiol to ER, the receptor content was determined and
correlated with response to endocrine ablation36. In this study the authors
concluded that most, but not all, patients with high levels of ER responded to
endocrine ablation. This information gave rise to several important lines of
hormonal therapy. After the discovery of a second ER by Kuiper37 in 1996, the
first was renamed to ERα and the second was named ERß.
1.3.2. ER protein structure
Functional domains
ER are members of the large super family of nuclear receptors, sharing
similarities on the functional domains38. The human ERα protein consists of
595 aa with an approximate molecular weight of 66 kDa. ERß is slightly
shorter than ERα, with 530 aa and an approximate molecular weight of 55 to 60 kDa39,38. The overall structure of both receptors is quite similar although
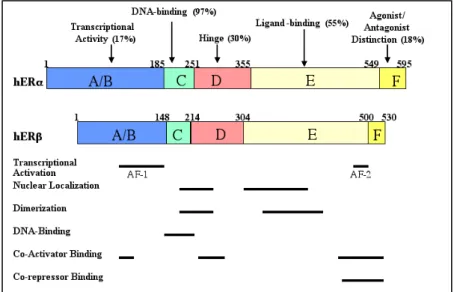
the overall degree of sequence homology is low, as seen in Figure 5.
Fig. 5 Similarity of domains between ERα and ERß39. AF-1, transcriptional ligand-independent domain; AF-2, transcriptional ligand-dependent domain.
The ER protein has 6 regions termed A to F including at least five major
functional domains40. The amino-terminal A/B domain contains a
hormone-independent transcription activation function (AF-1) that can stimulate
transcription in the absence of hormone binding. AF-1 is also thought to be
responsible for gene and cell specificity and to be important for the agonist
activity of SERMs probably through phosphorylation of specific serine
residues41. It has therefore been proposed that AF-1 domain may be involved
in hormone resistant breast cancer42. The AF-1 activity of ERß is neglectable,
a fact that supports differences in transcriptional activation since SERMs (e.g.
tamoxifen) exert solely an antagonistic effect through ERß43. The C-domain is
highly conserved among the nuclear receptors and is the site for DNA binding
(DBD). ERß is reported to have 95-97% homology with ERα in the DBD39.
This site contains nine cysteines in fixed positions that are arranged in two
zinc fingers. Hormone binding induces conformational changes that allow the
receptor to bind to ERE present in target genes. Moreover, these zinc fingers
are also involved in receptor dimerization3. The high degree of homology
between the DBD of the two ER subtypes suggests that both bind to ERE and
that they can heterodimerize44. Region D is the hinge domain, which appears
to function as a site of rotation, and may be an important binding site for
accessory proteins. A nuclear localization signal, responsible for the nuclear
localization of ER, also resides in this region. ERß has only 30% of homology
with ERα at this region. Region E is the ligand-binding domain (LBD) and the degree of homology between both ER subtypes is 55%. Structural studies of
the ER LBD suggest that the binding pocket for the ligand is nearly twice the
volume of estrogen45. It has been proposed that this feature may be related to
undiscovered endogenous ER modulators. Crystallography studies with
different ligands of the ER have revealed that the structural and
conformational changes induced by various ligands contribute to their agonist
versus antagonist effects46. A key event is the repositioning of helix 12 (H12)
of the LBD in the presence of an agonist, such as estrogen, to seal the steroid
in the hydrophobic pocket, allowing the ER complex to recruit co-activators to
the transcriptional complex on the surface of H1238,47. With antagonists like
raloxifen, H12 realignment is prevented by a bulky side-chain which protrudes
from the ligand pocket and cause H12 to rotate away from an agonist position.
Hence, H12 and its high degree of mobility in the presence of different
ligands, illustrates the major functional element of the estrogen receptor.
Furthermore, the low degree of homology between ERα and ERß within the LBD, together with their different tissue distribution, suggests that the two
receptors act selectively and adjust different responses with distinct
physiological roles48. Region E contains another trans-activation function,
named AF-2. In contrast to the AF-1 domain at the A/B region, AF-2 requires
an agonist ligand for its activity. Moreover, it is highly influenced by the
proportion of co-regulatory proteins within a given cell38. ERß lacks most of
the carboxy-terminal F domain of ERα with only 26 aa. This region seems to have specific regulatory functions affecting the agonist/antagonist balance of
certain anti-estrogens49.
ERα isoforms
From the seven known ESR1 promoters, A to T give rise to transcripts
differing at the 5’-untranslated region (5’UTR) as a consequence of alternative
splicing to a common accepter splice site at exon 150,51 (Figure 7). These
mRNAs are translated into the 595 aa full-length ERα protein also called ERα66. A spliced variant (ERα46) originates from promoters E and F and uses an alternative splicing acceptor site at exon 2, but not at exon 152,50,53.
As a consequence, this amino-terminal truncated product of ERα66 lacks the A/B domain and is expressed in plasma membrane, cytosol, and nucleus of
resting, estrogen deprived cells52. In bone, a tissue ERα46 specific variant is
up-regulated by estradiol in the absence of an ERE consensus at promoter
F54. The splicing of DNA sequences from promoter E generates a mRNA
unique 5’UTR that may potentially allow for liver-specific regulation55. The
ERα46 truncated protein has been located at discrete compartments of the plasma membrane, known as caveolae from where a cross talk to alternative
ER pathways is initiated56 as shown in Figure 2c.
ERß isoforms
The wild-type ERß1 encodes the full-length 530 aa receptor protein, as a
result of complete ESR2 exon 8 transcription57. The ERß2, also called ERßcx
(for C-terminal exchange), differs from the former at the alternative exon 8,
encoding for a C-terminal truncated ERß protein with 495 aa44. Recently, the
ERß5 isoform was identified giving rise to a truncated ERß5 protein with 472
aa in length whose upstream sequence was only recently reported. According
to Ramsey et al57 transcriptional differences between ERß isoforms and ERα
depend on the ERE sequence, which confirms that the DNA sequence bound
by ER is an allosteric effector of ERs action. Consequently, the cellular
expression of ERß isoforms may differently impact ERE-regulated target gene
expression in a ligand-dependent manner.
Fig. 6 ERß protein isoforms: the 8th variable exon is translated into different carboxy-ends of
ERß proteins, the full-length ß1, and amino-truncated ß2/bcx, ß3, ß4 and ß5 proteins58.
Indeed, ESR2_ß1 is the only fully functional receptor in the ERß family
because it displays high estradiol binding affinity, homodimer formation,
SRC-1 co-activator interaction, and ligand dependent transactivation59.
ESR2_ß2 and ESRß5 isoforms have no intrinsic transactivation activity
because they cannot form homodimers due to the weak or absent LBD, and
they are unable to recruit co-regulators, as a result of lack of helix 12 of the
ESR2_ß5 isoform or shrinkage of the co-regulator binding cleft of
ESR2_ß259,60. As a consequence, ESR2_ß1 is the “obligatory partner” of a
functional dimeric complex, while ESR2_ß2 and ESR2_ß5 are variable dimer
partners and serve as enhancers.
Relative binding affinities for ER
Due to the low degree of homology between the receptors at the LBD, some
ligands bind to the two ER with different affinities3. While the binding affinity
hand, ERß appears to have higher affinity for phytoestrogens. The latter are
naturally occurring non-steroidal plant compounds having structural and
functional similarities to estrogens. Their main characteristic is to possess a
phenolic ring as an indispensable feature for ER binding. Isoflavonoids such
as genistein and daidzein have been the most studied group. Genistein
inhibits steroidogenic enzymes as well as tyrosine kinase enzymes. The
SERM raloxifen binds with higher affinity to ERα, whereas pollutants like alkylphenols have a higher affinity for ERß. According to Jordan et al61, the
relative affinities for ERs in descending order are: 4-hydroxy-tamoxifen,
17ß-estradiol, tamoxifen, N-desmethyl-tamoxifen17.
1.3.3. ER genes: ESR1 and ESR2
ERs belong to the nuclear receptor superfamily of transcription factors.
Estrogen effects are mediated by two ERs, the ERα (NR3A1) and the ERß (NR3A2)37. The two receptor subtypes, often addressed as isoforms, are
indeed not isoforms of each other, but represent distinct proteins (ERα and ERß), encoded by different genes (ESR1 and ESR2, respectively) which map
to distinct chromosomal loci (6q25.13 and 14q22-2462, respectively).
ESR1 gene
The human ERα cDNA was cloned in 198663. ERα is encoded by the
estrogen receptor 1 (ESR1) gene that consists of 8 exons spanning 140Kb of
chromosome 6 (Figure 7). It contains 7 known promoters designated as A to
F, and T related to a transcript identified in testis. Transcripts differ at the
5’-untranslated region (5’UTR) as a result of alternative splicing to a common
acceptor splice site at exon1, giving rise to several mRNA transcripts64.
Transcripts from promoters E and F are spliced to exon 2, giving rise to an
amino-terminal truncated ERα protein lacking exon 1 (see ERα isoforms). Most of the ESR1 promoters have no TATA-CCAAT-box, or GC box
sequences, which leads to multiple transcription start sites. According with
transient transfection experiments, ESR1 promoters are rather weak when
compared to other promoters, for example, promoters A, F and T are 100 to
dehydrogenase promoter64. Consequently, the low transcriptional activity of
the ESR1 promoters ensures that low levels of ERα protein are expressed in the cell.
Fig. 7 ESR1 gene annotation of the seven promoters (A to T) and eight exons (CDS). Gaps between exons corresponds to intronic areas. ATG corresponds to the initiation of translation
(+234) and the yellow triangle represents the common acceptor splice site (+163). Adapted
from reference 64.
On the other hand, the presence of multiple promoters rather than a single
tightly regulated one has been addressed from three different main
perspectives: i) Different tissues make use of different promoters, ii) Different
promoters are used in different stages of development, iii) Different transcripts
from distinct promoters result from alternative splicing events that originate
different protein isoforms. In the case of ESR1 there is evidence about the
specific tissue expression of the different transcripts or mRNA isoforms.
Although there is an agreement on the multiple promoter usage by the ESR1
gene, there is uncertainty on the contribution of each promoter to ERα
transcription and translation. In the normal mammary gland promoter A usage
is dominant, whereas ERα over-expression in tumors has been attributed to promoter C formerly designated promoter B65.
ESR2 gene
ERß protein is encoded by the ESR2 gene, discovered in 199637 and cloned
the year after62. Compared to ESR1 with translated exons spanning more
than 140 kb, ESR2 is smaller spanning approximately 30-40 kb. Two major
transcription start sites were identified, located 43 Kb apart, with the 5’
transcription start site being approximately 400 bp upstream from the ATG
translation initiation site66 (Figure 8). Transcripts differing at the 5’UTR were
transcribed from these two different promoters, named promoter 0K and 0N67.
Fig. 8 ESR2 gene: promoters 0K and 0N drive two transcription start sites giving rise to mRNA differing at the 5’UTR. Exons are interrupted by intronic regions. Exon 8 is variable in
length according to the ERß isoform. Adapted from reference 67.
The proximal promoter (0N) contains both TATA box and Inr element. ESR2
encloses 8 exons that are translated in different protein isoforms, differing at
the C-terminus as a result of variations at the last 8th exon. The distinct
sequences at exon 8 are therefore specific for the respective isoform. Li et
al66 have also identified a negative regulatory region element located at -425
bp. This region is a ubiquitous transcription silencer that represses
transcription in the absence of steroids. In addition, an Alu sequence at the
distal 5’-end of the distal promoter (0K) seems to contain an ER-dependent
enhancer element with an imperfect ERE-related palindrome66. It has been
suggested that estrogens make use of this enhancer element to regulate ERß
expression. According with Leygue et al68 who studied mRNA expression of
the three main ERß isoforms, ERß2 and ERß5 expression levels are superior
to ERß1 in some breast tumors, while the latter being the main isoform in
normal breast tissue. On the other hand, ERß2 protein expression increased
from normal to breast cancer, showing high levels of expression in some
tumors irrespectively of the ERα status67. Furthermore, total ERß expression
was lower in cancer than in normal breast tissue. This fact has supported the
hypothesis that ERß might act as a TSG69.
1.3.4. Expression of ER subtypes
Tissue distribution
Although there is some overlap on the tissue distribution of ERα and ERß, the tissue specific expression differs. ERα is the dominant receptor present in endometrium, breast cancer cells, and ovarian stroma. The ERß has a
broader distribution showing expression in non-classic target tissues such as
kidney, thymus, intestinal mucosa, lung parenchyma, spleen, blood
leukocytes, bone marrow, bone, brain, endothelial cells, uterus and prostate
gland3,62. In the ovary, ERß is localized to the stroma of the cortex and in
blood vessels of the medulla. Moreover, granulosa cells and developing
spermatids contain mainly ERß.
Expression in mammary cells
In normal mammary epithelial cells, the level of ERα fluctuates in function of the cyclical changes of estrogens during the menstrual cycle. ERα is expressed in luminal epithelial cells but not in myoepithelial or stromal cells of
the human breast70,71. Around 50-60% of the pre-menopausal breast
epithelium expresses ERα rising to approximately 80% in post-menopausal women72. In contrast, ERß is detected at high levels (85%) in the normal
breast, in both luminal and myoepithelial compartments73. In addition, ERß is
expressed in both fibroblast-like and endothelial cells, where ERα is not. In parallel, the Ki-67 labeling index reveals that the proliferation fraction of breast
epithelial cells usually does not express ERα or PgR. Hence, rarely the ERα -positive cells are Ki-67 -positive71,74. This suggests that secretion of growth
factors by the steroid receptor-containing cells stimulates the division of
adjacent division-competent cells in a paracrine way74. Differently, in breast
cancer, ERα-positive cells are also proliferating which supports the presence of an autocrine regulation in which the cells respond to self-secreted growth
factors75 .
1.3.5. Methods for ER assessment
Information about the ER-status has been a useful tool to identify the group of
anti-estrogens i.e. to be a predictive factor. In addition, tumors expressing ER
are considered to be estrogen responsive, and have a biological less
aggressive behavior, that is, ER is a prognostic factor. The first standard
method for ER detection was the ligand-binding assay (LBA) from which the
prototype dextran-coated charcoal (DCC) radioactive method was the most
commonly used. The suspension of charcoal in dextran solution is added to a
mixture of tumor extract with radioactive and non-radioactive estrogen to
create two-phases: bound and not bound. When receptors are present, the
radioactivity detected within the bound fraction diminishes continuously with
increase mass of non-radioactive estradiol76. Receptor activity was reported in
70% of human breast cancers tested and in 21% of benign breast tissues.
The drawbacks of this reproducible quantitative assay for ER determination
are the need of large amounts of tissue (heterogeneous mixture of tumor and
normal tissue), the false-negative results originating from exogenous or
endogenous (pregnancy) sources of hormones, and the usage of radioactive
material77. The development of antibodies against specific ER epitopes made
it possible to explore new methods such as immunohistochemical assays
(IHC). The latter is based on the localization of antigenic epitopes or proteins
in tissue sections by the use of labeled antibodies as specific reagents
through antigen-antibody interactions that are visualized by a marker such as
fluorescent dye, enzyme, or colloidal gold. Given the advantages of avoiding
the manipulation of radioactivity and of using less tissue, independently of
being fresh or formalin fixed paraffin-embedded tissue, this methodology soon
became practice78,79. Even more, the requirements of small tissue samples
were fulfilled by fine needle aspirates and core biopsies, allowing to monitor
ER-status during therapy. Equally important is the possibility to detect the
receptor independent of its functional occupancy and to relate the receptor
content to morphology. In summary, the simplicity and low cost of IHC using
monoclonal AB emerged as an appealing assay for routine diagnostic
procedures. In line with this evidence several studies were initiated in order to
compare both techniques, DCC and IHC assays78,41,77. Overall, the degree of
status in breast cancer. To ensure consistency of results in clinical practice the
European Working Group for Breast Screening carried an inter-laboratory
study within the European Union80. Results showed that in the evaluation of
ERα-negative tumors as well as in that of strong ERα-positive ones, there was an excellent concordance among laboratories; however, the same did not
happen in tumors with moderate to low levels of ERα80. Corroborating these
results, an older study involving 26 countries and 200 laboratories reported
that only 37% of laboratories scored adequately ERα-low expressing tumors81.
In fact, the IHC analysis includes different steps prone to lack standardization
e.g. tissue fixation (type, temperature, duration), efficiency of antigen retrieval,
detection system, specificity of the primary AB, and scoring system82.
Nevertheless, for clinical use, and in the absence of a more reproducible
assay, IHC predicts better than LBA the response to anti-estrogens in the
adjuvant setting.
1.4. Molecular regulation
1.4.1. Epigenetic regulation
Epigenetics is related to a stable alteration in gene expression without
interference in gene sequence83. These alterations occur during development
and cell proliferation. One of the most studied epigenetic modifications is
hypermethylation, which represses transcription of the promoter regions of
tumor suppresser genes. This so-called aberrant gene silencing in cancer
through gene promoter methylation has been associated to initiation and
progression of neoplasia84. In contrast to normal cells, cancer cells exhibit a
shifted methylation pattern rarely showing methyl-covalent modifications at
cytosine-phospho guanine (CpG) sites outside the promoter regions, but a
gain of methylation within DNA stretches of CpG clustered sites known as
“CpG islands” at the promoter regions85. The reasons why DNA
methytransferases fail to methylate at the expected sites and have increased
sensitivity to do it at the promoters are not fully understood. However, de novo
methylation occurs early in tumorigenesis84,83 and is associated with ERα
expression loss during malignant disease progression55,86. Methylation is
known as a reversible physiological gene silencing mechanism catalyzed by
DNA methyltransferases (DNMT) which –in humans and most mammals- add
methyl groups (CH3) to the fifth carbon of the cytosine ring at CpG sites
creating methyl-cytosines (5mC)85. The mechanism leading to the ultimate
transcription repression emerges from the combined influence of DNMT and
recruited histone deacetylases (HDAC), which interact physically to form
transcriptionally inactive chromatin structure. This mechanism was previously
reported for ESR1 silencing in endometrial87 and breast cancer88.
1.4.2. Regulation by transcription factors
ER expression has been attributed to transcriptional regulation by
transcription factors such as ER factor 1 (ERF-1) and ER-B factor 1 (ERBF-1),
which transactivate promoter A and promoter C (previously called B),
respectively. Importantly, upon demethylating treatment no transcription was
seen from either one of the promoters in the absence of the mentioned
transcription factors55. In fact, ERα-negative cell lines like MDA-MB-231 do
not express any of the transcription factors, and consequently the
demethylation treatment was not sufficient to induce transcription. Hence,
re-expression of ERα may be prevented in a context of absence of these transcription factors88.
1.4.3. ER regulation by estradiol
Estradiol-induced ERα turnover mediated by the ubiquitin ligase 26S proteasome systems has been reported as part of the estrogen signaling
pathway55. Proteasome-dependent down-regulation of ERα was observed in
vascular endothelial cells in response to estradiol and was followed by the
transcriptional activation of ESR1 and the repletion of ERα protein levels at 6 hours89. These results indicate that acute degradation of ERα followed by an
estradiol-dependent transcriptional activation of ESR1 is a general estradiol
response. Moreover, as stated by Pinzone et al55, most studies showed that