STUDY REGARDING THE USE OF MICROSOFT EXCEL SOFTWARE IN THE MARKETING ACTIVITY OF THE BIHOR COUNTY COMPANIES
ŢarcăNaiana, MareşValerica, MareşMarius Daniel
1Faculty of Economics, University of Oradea, Oradea, Romania
2Faculty of Accounting and Management Information Systems, Economic Studies
Academy of Bucharest, Bucharest, Romania
3Faculty of Management, Finance and Accounting, Spiru Haret University, Bucharest, Romania
[email protected] [email protected]
Abstract: Marketing activity involves many decision situations. They may have a lower or higher complexity, but all involve organizing, processing, extracting and analyzing of a large volume of information. By using specialized software that provides tools for analysis, company managers can quickly obtain significant information about market. They can also get overview, synthesis of certain aspects of company activities. In the data analysis activity traditional methods and software tools can be used, such as: dispersion analysis software, multi-factor techniques, regression analysis software and data-series analysis software, useful in data-series analysis in their trend format, seasonality and of the other dynamic series components. But if a more complex economic analysis is demanded, where the information is needed to be presented in the form of diagrams, is necessary to use specialized software tools for analysis, such as those offered by spreadsheet applications. Of those who know and use spreadsheet applications for drawing up the reports necessary for carrying out the work, many use the Microsoft Excel. Using Microsoft Excel software, data can be organized and processed quickly, accurately and thoroughly. Also, the facilities for the extraction, aggregation and analysis bring real value to a business activity. From the same volume of processed data a higher volume of complex and diversified information can be obtained, thus offering a more complete picture on the analized decisional situation in its entire. For this reason we conducted a study in which we sought to obtain information on how these applications are used in the marketing activities of companies. Microsoft Excel software is used a lot in marketing activities of companies in Bihor County, but data analysis tools it provides are used too little. Collected and stored data are not used to their full value. In this way, companies do not have information that could help to better understand customer behavior and market products.
Keywords:data analysis; spreadsheet software; economic analysis activity
1. Introduction
Marketing activity involves many decision situations. They may have a lower or higher complexity, but all involve organizing, processing, extracting and analyzing of a large volume of information (Popa and Sasu, 2008). By using specialized software that provides tools for analysis, company managers can quickly obtain significant information about market, costs, prices, sells, market promotion and emergence on specific geographic areas, consumer categories. Also, one can get overviews, image synthesis of certain aspects of dynamic activities such as monthly or quarterly growth in sales of a certain product groups in a given geographical area, profit made in a given period of time (week, month, quarter) by selling a product type.
Low-end tools of data analysis provide opportunities for simple queries, being useful for people who need a quick-reference to the databases information. Powerful tools for data analysis, such as multidimensional analysis, allows performing complex analysis (Han and Kamber, 2006), capitalization of the information found in databases for effective decision making, both at the strategic and technical levels (Soares, Peng, Meng, Washio and Zhou, 2008). They provide the possibility of data consolidation, of complex spreadsheets use, which allows grouping of rows and columns expressing different dimensions and different levels of aggregation, and of the aggregation level change, needed to determine the optimum level of granularity for analysis. They can be successfully used in marketing for: the analysis of products, sales, company's customers and suppliers, market segmentation, risk analysis, forecasting customer preferences, attracting new customers, and so on.
For different reasons some companies are opting for a summary analysis of data, while others for a complex analysis of the data. For this aim traditional analysis software tools or specialized analysis software tools are used.
Many companies use spreadsheet applications for inventory, data processing and analysis, useful for marketing activities. Microsoft Excel software is used by many of those who know and use spreadsheet applications for drawing up the reports necessary for carrying out the work.
2. Tools offered by Microsoft Excel software
Using Microsoft Excel, data can be organized and processed quickly, accurately and thoroughly. Also, the facilities for the extraction, aggregation and analysis bring real value to a business activity (Nagy and Vizental, 2009). From the same volume of processed data a higher volume of complex and diversified information can be obtained, thus offering a more complete picture on the analized decisional situation in its entire.
Facilities offered by the Microsoft Excel software are used differently by different companies.
For example, in some companies Microsoft Excel software is used only for recording data as spreadsheets by using simple formulas and common functions. Mainly, a person compares current month data with data on the previous month and decides what to do in the month which follows. These companies are devoid of vital information that might help them better understand, for example, customer behaviour or market behaviour.
companies can make complex economic analyses that provide benefits for the case of rapidly changing market environment.
Managing data in the form of spreadsheets makes them be easily found. Worksheets for a customer or supplier may be suggestively named and stored in a single spreadsheet, thus information being easily located. Complex mathematical, statistical and financial calculations can be made, data lists can be efficiently processed, suggestive reports that contain different levels of detail and also charts can be created, analysis and forecasts leading to the best decisions can be made (Johnson, 2008).
Microsoft Excel software provides efficient solutions to many situations for a business activity. Using the tools it offers, following activities can be made:
Summary tables without levels of detail, based on data stored in different spreadsheets. They can be used, for example, to obtain a quarterly summary on monthly expenses(Taylor, 1999).
Filtering, which allows to quickly find and highlight information that meet certain criteria. They can be applied for example, to the costs lists in order to obtain the desired information quickly.
Sorting, which allows organizing data in a logical manner. They can be used, for example, to present costs lists in a suggestive manner.
Subtotals of a data list. They allow the creation of a summary containing details that can be shown or hidden as needed. May be helpful in expenses analysis.
Pivot tables that offer great flexibility in data presentation (Jacobson, R. 1997). Allow organizing data stored in multiple spreadsheets, show or hide details, change in the pattern or level of detail displayed. For example, costs can be displayed by categories and quarters.
Charts. They show visual data and the relationships between them, allowing quick understanding of their meaning. They are used to calculate a trend series data, such as monthly sales over a period of time, and to predict future sales
What-if analysis which evaluates various possibilities for the cases when one, two or more factors influences the values of the results. (Lacurezeanu and Buchmann, 2009) They can be used, for example, to analyze the way in which the number unit sales, unit price, advertising expense affect a company's profits.
Analysis of situations in which several parameters may be changed simultaneously in order to reach a specific goal. They are useful in determining the optimal mix of products, efficient organizing of human resources, in solving the problems of transport and distribution, efficient
allocation of financial resources, financial planning. (Bălan and Dumitru,
2011).
3. The premises of the research
In the performed research we started from the following hypothesis: Companies in Bihor County are using Microsoft Excel software.
Companies in Bihor County are using Microsoft Excel software in the marketing activities.
Companies in Bihor County are using data analysis tools offered by Microsoft Excel software in the marketing activities.
4. The research methodology
Companies analyzed in this research were selected from a database organized at national level, which can be accessed online at www.listafirme.ro (accessed on October, 2012). The database which we used has a search engine that allows searches of companies in terms of location and filtering the results by number of employees. This way it was possible to make a list of companies in Bihor County filtered by size, such as: up to 10 employees, between 10 and 50 employees, more than 50 employees.
We randomly selected from this database 1200 companies, 400 of each category. To collect the necessary information we used questionnaires. The first question in the questionnaire was if they use Microsoft Excel software in their activity. If the answer was affirmative, they were asked to respond to the questions which follow. A number of 936 of the total questionnaires were returned and used for analysis, resulting a response rate of 78%. Response rate for each category considered is presented in the Table1:
Table 1:Response rate for each category considered Response rate /
Company’s size
up to 10 employees 67,25 % between 10 and 50 employees 76,50% with more than 50 employees 90,25 %
The questions were grouped as follows:
Questions related to the company’s size.
The companies were structured as follows: up to 10 employees
between 10 and 50 employees with more than 50 employees
Questions related to existence of a marketing department in company's organizational structure and employees number.
Questions related to marketing activities of the company.
Questions related to department in which the employee in charge with marketing activities is hired (if the company does not have a marketing department) and position which he holds in the company.
Questions related to the graduated domain, informatics studies attended and software application known by the employee in charge with marketing activity.
Questions related to the software applications they currently use in marketing activities.
Questions related to how much Microsoft Excel software is used in organizing, processing, presenting and analyzing data.
Questions related to the tools which they use for organizing, processing and analyzing data offered by Microsoft Excel software and used in marketing activities.
Questions related to the importance given by the senior management in
improving the employees’ knowledge in using Microsoft Excel software.
5. Data analysis and interpretation
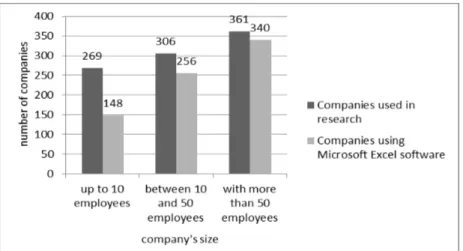
A number of 744 questionnaires have confirmed the fact that companies use Microsoft Excel software. Distribution for each category considered is presented in Table2:
Table 2:Usage of Microsoft Excel software, depending on company size Number of companies/
Company’s size N Total number ofcompanies
Companies using
Microsoft Excel software up to 10 employees
%
269 148
55,02 between 10 and 50
employees %
306 256
83,66 with more than 50
employees %
361 340
94,18
For a visual presentation of the data and better understand their significance we represented the data as a chart, in Figure 1:
Regarding the first hypothesis, Table1 shows that Microsoft Excel software is used to a lesser extent in small companies with less than 10 employees and to a greater extent in other.
Therefore, many of the small companies with less than 10 employees (44,98%), neither they give enough importance in data organizing, data processing and analysis, nor their employees know how to use Microsoft Excel.
Regarding the last two hypotheses, collected data showed that:
In 31,76% of the companies with less than 10 employees Microsoft Excel software is used mainly in data inventory using spreadsheet forms, due to lack of knowledge in how to use Microsoft Excel software. Only simple formulas are used, like sorting and usual functions (such as sum, average, count, max, min). Using the results, a person can make a decision, usually regarding to what to do in the upcoming month, based on the current data, compared to the data acquired in the previous month.
Only 39,86% of the companies with less than 10 employees and 76,56% of the companies with a number of employees between 10 and 50 use subtotal function. By using the subtotal function, detailed information such as lists of expenses, individual sales records, number of articles in each type of inventory could be used effectively in the decision making process.
Pivot tables and charts are used to a greater extent in companies with more than 50 employees (57,94%). Therefore, we noticed that still too few companies give importance in organizing, processing and presenting data in a manner which allows effective marketing decisions.
PivotTables ensure great flexibility in data presentation. They allow dynamic summaries for efficient data analysis. Stored data can be organized in multiple spreadsheets. All required details can be displayed or hidden. The way in which data is presented can be changed easily, by changing either the configuration or the level of the details displayed. A chart creates a visual representation of the data and their relations with other data, which allows easy understanding of their significance. Trend line to a data series, such as, for example, monthly sales during the year, can be calculated and used to forecast future sales. Similar data series, but represented on different numeric scales, such as, for example, sales volume (in pieces) and price (in euro/piece) can be displayed on the same chart, using a secondary axis. Thus, it is possible to relate the sales volume and selling price in a direct and significant manner.
Very few companies use data analysis tools offered by Microsoft Excel software. This is because employees have only basic knowledge in using Microsoft Excel.
Companies that use Goal Seek tool, also use Solver tool, which was expected.
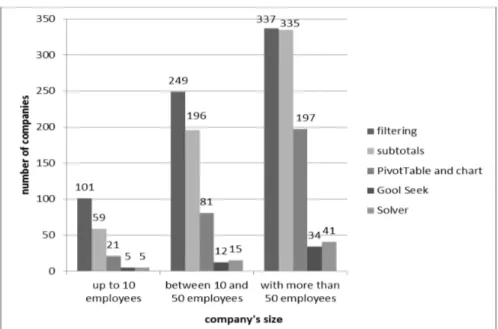
Table 3: Usage of tools offered by Microsoft Excel software in the marketing activities, depending on company size
Instruments used/
Company’s size N Filtering Subtotals
PivotTables and chart
Goal
Seek Solver
up to 10
employees % 101 68,24 59 39,86 21 14,19 5 3,38 5 3,38 between 10 and
50 employees %
249 97,26 196 76,56 81 31,64 12 4,82 15 6,02 with more than 50
employees % 337 99,12 335 98,53 197 57,94 34 10,09 41 12,17 Total % 687 92,34 590 79,30 299 40,19 51 6,85 61 8,20
For a visual presentation of the data and better understanding of their significance, the data is represented as a chart, in Figure 2:
Figure 2: Usage of data analysis tools by companies
6. Conclusions
Microsoft Excel software is used a lot in marketing activities of companies in Bihor County, but data analysis tools it provides are used too little. Collected and stored data are not used to their real extent. This way, companies do not have information that could help them to better understand customer behaviour and market products.
References:
Bălan, I. and Dumitru, A. (ed.) (2011) Excel 2010. Primii paşi în business intelligence, 3D Media Communications, Chip Kompact
Han, J. and Kamber, M. (2006) Data Mining Concepts and Techniques, Morgan Kaufmann Publishers, San Francisco, USA
Johnson, S. (2008) Microsoft Office-Excel 2007, Ed. Teora, Bucharest, Romania Jacobson, R. (1997) Microsoft Excel 97: Advanced, Pap/Dskt edition, Microsoft Press
Lacurezeanu, R. and Buchmann, R. (2009) Bazele informaticii economice, Ed. Risoprint, Cluj Napoca
Nagy, M. and Vizental, M. (2009) Asistarea deciziei folosind mediul Excel, Ed.
Albastră
Popa, A.and Sasu, D. (2008) “Marketing databases – the shortest way to client’ s
heart”,The Annals of the University of Oradea, Economic Science, Tom XVII, Vol.4, Oradea, Romania, pp.1490-1494
Soares, C., Peng, Y., Meng, J., Washio, T. and Zhou, Z.H. (2008) “Applications of
Data Mining in E-Business and Finance: Introduction”, Frontiers in Artificial Intelligence and Applications: Applications of Data Mining in E-Business and Finance,IOS Press, pp. 1-11