www.the-cryosphere.net/3/205/2009/
© Author(s) 2009. This work is distributed under the Creative Commons Attribution 3.0 License.
The Cryosphere
Quantifying changes and trends in glacier area and volume in the
Austrian ¨
Otztal Alps (1969-1997-2006)
J. Abermann1,2, A. Lambrecht2, A. Fischer2, and M. Kuhn1,2
1Austrian Academy of Sciences, Commission for Geophysical Research, Vienna, Austria 2Institute of Meteorology and Geophysics, University of Innsbruck, Innsbruck, Austria
Received: 9 June 2009 – Published in The Cryosphere Discuss.: 1 July 2009
Revised: 24 September 2009 – Accepted: 28 September 2009 – Published: 20 October 2009
Abstract. In this study we apply a simple and reliable method to derive recent changes in glacier area and volume by taking advantage of high resolution LIDAR (light detec-tion and ranging) DEMs (digital elevadetec-tion models) from the year 2006. Together with two existing glacier inventories (1969 and 1997) the new dataset enables us to quantify area and volume changes over the past 37 years at three dates. This has been done for 81 glaciers (116 km2) in the ¨Otztal Alps which accounts for almost one third of Austria’s glacier extent. Glacier area and volume have reduced drastically with significant differences within the individual size classes. Between 1997 and 2006 an overall area loss of 10.5 km2or 8.2% occurred. Volume has reduced by 1.0 km3which
ac-counts for a mean thickness change of−8.2 m. The availabil-ity of three comparable inventories allows a comprehensive size and altitude dependent analysis of glacier changes but lacks a high temporal resolution. For the comparison of rates of changes between the two different periods (1969 to 1997 with 1997 to 2006) we propose two approaches in this study: a) to estimate mean overall rates of changes (including a pe-riod of advance) and b) to extract pepe-riods of net-retreat by using additional information (length change and mass bal-ance measurements). Analysis of the resulting acceleration factors reveals that the retreat of volume and mean thickness changes has accelerated significantly more than that of area changes.
1 Introduction
For the past decades a general glacier mass and area loss has been observed all over the world with few exceptions (e.g. Lemke et al., 2007; Oerlemans, 2005; Dyurgerov and
Correspondence to:J. Abermann ([email protected])
Meier, 2000; Haeberli, 1999) and especially in the Alps (Lambrecht and Kuhn, 2007; Citterio et al., 2007; K¨a¨ab et al., 2002). In order to document the glacier extent, various national glacier inventories have been produced using dif-ferent remote sensing techniques, such as photogrammetry (e.g. Kuhn et al., 2009; Lambrecht and Kuhn, 2007; Schnei-der et al., 2007), satellite data (e.g. Paul et al., 2002a; An-dreassen et al., 2008) or LIDAR (e.g. Knoll and Kerschner, 2009). In Austria, two complete glacier inventories exist on the basis of analogue (1969) and digital (1998) airborne pho-togrammetry, respectively. The first one (1969) was com-piled by Patzelt (1980) and Groß (1987) and later digitised during the compilation of the second Austrian inventory (data acquisition: 1996 to 2002). The data acquisition year of the second inventory for the ¨Otztal Alps was 1997 (Kuhn et al., 2009; Lambrecht and Kuhn, 2007). Paul (2002b) inves-tigated glacier changes of sub-regions of Tyrolean glaciers with Landsat data. Detailed maps of selected glaciers in the study area were produced between 1969 and 1997 (e.g. Hin-tereisferner: Kuhn, 1979, or Vernagtferner: Heipke et al., 1994; Endres, 2001).
The strong area and volume loss of the last decade raised interest in an updated glacier inventory. Based on LIDAR-DEMs this was developed for the glaciologically well inves-tigated southern part of the Austrian ¨Otztal Alps and is pre-sented in this study. Besides forming an important source for the determination of glacier extent as its main purpose, pe-riodically updated glacier boundaries are a necessary input for accurate mass balance studies (e.g. Elsberg et al., 2001; Fischer et al., 2009) and modelling of the future glacier ex-tent. A sequence of glacier inventories allows for the quan-tification of the accelerated glacier change in the context of a changing climate.
Fig. 1. Study area ¨Otztal Alps (grey: glacier extent 1997 of the glaciers in the ¨Otztal Alps that have not been updated in our study, red: updated glacier extent 2006, dashed: glaciers with length measurement records in the study area, black rectangle: extent of Fig. 6). HEF, KWF and VF refer to three glaciers with mass balance records (Hintereisferner, Kesselwandferner and Vernagtferner). The valley station Vent, where the climate data from Fig. 2 derives from, is indicated by a black circle.
dependent trend considerations. Secondly, we derive overall acceleration trends of glacier changes by comparing mean annual area and volume changes between the two periods investigated (1969–1997 and 1997–2006). To estimate the acceleration of retreat we propose the use of additional in-formation to extract periods of net-retreat (length change and mass balance measurements).
2 Study area
The ¨Otztal Alps are located in a central-alpine dry region at around 47◦N and 11◦E (Fliri, 1975). Their Austrian part is
situated on the northern slope of the main alpine divide. Fig-ure 1 shows the study area with the glacier extent of all Aus-trian ¨Otztal glaciers in 1997 (grey) and all updated glaciers in 2006 (red). In total, 81 glaciers of all size and aspect classes were remeasured, chosen simply by the extent of the DEM used and covering all well studied glaciers in this area. This new inventory accounts for 84% of the glacier area in this mountain range (1997: 151 km2) and represents approx. 27% of the whole Austrian glacier area (1998: 470 km2).
Figure 2 shows the climatic conditions of the study area at the example of the valley station Vent at 1900 m a.s.l. (data from the Institute of Meteorology and Geophysics, Univer-sity of Innsbruck). In the period 1997–2006, annual precip-itation showed an interannual variation between ca. 500 mm
1970 1980 1990 2000
200 400 600 800 1000 1200
year
precipitation [mm]
annual precipitation
temperature
[°
C]
−10 −5 0 5 10 15
TDJF Tyear T
JJA
Fig. 2.Annual precipitation sums (blue bars) and winter – (Decem-ber, January, February; grey), annual mean – (green) and summer air temperature evolution (June, July, August; red) for the period 1969–2006.
and 1000 mm with a mean of 660 mm and a standard varia-tion of 119 mm. A sequence of positive precipitavaria-tion anoma-lies occurred in the mid-1970s followed by relatively aver-age 1980s and 1990s. Around 2000 there were some strongly positive precipitation anomalies followed by drier years since 2003.
Winter temperatures (DJF) show a larger inter-annual vari-ability (standard deviation: 1.3◦C) than mean annual
(stan-dard deviation: 0.6◦C) and summer temperatures (JJA, (stan-dard deviation: 0.9◦C) but no significant trend. A tempera-ture increase was observed in the summer temperatempera-tures: the extraordinarily hot summer of 2003 marked the maximum of the period studied. The annual average temperature during the 37 years is 1.7◦C.
3 Data
3.1 Glacier inventory data
Two existing inventories were used for the determination of area and volume changes of the past four decades. The first one was established using aerial photographs from the year 1969 (Patzelt, 1980; Groß, 1987) and was digitized later on (Lambrecht and Kuhn, 2007). In the years 1996–2002 a new inventory was produced by means of digital photogram-metry. The results for all Austrian glaciers were then tem-porally homogenized for the year 1998 (Kuhn et al., 2009; Lambrecht and Kuhn, 2007). The DEMs of the ¨Otztal Alps for the second inventory have been acquired on the basis of orthophotos (acquisition date: 11 September 1997), therefore we refer to this date further on. The vertical accuracy of these DEMs in general is better than±1.9 m, according to
to W¨urlander and Eder (1998). Only in extreme cases can errors exceed this value (Abermann et al., 2007).
Several studies show that LIDAR or ALS (airborne laser scanning) is a powerful tool to generate DEMs from glacier covered as well as glacier-free areas (e.g. Kennett and Eiken, 1997; Baltsavias et al., 2001; Geist et al., 2005; Geist and St¨otter, 2007; Kodde et al., 2007). The DEMs of 2006 were acquired by high resolution airborne LIDAR undertaken by the Regional Government of Tyrol between 23 August 2006 and 9 September 2006 with vertical errors of±0.1 m. The acquisition dates make them closely comparable with the data of 11 September 1997 both being around the date of minimum snow extent. Details about the technical specifica-tions of the DEMs used including general remarks on glacier boundary delineation from DEMs are summarized in Aber-mann et al. (2009).
3.2 Glacier length change measurements
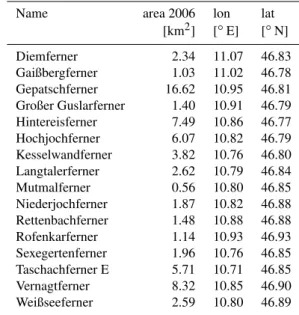
Variations of glacier lengths are determined annually by the length change measurement service of the Austrian Alpine club for a large number of glaciers with the results pub-lished annually in the club’s magazine (until 2003/2004: e.g. Patzelt, 2005; from 2004/2005: e.g. Patzelt, 2006). Within the study area length change measurements have been performed annually on 16 glaciers since 1969. Glacier names, size and location of these glaciers are summarized in Table 1.
3.3 Mass balance measurements
To estimate annual averages of volume and mean thickness changes between the inventories we used the temporal course of the available mass balance series. On three glaciers within the study area direct mass balance measurements are per-formed annually. They are perper-formed by the Institute of Meteorology and Geophysics, University of Innsbruck, on Hintereis- and Kesselwandferner (Fischer and Markl, 2009; Kuhn et al., 1999). On Vernagtferner the Commission for Glaciology, Bavarian Academy of Sciences and Humanities, performed the measurements (Glaciology, 20091).
4 Methods
4.1 Area and volume changes
Abermann et al. (2009) proposed a method to delineate glacier boundaries by using hillshades of high-resolution DEMs as a primary data source and including information of multi-temporal DEMs as well as orthophotos to increase accuracies in ambiguous areas. Applying this method, we updated the glacier boundaries of 2006 on the basis of the inventory from 1997.
1Available at: http://www.glaciology.de/.
Table 1.Name, area and coordinates of the glaciers for which an-nual length change measurements are available for the whole inves-tigation period (1969–2006).
Name area 2006 lon lat
[km2] [◦E] [◦N]
Diemferner 2.34 11.07 46.83
Gaißbergferner 1.03 11.02 46.78
Gepatschferner 16.62 10.95 46.81
Großer Guslarferner 1.40 10.91 46.79
Hintereisferner 7.49 10.86 46.77
Hochjochferner 6.07 10.82 46.79
Kesselwandferner 3.82 10.76 46.80
Langtalerferner 2.62 10.79 46.84
Mutmalferner 0.56 10.80 46.85
Niederjochferner 1.87 10.82 46.88 Rettenbachferner 1.48 10.88 46.88
Rofenkarferner 1.14 10.93 46.93
Sexegertenferner 1.96 10.76 46.85 Taschachferner E 5.71 10.71 46.85
Vernagtferner 8.32 10.85 46.90
Weißseeferner 2.59 10.80 46.89
We kept ice divides constant during the delineation since they have not significantly changed over the past 40 years compared to the strong changes in the ablation area and thus played a somewhat negligible role in our considerations. Fur-thermore, we address overall changes in ice cover rather than changes of individual glaciers, therefore a shift of an ice di-vide does not change the results. We also remained consis-tent with the former inventories by including dead ice bodies and debris-covered areas to the glacier area. If it was not pos-sible to decide whether adjoining snow and firn areas cover ice or rocks, we included them to the glacier area as proposed in UNESCO (1970) and Paul et al. (2009). The resulting glacier masks were identified according to the nomenclature of 1969 which is based on a systematic numbering within drainage areas. Thus, glaciers have not been relabelled, even if they have disintegrated since the last inventory.
For the calculation of volume changes we first resampled all DEMs to the same cell size (5×5 m). This is done to avoid
errors introduced by interpolation. Then we subtracted one DEM from the other and multiplied the elevation difference per cell with the cell size (5×5 m) to obtain volume changes.
The calculation of the mean thickness change has been performed by dividing the total volume change by a mean area for the respective period, which gives
1 z1969−1997=
1V1969−1997
0.5·(A1969+A1997)
(1) for the period 1969–1997, or
1 z1997−2006=
1V1997−2006
0.5·(A1997+A2006)
Abermann et al. (2009) estimated the standard error of the applied method to be±1.5% of the total area for glaciers larger than 1 km2 and up to ±5% for smaller glaciers. Ground truthing of selected glaciers reveals absolute hori-zontal deviations of less than 4 m for 80% of the sample (Abermann et al., 2009).
4.2 Estimating acceleration trends
It is challenging to compare different periods with differing glacier changes. Whereas the first period contains a signifi-cant glacier advance, followed by a strong retreat, the second mainly consists of strong negative area and volume changes. We propose two ways of drawing a comparison between the two periods: in Sect. 4.2.1. we derive overall acceleration factors on the basis of the whole investigation periods, in Sect. 4.2.2. we undertake a temporal reduction to obtain ac-celeration factors of periods of net-retreat only.
4.2.1 Overall acceleration factors: area, volume and mean thickness changes
As a first step we introduce overall rates of changes where we divide the overall area/volume loss by the over-all time period between the inventories for both periods (e.g.1t69−97=28 years,1t97−06=9 years). Out of these rates
of changes we are able to derive the following acceleration factors:
FA overall=
1A97−06
1t97−06 overall
1A69−97
1t69−97 overall
, (3)
FA% overall=
1A%97−06
1t97−06 overall
1A%69−97
1t69−97 overall
, (4)
FV overall=
1V97−06
1t97−06 overall
1V69−97
1t69−97 overall
, (5)
Fzoverall=
1z97−06
1t97−06 overall
1z69−97
1t69−97 overall
. (6)
4.2.2 Temporally reduced acceleration factors: Area changes
Area and volume reduction of the first period has occurred only during a part of the overall time period due to the signif-icant glacier advance around 1980 (Patzelt, 1985). Therefore we decided to perform a temporal reduction on the basis of length change measurements for acceleration factors related to area changes (FAretr,FA% retr) and of mass balance
mea-surements for acceleration factors related to volume changes
1970 1980 1990 2000 −800
−600 −400 −200 0 200
year
cumulative length change since 1969 [m]
cumulative length changes mean
1 2
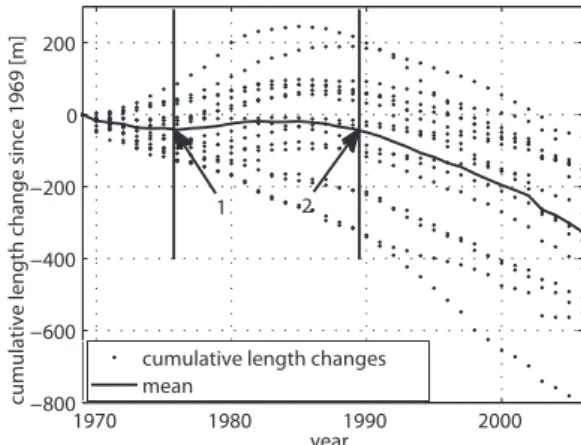
Fig. 3. Cumulative length change for all glaciers that cover the entire period (crosses) and the arithmetic mean over these curves (solid). Arrow 1 indicates the derived onset of the advance period (1976), arrow 2 the state where the same cumulative length as in 1 has been reached again (1989).
(FV retr,Fzretr). In contrast to the above factors (Eqs. 3 to 6)
that we interpret as describing altered glacier evolution, the temporally reduced factors are intended to reveal information on accelerated glacier retreat, as described below.
All length change measurements within the study area which cover the whole investigation period (16 glaciers, for details see Table 1) are plotted in Fig. 3. The solid line shows their arithmetic mean. Individual glaciers respond very dif-ferently to climatic condition change: some, which have re-sponded with a decreased rate of negative length change, have shown continuous retreat since 1969; others, which have advanced significantly, had not reached their initial state before 2003. Kuhn et al. (1985), using two glaciers within the study area as examples, examined the different glacier behaviour that results from different glacier characteristics (e.g. area-elevation distribution, vertical balance profile or aspect). As the sign of length change correlates well with the sign of area change, we used the temporal course of the arith-metic mean to define the mean onset of the general glacier advance (1976, indicator 1 in Fig. 3). Furthermore, we de-fined the year in which the same length as recorded at the beginning of the advance was reached again (1989, indica-tor 2). The observed length change between 1969 and 1997 thus occurred within 15 years in two phases (1969–1976 and 1989–1997). To estimate the mean annual area loss in the period between the first two inventories (1A/1t69−97 retr)
we therefore divided the absolute area changes by 15 which is the number of years with net length (and probably area) reduction.
For the period 1997–2006 a continuous length reduc-tion occurred. Therefore we derived estimates for mean annual area change by dividing the overall changes by 9 (1A/1t97−06 retr).
to the same absolute length/area. For this reason we assess relative area changes by subtracting the average annual area change value (1A/1t69−97 retr and1A/1t97−06 retr) from
the initial glacier area for each time-step (year). In this way we can calculate a mean annual percental area change, refer-ring to a shrunken absolute value for each year. This has been performed with all individual size classes during both investi-gated periods again considering the same periods of net-area loss and results in1A%/1t97−06 retrand1A%/1t69−97 retr.
Out of these rates of net-retreat we were now able to calculate FA retr and FA% retr, analogously to Eqs. (3)
and (4) but with a reduced 1t for the period 1969–1997 (1t97−06 retr=15 years).
Volume and mean thickness changes
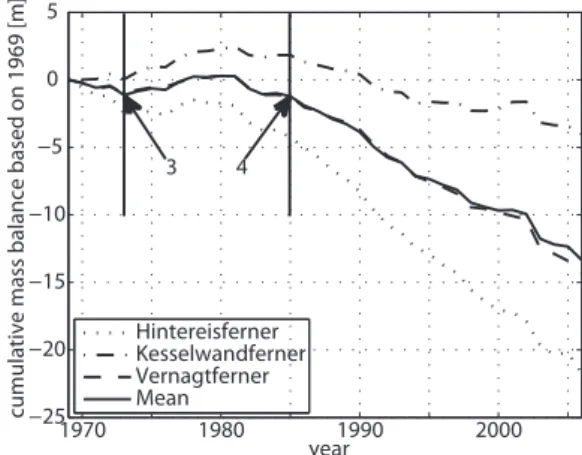
Figure 4 shows the temporal evolution of the cumulative mean specific mass balance of three glaciers within the study area and their arithmetic mean. To estimate average annual volume and mean thickness change values we extracted the year of the onset of mean mass gain (1973, indicator 3 in Fig. 4). The gain in mass during the positive mass balance years had been lost by 1985, after several years of negative mass balances (indicator 4), which leads to a 1t97−06 retr
of 16 years (16 out of 28 years contributed to the observed volume loss). For the second period (1997–2006), one year (2001) showed a positive sum of specific mass balance which leads to a1t97−06 retrof 8 years and analogously to Eq. (5)
we calculated FV retr. Since the mean thickness change is
directly connected with the volume loss (Eq. 1), we used the same lengths of intervals to derive mean annual values of 1z/1t69−97 retr and 1z/1t97−06 retr, and consequently Fz retr.
5 Results
Glacier area, all other glacier inventory attributes, abso-lute and relative area changes, as well as absoabso-lute volume and mean thickness changes were determined and calcu-lated for each individual glacier within the study area for the year 2006 (81 glaciers, 116 km2). Three out of originally 84 glaciers (1997) in the study area shrank in size from the smallest class in 1997 (between 0.01 km2 and 0.1 km2) be-low the minimum size of 0.01 km2in 2006 to be accounted for as a glacier (UNESCO, 1970; Paul et al., 2009).
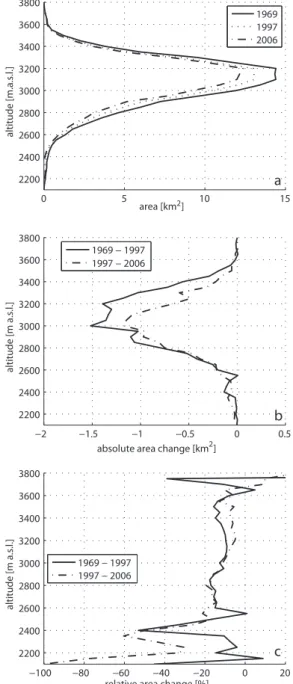
Figure 5a shows the area-altitude distribution of all up-dated glaciers for 1969, 1997 and 2006. Areas with the largest ice cover are between 3100 and 3200 m a.s.l. The minimum altitude of ice cover rose from 2060 m a.s.l. to 2120 m a.s.l. between 1969 and 2006. It is worth noting that the elevation of maximum ice-cover for the study area, as shown in Fig. 5a, is about 200 m higher (approx. 3200 m) than of all Austrian glaciers (Lambrecht and Kuhn, 2007, Fig. 3). This is due to the central-alpine dry climate of the
1970 1980 1990 2000 −25
−20 −15 −10 −5 0 5
cumulative mass balance based on 1969 [m
]
year Hintereisferner Kesselwandferner Vernagtferner Mean
3 4
Fig. 4.Cumulative mean specific mass balance of the glaciers Hin-tereisferner, Kesselwandferner and Vernagtferner and their mean refering to 1969. It is pure coincidence that the cumulative balance values of the mean and of Vernagtferner follow almost exactly the same temporal course. Arrow 3 indicates the year when an overall mass gain starts (1973) and by the year 1985 (arrow 4), the same volume was reached again.
¨
Otztal Alps as well as the relatively large areas that are avail-able for potential glaciation in these high altitudes.
The absolute area changes (Fig. 5b) show that for both pe-riods the strongest area loss occurred at about 3000 m a.s.l. There are, however, some significant differences consider-ing the distribution over the entire altitude range. Up to ap-proximately 2900 m a.s.l. both periods show similar values of absolute area changes, while in higher elevations the area re-duction is about one third weaker for the period 1997–2006 than for 1969–1997. This means that for lower elevations the absolute area change within the last decade is similar to that of the 28 years before.
Figure 5c shows the vertical distribution of relative area changes that occurred in the respective period. The solid line (1969–1997) refers to the absolute value of 1969, the dashed line to the absolute value of 1997. Thus, the same rel-ative change (%-value) reflects a larger absolute change for the second period because the reference value is smaller al-ready. The lowest elevation band has disappeared (−100%),
and up to an elevation of about 3000 m relative changes in the second period are more negative than in the first period with a reversing sign above. Above 3650 m positive relative area changes occur, although this fact should not be over-interpreted since it represents only a very small area (about 1 ha at elevations higher than 3650 m).
0 5 10 15 2200
2400 2600 2800 3000 3200 3400 3600 3800
altitude [m.a.s.l.]
area [km2]
1969 1997 2006
a
−2 −1.5 −1 −0.5 0 0.5 2200
2400 2600 2800 3000 3200 3400 3600 3800
absolute area change [km2]
altitude [m a.s.l.]
1969 − 1997 1997 − 2006
b
−100 −80 −60 −40 −20 0 20 2200
2400 2600 2800 3000 3200 3400 3600 3800
relative area change [%]
altitude [m a.s.l.]
1969 − 1997 1997 − 2006
c
Fig. 5. Area-altitude distribution in 50 m-intervals of all updated glaciers for 1969, 1997 and 2006(a)and absolute area changes of the 50 m-intervals for the periods 1969–1997 and 1997–2006(b). Figure 5c shows the vertical distribution of relative area changes referring to 1969 (solid) and to 1997 (dashed).
(e.g. Knoll and Kerschner, 2009; Paul et al., 2004). Elevation changes between 1997 and 2006 are plotted in Fig. 6b. An interesting detail is the slightly positive thickness change on Wasserfallferner, indicating the contrast of a glacier with a “healthy” accumulation zone (WFF) to a valley glacier with a relatively thick glacier tongue (RMF). Such a behaviour is also supported by other studies (e.g. Paul and Haeberli, 2008; Pelto, 2006). One possible reason could be that the posi-tive precipitation anomalies of the early 2000s (Fig. 2) have
caused this slight gain in surface elevation of this relatively high situated glacier.
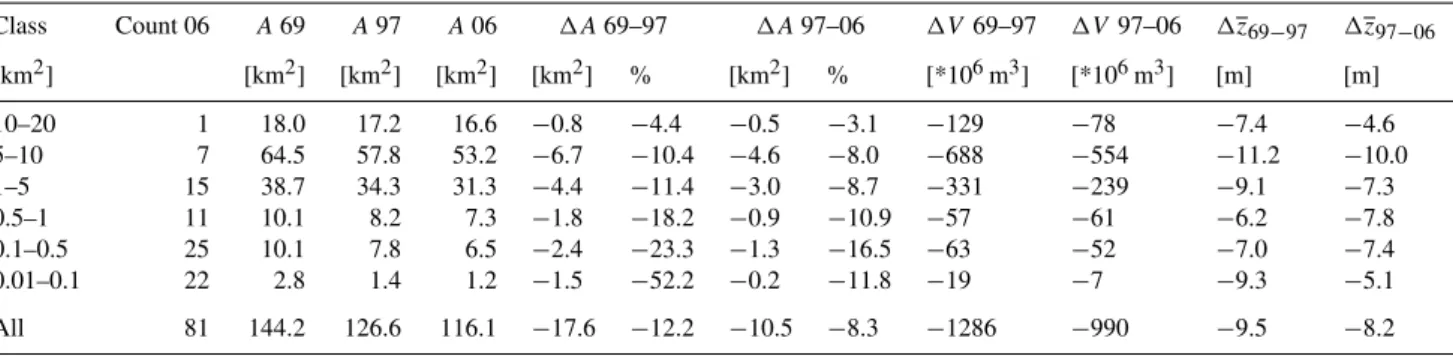
The quantitative results for area, volume and mean thick-ness changes are summarized in Table 2. For this purpose the glaciers are divided into size classes based on their area in 2006. An overall absolute area change of−17.6 km2
be-tween 1969 and 1997 and −10.5 km2 for 1997–2006 has
been derived. This corresponds to a relative area change of −12.2% for 1969–1997 (referring to 1969) and −8.3%
for 1997–2006 (referring to 1997). The respective values for the volume changes for these periods are−1.3 km3and −1.0 km3 and −9.5 m and −8.2 m for the mean thickness
changes. In general our results are similar but slightly more negative than the values that are derived by Knoll and Ker-schner (2009) for the South Tyrolean glaciers (mean thick-ness change 1997–2006:−7.0 m). In the period 1969–1997 the relative area loss decreases with increasing glacier size as plotted in Fig. 7. The largest values are observed for the smallest class (<0.1 km2, −52.2%). The second
pe-riod shows the strongest relative area losses for glaciers that are between 0.1 and 0.5 km2 in area (−16.5%). Very small
glaciers (<0.1 km2) still lost a considerable fraction of their area in the second period (−11.8%) but the rates of changes
have decelerated compared to the first period, where 52.2% of the overall area were lost. Changes in this size class in neighbouring South Tyrol are slightly less negative (−7.7%
between 1997 and 2006 according to Knoll and Kerschner, 2009).
The two methods of comparing the rates of glacier changes of the two periods are quantitatively summarized in Tables 3 and 4. A direct comparison of the acceleration factors as de-rived by two different methods is plotted in Fig. 8a and b. The bars represent the respective factors and their distribu-tion throughout the size-classes. These factors allow for in-vestigation of glacier area and volume evolution within size classes and permit trends in absolute area change with rela-tive, volume and mean thickness changes to be contrasted. An acceleration factor larger than 1 means that mean an-nual changes have increased, comparing the second period with the first period. Considering the overall periods (includ-ing the period of advance), acceleration factors vary between 0.34 (FA overallfor the smallest class) and 3.94 (Fzoverallfor
glaciers between 0.5 km2 and 1 km2). Acceleration factors for the overall periods and the sum of all size classes lie be-tween 1.86 for absolute area (FAoverall) and 2.67 (Fzoverall)
for mean thickness changes.
For a quantitative interpretation of the individual acceler-ation factors we focus on the ones derived for periods of net-retreat in the following. The general distribution over the size classes however, is very similar for both applied meth-ods, with the major difference being their differing absolute values (cf. Fig. 8a and b).
FA retrshows that the mean absolute annual area changes
Fig. 6.Rotmoosferner (RMF), Wasserfallferner (WFF) and their surrounding glaciers: Hillshade and glacier boundary 1969, 1997 and 2006
(a); glacier boundaries as well as thickness change 1997–2006(b).
Table 2.Summary of glacier covered area of each size class (1969, 1997 and 2006), absolute and relative area changes, volume and mean thickness changes for the periods (1969–1997 and 1997–2006).
Class Count 06 A69 A97 A06 1A69–97 1A97–06 1V 69–97 1V 97–06 1z69−97 1z97−06
[km2] [km2] [km2] [km2] [km2] % [km2] % [*106m3] [*106m3] [m] [m]
10–20 1 18.0 17.2 16.6 −0.8 −4.4 −0.5 −3.1 −129 −78 −7.4 −4.6
5–10 7 64.5 57.8 53.2 −6.7 −10.4 −4.6 −8.0 −688 −554 −11.2 −10.0
1–5 15 38.7 34.3 31.3 −4.4 −11.4 −3.0 −8.7 −331 −239 −9.1 −7.3
0.5–1 11 10.1 8.2 7.3 −1.8 −18.2 −0.9 −10.9 −57 −61 −6.2 −7.8
0.1–0.5 25 10.1 7.8 6.5 −2.4 −23.3 −1.3 −16.5 −63 −52 −7.0 −7.4
0.01–0.1 22 2.8 1.4 1.2 −1.5 −52.2 −0.2 −11.8 −19 −7 −9.3 −5.1
All 81 144.2 126.6 116.1 −17.6 −12.2 −10.5 −8.3 −1286 −990 −9.5 −8.2
0.01−0.1 0.1−0.5 0.5−1 1−5 5−10 10−20 −60
−50 −40 −30 −20 −10 0
size class [km2]
relative area change in area class [%]
1969 − 1997 1997 − 2006
Fig. 7.Relative area changes for the period 1969–1997 (blue) and 1997–2006 (orange) for the individual size classes.
(>5 km2) an acceleration of 13 to 15% (FA retr=1.13 to 1.15)
occurred. This means that for large glaciers the absolute area loss is slightly stronger in the time period 1997 to 2006 than for the 15 years with net area reduction (within a to-tal of 28 years) before. The very small glaciers have decel-erated significantly in terms of mean absolute annual area changes (FA retr=0.18). We point out that a direct
compar-ison of absolute values of area changes is doubtful. Their relative impact on overall glacier changes depends on the ab-solute glacier extent they refer to, which may have changed between the two periods.
Therefore we propose the use of relative area changes (FA% retr) in order to enable a comparison between time
pe-riods and also between size classes. In contrast to absolute area changes (FAretr=1.00) that did not accelerate, the mean
annual relative area change increased by about 10% between the two periods (FA% retr=1.11) due to the reduced
remain-ing area. The lowest values ofFA% retrare observed for the
smallest glaciers (FA% retr=0.29). The strongest increase in
relative annual glacier area loss (FA% retr=1.27) occurs for
Table 3.Mean rates of changes referring to the overall periods and referring to reduced periods of net-retreat for absolute and relative area changes. Note, that the rates of changes are displayed in ha/a whereas absolute areas (Table 2) are given in km2.
Class 1A/1t 1A/1t FAoverall 1A/1t 1A/1t FA ret r 1A%/1t 1A%/1t FA% overall 1A%/1t 1A%/1t FA%ret r
6997 overall 9706 overall 6997 retr 9706 retr 6997 overall 9706 overall 6997 retr 9706 retr
[km2] [ha/a] [ha/a] [ha/a] [ha/a] [%/a] [%/a] [%/a] [%/a]
10–20 −2.8 −6.0 2.10 −5.3 −6.0 1.13 0.16 0.35 2.26 −0.30 −0.35 1.17 5–10 −23.9 −51.6 2.15 −44.7 −51.6 1.15 0.38 0.93 2.45 −0.73 −0.93 1.27 1–5 −15.8 −33.3 2.11 −29.4 −33.3 1.13 0.42 1.01 2.43 −0.80 −1.01 1.26 0.5–1 −6.6 −10.0 1.53 −12.2 −10.0 0.82 0.69 1.28 1.85 −1.33 −1.28 0.96 0.1–0.5 −8.4 −14.2 1.68 −15.7 −14.2 0.90 0.91 1.98 2.17 −1.76 −1.98 1.13 0.01–0.1 −5.3 −1.8 0.34 −9.8 −1.8 0.18 2.51 1.39 0.55 −4.79 −1.39 0.29 All −62.8 −116.8 1.86 −117.2 −116.8 1.00 0.45 0.96 2.14 −0.86 −0.96 1.11
Table 4.Mean rates of changes referring to the overall periods and referring to reduced periods of net-retreat for absolute volume and mean thickness changes.
Class 1V /1t 1V /1t FVoverall 1V /1t 1V /1t FV ret r 1z/1t 1z/1t Fzoverall 1z/1t 1z/1t Fz ret r
69–97 overall 97–06 overall 69–97 retr 97–06 retr 69–97 overall 97–06 overall 69–97 retr 97–06 retr
[km2] [*106m3/a] [*106m3/a] [*106m3/a] [*106m3/a] [m/a] [m/a] [m/a] [m/a]
10–20 −5 −9 1.87 −8 −10 1.20 −0.3 −0.5 1.95 −0.5 −0.6 1.25
5–10 −25 −62 2.51 −43 −69 1.61 −0.4 −1.1 2.76 −0.8 −1.3 1.78
1–5 −12 −27 2.24 −21 −30 1.44 −0.3 −0.8 2.50 −0.6 −0.9 1.60
0.5–1 −2 −7 3.35 −4 −8 2.16 −0.2 −0.9 3.94 −0.4 −1.0 2.53
0.1–0.5 −2 −6 2.61 −4 −7 1.68 −0.2 −0.8 3.27 −0.5 −0.9 2.10
0.01–0.1 −1 −1 1.04 −1 −1 0.67 −0.3 −0.6 1.70 −0.6 −0.6 1.09
All −46 −109 2.38 −80 −124 1.54 −0.3 −0.9 2.67 −0.6 −1.0 1.72
0.01−0.1 0.1−0.5 0.5−1 1−5 5−10 10−20 0
0.5 1 1.5 2 2.5 3 3.5 4
size class [km²]
acceleration factor
FA overall FA% overall FV overall Fz overall
a
0.01−0.1 0.1−0.5 0.5−1 1−5 5−10 10−20 0
0.5 1 1.5 2 2.5 3 3.5 4
size class [km²]
acceleration factor
FA FA% FV Fz
b
Fig. 8. Acceleration factors referring to mean annual area (absolute and relative) as well as volume and mean thickness changes. In(a), no temporal reduction has been performed, the overall area change has been divided by the time between the inventories. In(b)periods of net-retreat are extracted as explained in Sect. 4.2.
The mean annual ice volume losses have increased by more than 50% (FV retr=1.54), while the mean annual
thick-ness reductions by more than 70% (Fz retr=1.72). Analysing
the different size classes reveals that the strongest changes occurred for glaciers between 0.5 and 1 km2, where the mean annual volume change as well as the mean annual thick-ness change more than doubled (FV retr=2.16,Fzretr=2.53)
compared to the period of net-retreating within 1969–1997. Again, glaciers of the smallest size class show a decrease in mean annual volume changes compared to the earlier period (FV retr=0.67). This is in line with trends in area changes that
have been highlighted earlier.
6 Discussion and conclusion
A reliable and sufficiently accurate method has been ap-plied to derive recent glacier area and volume changes in the
¨
(e.g. air temperature, albedo) and in the fraction of solid pre-cipitation of the overall prepre-cipitation that have a stronger ef-fect on glacier changes at low elevations since these regions are generally closer to melting conditions. Furthermore, ice motion slowed down significantly during recent years, which subsequently reduces dynamic ice supply to glacier tongues (e.g. Abermann et al., 2007).
Additional information such as annual length change and mass balance measurements has been used to derive esti-mates for acceleration factors of net area and volume loss. They have been compared with factors that would result if no temporal reduction is performed. Both methods follow a similar trend over the size classes with much higher values when considering the whole period (including the advance). The relative distribution over all size classes is not signif-icantly affected by the temporal reduction but the absolute values of the factors. Their absolute value though has a dif-ferent meaning: we interpret the overall acceleration factors as describing altered glacier behaviour in general, whereas the temporally reduced factors are intended to reveal infor-mation on an accelerated glacier retreat.
The limited number of glaciers for which additional infor-mation (length change and mass balance measurements) ex-ists and thus the unequal distribution over the size classes of continuously measured glaciers allows only generalised esti-mates for the individual periods, but no year-by-year analy-sis of glacier retreat. Therefore no annual area and volume changes for a selected year can be calculated for the entire inventory: rather longer-term trends (e.g. decadal means of annual changes) were compared.
Length and area changes are linked but do not necessarily follow exactly the same pattern. It depends on the topogra-phy of the individual glacier how length and area respond to a climatic change but the sign of this evolution is likely to be the same. Since we only extract the temporal evolution of the length change and relate them qualitatively to the ob-served area change we feel confident enough to do so.
The fact that for the smallest class (<0.1 km2) retreat has decelerated in terms of area change suggests that these glaciers are now in a state closer to equilibrium than in the previous period. Differences in area change between the two periods are very large in this class (Table 1, Figs. 7 and 8) therefore we draw this conclusion even though interpretation uncertainties are larger for small glaciers.
Comparison of acceleration factors reveals that those con-nected with volume changes (FV retr, Fzretr) are
signifi-cantly larger than those connected with area changes (FA retr, FA% retr). This means that mean annual volume and mean
thickness changes have increased more than mean annual area changes across all size classes compared to the respec-tive values for the period 1969–1997. Taking an extensive data set of ice thickness measurements in the study area into consideration we found that the larger valley glaciers still have a considerable ice thickness at low elevations (a typi-cal value for glaciers within the study area between 1 and
5 km2 is 60 m at the tongue around 2700 m a.s.l., and up to 150 m for larger glaciers; Span et al., 2005; Fischer et al., 2007). This geometric arrangement results in the fact that mean annual volume or mean thickness changes (thick glacier tongues melt down) increase strongly while mean an-nual area changes do not increase significantly. This particu-larly affects the size class of glaciers between 0.5 and 1 km2 where the mean relative annual area change did not change (FA% retr=0.96) but the mean annual volume change as well
as the mean annual thickness change more than doubled (FV retr=2.16, Fz retr=2.53). Also the two smallest classes
show larger differences between the factors connected with area and the ones connected with volume changes. It can be anticipated that this trend may reverse as soon as the tongues become thin enough to melt away and lose large areas within a few years without losing a lot of volume. This point in time is individual for each glacier and should be evaluated further together with ice volume data and an energy balance model. A future application of this dataset could be to compare geodetically derived cumulative mass balances with glacio-logically measured ones and assess the possible causes for these differences. Furthermore, this dataset is planned to be extended for other glacier-covered areas in the eastern Alps and will thus allow to extract regional differences of glacier reaction to a changing climate.
Acknowledgements. This study was funded by the Commission
for Geophysical Research, Austrian Academy of Science. The LIDAR DEM 2006 was acquired by the Regional Government of Tyrol. The authors would like to thank the Commisssion for Glaciology at the Bavarian Academy of Sciences and Humanities for providing the mass balance data of Vernagtferner, C. Knoll for his comments and L. Raso and E. Dryland for proof-reading the paper as well as M. Attwenger for providing information on the DEM. L. Braun, I. Evans, M. Pelto and one anonymous referee are gratefully acknowledged for constructive remarks and useful suggestions, which improved the manuscript considerably.
Edited by: G. H. Gudmundsson
References
Abermann, J., Lambrecht, A., and Schneider, H.: Analysis of sur-face elevation changes on Kesselwand glacier – Comparison of different methods, Zeitschrift f¨ur Gletscherkunde und Glazialge-ologie, 41, 147–168, 2007.
Abermann, J., Fischer, A., Lambrecht, A., and Geist, T.: Glacier mapping with airborne LIDAR and multi-temporal DEMs, The Cryosphere, submitted, 2009.
Andreassen, L. M., Paul, F., K¨a¨ab, A., and Hausberg, J. E.: Landsat-derived glacier inventory for Jotunheimen, Norway, and deduced glacier changes since the 1930s, The Cryosphere, 2, 131–145, 2008,
http://www.the-cryosphere-discuss.net/2/131/2008/.
Digital Photogrammetry for Glacier Monitoring, Photogramm. Rec., 17(98), 243–273, 2001.
Citterio, M., Diolaiuti, G., Smiraglia, C., D’Agata, C., Carnielli, T., Stella G., and Siletto, G. B.: The fluctuations of Italian glaciers during the last century: a contribution to knowledge about Alpine glacier changes, Geogr. Ann. A, 89(3), 167–184, 2007. Dyurgerov, M. B. and Meier, M. F.: Twenthieth century climate
change: Evidence from small glaciers, P. Natl. Acad. Sci. USA, 97(4), 1406–1411, 2000.
Eder, K., W¨url¨ander, R., and Rentsch, H.: Digital photogramme-try for the new glacier inventory of Austria, IAPRS International Archives of Photogrammetry and Remote Sensing, 33, 1–15, 2000.
Elsberg, D. H., Harrison, W. J., Echelmeyer, K. A., and Krimmel, R. M.: Quantifying the effect of climate and surface change on glacier mass balance, J. Glaciol., 47(159), 649–658, 2001. Endres, J.: Farborthophotokarte “Vernagtferner 1999” aus
Amateur-Luftbildern, Master thesis, Technical University of Mu-nich, MuMu-nich, 2001.
Fischer, A., Span, N., Kuhn, M., Butschek, M.: Radarmessun-gen der Eisdicke ¨osterreichischer Gletscher. Band II: MessunRadarmessun-gen 1999 bis 2006, Zentralanstalt f¨ur Meteorologie und Geodynamik, Wien, ¨Osterreichische Beitr¨age zu Meteorologie und Geophysik, 39, 142 pp., 2007.
Fischer, A. and Markl G.: Mass balance measurements on Hin-tereisferner, Kesselwandferner and Jamtalferner 2003 to 2006: database and results, Zeitschrift f¨ur Gletscherkunde und Glazial-geologie, 42(1), 47–83, 2009.
Fischer, A.: Glaciers and climate change: Interpretation of 50 years of direct mass balance of Hintereisferner, Austria, Global Planet. Change, submitted, 2009.
Fliri, F.: Das Klima im Raume von Tirol, Universit¨atsverlag Wag-ner, Innsbruck-M¨unchen, 1975.
Geist, T., Elvehoy, H., Jackson, M., and St¨otter, J.: Investiga-tions on intra-annual elevation changes using multitemporal air-borne laser scanning data – case study Engabreen, Norway, Ann. Glaciol., 42, 195–201, 2005.
Geist, T. and St¨otter, J.: Documentation of glacier surface elevation change with multitemporal airborne laser scanner data -case study: Hintereisferner and Kesselwandferner, Tyrol, Aus-tria, Zeitschrift f¨ur Gletscherkunde und Glazialgeologie, 41, 77– 106, 2007.
Gross, G.: Der Fl¨achenverlust der Gletscher in ¨Osterreich 1850-1920-1969, Zeitschrift f¨ur Gletscherkunde und Glazialgeologie, 23(2), 131–141, 1987.
Haeberli, W., Frauenfelder, R., Hoelzle, M., and Maisch, M.: On rates and acceleration trends of global glacier mass changes, Ge-ogr. Ann. A, 81(4), 585–591, 1999.
Heipke, C., Rentsch, H., Rentsch, M., and W¨url¨ander, R.: The digital orthophoto map Vernagtferner 1990, Zeitschrift f¨ur Gletscherkunde und Glazialgeologie, 30, 109–117, 1994. K¨a¨ab, A., Paul, F., Maisch, M., and H¨aberli, W.: The new
remote-sensing-derived Swiss Glacier Inventory: II. First results, Ann. Glaciol., 34, 362–366, 2002.
Kennett, M. and Eiken, T.: Airborne measurement of glacier surface elevation by scanning laser altimeter, Ann. Glaciol., 24, 293– 296, 1997.
Knoll, C. and Kerschner, H.: A glacier inventory for South Tyrol, Italy, based on airborne laser scanner data, Ann. Glaciol., 50(53),
46–52, 2009.
Kodde, M., Pfeiffer, N., Gorte, B., Geist, T., and H¨ofle, B.: Auto-matic Glacier Surface Analysis from Airborne Laser Scanning, ISPRS Workshop Laser Scanning 2007, XXXVI, Part 3/W52, 221–226, 2007.
Kuhn, M.: Begleitworte zur Karte des Hintereisferners 1979, 1:10 000, Zeitschrift f¨ur Gletscherkunde und Glazialgeologie, 16(1), 117–124, 1979.
Kuhn, M., Markl, G., Kaser, G., Nickus, U., Obleitner, F., and Schneider, H.: Fluctuations of climate and mass balance: Different responses of two adjacent glaciers, Zeitschrift f¨ur Gletscherkunde und Glazialgeologie, 21, 409–461, 1985. Kuhn, M., Dreiseitl, E., Hofinger, S., Markl, G., Span, N., and
Kaser, G.: Measurements and models of the mass balance of Hintereisferner, Geogr. Ann. A, 81(4), 659–670, 1999.
Kuhn, M., Lambrecht, A., Abermann, J., Patzelt, G., and Gross, G.: Projektbericht 10. Die ¨osterreichischen Gletscher 1998 und 1969, Fl¨achen- und Volumen¨anderungen, Verlag der ¨osterreichischen Akademie der Wissenschaften, Wien, 128 pp., 2009.
Lambrecht, A. and Kuhn, M.: Glacier changes in the Austrian Alps during the last three decades, derived from the new Austrian glacier inventory, Ann. Glaciol., 46, 177–184, 2007.
Lemke, P., Ren, J., Alley, R. J., et al.: Observations: Changes in Snow, Ice and Frozen Ground, in: Climate Change 2007: The Physical Science Basis. Contribution of Working Group I to the Fourth Assessment Report of the Intergovernmental Panel on Climate Change, edited by: Solomon, S., Qin, D., Manning, M. et al., Cambridge University Press, Cambridge, United Kingdom and New York, NY, USA, 2007.
Oerlemans, J.: Extracting a climate signal from 169 glacier records, Science, 308, 675–677, 2005.
Patzelt, G.: The Austrian glacier inventory: status and first results, Riederalp Workshop 1978 – World Glacier Inventory, IAHS, 1980.
Patzelt, G.: The period of glacier advances in the Alps, 1960 to 1985, Zeitschrift f¨ur Gletscherkunde und Glazialgeologie, 21, 403–407, 1985.
Patzelt, G.: Gletscherbericht 2003/2004. Sammelbericht ¨uber die Gletschermessungen des Oesterreichischen Alpenvereins im Jahre 2004, Mitteilungen des Oesterreichischen Alpenvereins, 60(130), 24–31, 2005.
Patzelt, G.: Gletscherbericht 2004/2005. Sammelbericht ¨uber die Gletschermessungen des ¨Osterreichischen Alpenvereins im Jahre 2005, Bergauf, 2, 6–11, 2006.
Paul, F., K¨a¨ab, A., Maisch, M., Kellenberger, T. W., and H¨aberli, W.: The new remote-sensing-derived Swiss Glacier Inventory: I. methods, Ann. Glaciol., 34, 355–361, 2002a.
Paul, F.: Changes in glacier area in Tyrol, Austria, between 1969 and 1992 derived from Landsat 5 Thematic Mapper and Aus-trian Glacier inventory data, Int. J. Remote Sens., 23(4), 787– 799, 2002b.
Paul, F., K¨a¨ab, A., Maisch, M., Kellenberger, T., and H¨aberli, W.: Rapid disintegration of Alpine glaciers ob-served with satellite data, Geophys. Res. Lett., 31, L21402, doi:10.1029/2004GL020816, 2004.
doi:10.1029/2008GL034718, 2008.
Paul, F., Barry, R., Cogley, G., Frey, H., Haeberli, W., Ohmura, A., Ommanney, S., Raup, B., Rivera, A., and Zemp, M.: Rec-ommendations for the compilation of glacier inventory data from digital sources, Ann. Glaciol., submitted, 2009.
Pelto, M. S.: The current disequilibrium of North Cascade Glaciers, Hydrol. Process., 20, 769–779, 2006.
Schneider, C., Schnirch, M., Acu˜na, C., Casassa, G., and Kilian, R.: Glacier inventory of the Gran Campo Nevado Ice Cap in the Southern Andes and glacier changes observed during recent decades, Global Planet. Change, 59(1–4), 87–100, 2007.
Span, N., Fischer, A., Kuhn, M., Massimo, M., and Butschek, M.: Radarmessungen der Eisdicke ¨osterreichischer Gletscher; Band I: Messungen 1995 bis 1998, Zentralanstalt f¨ur Meteorologie und Geodynamik, Wien, ¨Osterreichische Beitr¨age zu Meteorologie und Geophysik, 33, 145 pp., 2005.
UNESCO: Perennial ice and snow masses: a guide for compilation and assemblage of data for a world inventory, UNESCO/IASH, Technical Paper Hydrology 1, 1970.