Abstract - World is on the verge of the energy crisis as the conventional fossil fuels will last only for few years. Biodiesel is one of the best options to tackle this situation. Biodiesel can be produced abundantly in developing countries with the use of non-edible feed-stocks available. Biodiesel produced from local feedstock can give energy security to countries like India whose current energy demand is mostly satisfied by crude oil import.
Mahua is non-edible seed abundantly available in India with 34 to 52% oil content. The biodiesel produced from Mahua can satisfy required property demand from biodiesel. The present methods to produce biodiesel mainly focus on the transesterification process with the homogeneous catalyst. Methanol is used as the lower alcohol and Potassium hydroxide (KOH) or Sodium hydroxide (NaOH) is used as catalysts. This process has certain disadvantages like production cost is high, process involves number of washing and purification steps, separation of glycerol is difficult, hence it cannot be applied in industry to produce high quality biodiesel.
Taguchi method is used to design the experiment for optimization of operating parameters of engine. The operating parameters optimized are: compression ratio, injection pressure, nozzle geometry, fuel fraction and additive amount. Mahua biodiesel with AA-93 is used as fuel with diesel for optimization. Optimum operating parameters are: 18 compression ratio, 330 bar injection pressure, 3-hole nozzle, 30% fuel fraction and 6 ml/ltr additive. The optimized condition has given better performance with lower emission.
Index Terms: Taguchi method, Mahua Biodiesel, optimization, compression ratio, injection pressure, injection nozzle geometry, blends, additives.
I. INTRODUCTION
Biodiesel production is a very modern and technological area for researchers as an alternative fuel for diesel engines because of the increase in the petroleum prices, its renewability and the environmental advantages (Marchetti, Miguel, and Errazu 2007). Biodiesel can be produced from renewable sources such as vegetable oil, animal fat and used cooking oil (Balat and Balat 2010). The use of non-edible Manuscript received: March 2016
Dr. Madhukar S. Tandale is with the Mechanical Engineering Department, Dr. Babasaheb Ambedkar Technological University, Lonere, Raigad, Maharashtra, INDIA (e-mail: [email protected])
Ganesh V. Garjepatil was a Post Graduate student with the Mechanical Engineering Department, Dr. Babasaheb Ambedkar Technological University, Lonere, Raigad, Maharashtra, India (e-mail: [email protected])
Sangram D. Jadhav is a Research Scholar with the Mechanical Engineering Department, Dr. Babasaheb Ambedkar Technological University, Lonere, Raigad, Maharashtra, India (e-mail: [email protected])
plant oils when compared with edible oils is very significant because of the tremendous demand for edible oils as food, and they are far too expensive to be used as fuel at present (Ashraful et al. 2014). Nearly 1.60 million diesel engines are operating in India and finding wide applications in agricultural, transport and commercial sectors (Balat and Balat 2010). India is the fourth largest net importer of crude oil and petroleum products after the United States, China and Japan ("UN States statistical" 2013). The gap between India’s oil demand and supply is widening, as demand reached nearly 3.9 million barrels per day (bbl/d) in 2013. U.S. Energy Information Administration projects India’s demand will more than double to 8.2 million bbl/d by 2040 (BP Statistica 2008, "UN States statistical" 2013). The consumption of liquid petroleum products, especially diesel fuel, has grown up significantly due to growth of major economic sectors viz., transport, agriculture and industry. The excessive dependency on import of fossil fuel becomes apprehension and need to find the alternatives (Mythili et al. 2014). To reduce the uncertainties associated with the petro-diesel, Government of India, like other nations of the world, have made plan to promote alternative sustainable fuels (“BP Statistical Review of World Energy June 2014). Energy strategy of a country aims at efficiency and security and to provide access which being environment friendly and achievement of an optimum mix of primary resources for energy generation (National biofuel policy 2004). According to Greenpeace report release on March 24, 2009 in New Delhi, renewable energy can successfully meet over 35% of power demand in India by 2030, and half of forecasted energy needs can be met just by efficient and judicious production, distribution and use of energy (“BP Statistical Review of World Energy June 2014). Green energy evolution will not only help in saving money and, but also facilitate to deal with the catastrophe of climate change (Iglesias et al. 2012). Biofuels are eco-friendly fuels and their utilisation would address global concerns about contamination of carbon emissions (Boro, Deka, and Thakur 2012). India has a ray of hope in providing energy security through development of biofuel. Indian approach towards the biofuels, in particular is somewhat different to the current international approaches which could lead to conflict with food security (Kumar and Msangi, 2002). It depends solely on non-food feedstock to be raised on degraded/ marginal or waste land that is not suited to agriculture, thus avoiding a possible conflict of security (Silitonga et al. 2013).
The country's energy demand is expected to grow at an annual rate of 6.8 per cent over the next couple of decades. Most of the energy requirements are currently satisfied by
Optimization of Performance & Emission
Characteristics of Compressed Ignition Engine
Operated on Mahua Biodiesel Using Taguchi
and Multiple Regression Analysis
fossil fuels – coal, petroleum based products and natural gas (planning and Commission, Government of india 2008). Domestic production of crude oil can only fulfill 25-30 per cent of national consumption rest we are importing from other countries (Refi and Trade 2013). In these circumstances biofuels are going to play an important role in meeting India’s growing energy needs. Biofuels offer an attractive alternative to fossil fuels, but a consistent scientific framework is needed to ensure policies that maximize positive & minimize the negative aspects of biofuels (Santori et al. 2012).
Indian crude oil import has jumped 9.5% to 347432 Crore in 1st five months of current fiscal (Aug 2013) on account of sharp (Haas et al. 2006). Estimated demand for 2013-14 of petrol, diesel and LPG is 16335MT, 73500MT and 16712MT respectively. Almost 79% (78.75%) of Indian crude oil requirements have to be imported. The issue of oil import has come under focus in the context (Sharma and Singh 2009) of country spiraling current account deficit. As per the working group report this ministry for 12th five year plans the estimated demand of petroleum products during 2016-17 would be 186.2 MMT (Ahmad et al. 2011). India spends 92,000 Crore on diesel subsidy every year which is great loss to exchange with the country being a signatory of green fuel treaty by next few years around a 20% diesel usage will be replaced by biodiesel (Shay 1993). The government of India has formulated an ambitious National Biodiesel Mission to meet 20 per cent of the country’s diesel requirements by 2016-2017(planning and Commission, 2012-17).
Transesterification is the process by which the glycerides present in fats or oils react with an alcohol in the presence of a catalyst to form esters and glycerol (Helwani et al. 2009). The oil molecules (triglycerides) are broken apart and reformed into esters and glycerol, which are then separated from each other and purified (Barnwal and Sharma 2005). The esters (biodiesel) produced by these methods are analyzed to ascertain their suitability as diesel fuels. The by-product of this process is glycerol can be separated from biodiesel by separation under gravity and purified to get pure glycerin which can be used in cosmetic, pharmaceutical, soap industries resulting in final cost reduction of biodiesel production (Karaosmanog 2004). The most common optimization technique used for engine analysis is response surface method, grey relational analysis, non-linear regression, genetic algorithm and Taguchi method. Taguchi technique has been popular for parameter optimization in design of experiments (Karnwal et al. 2011). Application of Taguchi method for experimental planning has greatly reduced the experimental time and costs (Ganapathy, Murugesan, and Gakkhar 2009). Grey relational analysis and entropy measurement are used to overcome the in multiple quality analysis (Talebian-Kiakalaieh, Amin, and Mazaheri 2013). In view of the above, the aim of the present investigation was to reduce the emission without compromising the performance of compressed ignition (CI) engine. In order to get complete picture, several design & operating variables like fuel fraction, compression ratio, fuel injection pressure, nozzle geometry and fuel additive have been investigated for their combined effect on output variables like brake specific fuel consumption (BSFC), carbon monoxide (CO) & oxides of nitrogen (NOx). Five major influencing input parameters
with their four levels were selected for controlling them on
the basis of three output variables. For optimizing multi-objective characteristics, Taguchi grey relational (TGRA) technique has been used on their relative importance. This work hoped a positive way towards energy security in future which will meet the qualities of petrol based diesel produced from non-edible oils. Such alternative fuels will meet the same performance as that of petrol based diesel fuel with lowering the exhaust gas emission.
II. EXPERIMENTAL
A. Physical-chemical Characterization of Mahua Biodiesel
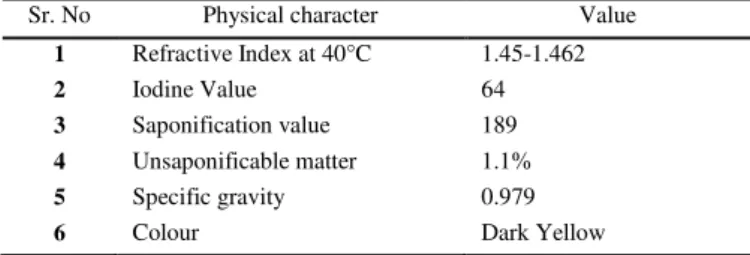
The oil was extracted from Mahuacrush using soxhelet extractor with N-hexane as the solvent. The duration for each batch of extraction was fixed at 5h; while the volume of solvent per kilogram of seed was varied from 5 liter to 7 liter for maximization of oil yield. The extracted oil was then measured to calculate the content of oil in the kernel of madhuca indica. The physio-chemical properties and fatty acid composition of Mahua oil (MIO) are shown in Table I and II.
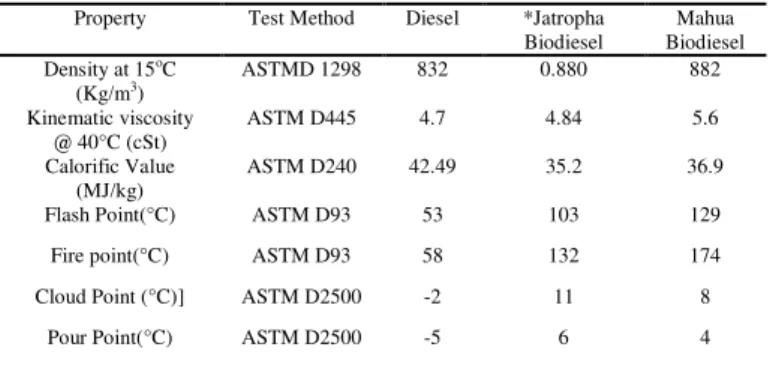
The fuel properties of the biodiesel (Mahua biodiesel) and mineral Diesel were determined using standard test procedures (are given in Table III). The calorific value is a measure of energy content of the fuel and is a very important property of biodiesel, which determines its suitability as an alternative to mineral Diesel. Calorific value of Mahua biodiesel (MB) is 36.9 MJ/kg, which is almost 86.8% of the diesel value (42.5 MJ/kg). The lower calorific value of MB is because of the presence of oxygen in the
molecular structure, which is confirmed by elemental analysis also. The flash point and fire point were tested with a closed cup Pensky Marten’s apparatus. The flash point is the measure of the tendency of a substance to form flammable mixtures when exposed to air. This parameter is considered in the handling, storage and safety of fuels. The high value of flash point and fire point in the case of MIOB represents it is a safer fuel to handle.
B. Engine Testing Method
The engine was provided with a hemispherical combustion chamber with overhead valves operated through push rods. Eddy current dynamometer has been used for measurement
TABLEI
PHYSIOCHEMICAL PROPERTIES OF MAHUAOIL
Sr. No Physical character Value
1 Refractive Index at 40°C 1.45-1.462
2 Iodine Value 64
3 Saponification value 189
4 Unsaponificable matter 1.1%
5 Specific gravity 0.979
6 Colour Dark Yellow
TABLEII
FATTY ACID VALUES AT PEAK POINTS IN THE CHROMATOGRAPH
Fatty acid Chemical Structure
Structure Content mass (%) Palmitic C16H32O2 16:0 17.6
of output. The injector opening pressure and the static injection timing as specified by the manufacturer was 205 bar and 23oBTDC respectively. The Cooling of the engine was accomplished by circulating water through the jackets on the engine block and cylinder head. A piezoelectric pressure transducer was mounted with the cylinder head surface to measure the cylinder pressure. Engine performance tests were performed on a single-cylinder, constant-speed (1500 rpm), four-stroke variable compression ratio (VCR) diesel engine fitted with an eddy current dynamometer as shown in Figure 1. The specifications of the engine are given in Table IV.
Fig.1 Experimental Setup
The experiments were performed at different loads with various combinations of input parameters like Methyl Ester blend, compression ratio, nozzle opening pressure, injection nozzle geometry and fuel additive. Engine performance
parameters such as the brake specific fuel consumption (BSFC) was measured at full load after ensuring stable engine condition whereas emission parameters carbon monoxide (CO), carbon dioxide CO2, wavelength (ʎ),
oxides of nitrogen NOx, and un-burn hydrocarbons
measured using AVL exhaust gas analyzer (See Table V for specifications). Each test run was replicated three times for 16 runs.
C. Design of experiments
Taguchi method was used to optimize the engine operating parameters. Orthogonal L16 array was used to design the
experiment. The factors for which the engine is optimized are: compression ratio, injection pressure, nozzle, biodiesel fuel fraction and fuel additive (ml/ltr). Four levels of each factor are considered hence L16 array was the suggested and
most suitable array. Levels of each factor and design of experiment (DOE) are shown in Table VI and VII.
TABLEVI
LEVELS OF FACTORS FOR ENGINE TESTING
Parameters Levels
Compression Ratio 16 17 17.5 18 Injection Pressure (Bar) 330 310 290 270 Nozzle(Number of Holes) 1 2 3 4 Fuel fraction(% volume) 15 30 50 100 Additive(ml/ltr) 0 3 6 9
In the present study, the optimization of multiple performance characteristics of the diesel engine is done on the basis of a single grey relational grade rather than complicated performance characteristics. Equal weightage was assigned to each output variable (performance and emission). The BSFC was selected as performance variable and CO, NOx were selected as emission variables.
TABLEVII
DESIGN OF EXPERIMENT FOR ENGINE TESTING
Run Compression Ratio
Injection pressure (Bar)
Nozzle Geometry
Fuel fraction
(%)
Additive (ml/ltr)
1 16 330 1H 15 0
2 16 310 2H 30 3
3 16 290 3H 50 6
4 16 270 4H 100 9
5 17 330 2H 50 9
6 17 310 1H 100 6
7 17 290 4H 15 3
8 17 270 3H 30 0
9 17.5 330 3H 100 3
10 17.5 310 4H 50 0
11 17.5 290 1H 30 9
12 17.5 270 2H 15 6
13 18 330 4H 30 6
14 18 310 3H 15 9
15 18 290 2H 100 0
16 18 270 1H 50 3
D. Fuel Fraction Used for the test
Fuels used for the test include Mahua oil methyl ester and its blends. Biodiesel and diesel blends were prepared on the basis of percentage volume basis of diesel and biodiesel for net unit volume. The combination of B15, B30, B50, and TABLEIII
COMPARISON OF PHYSICO-CHEMICAL KEY PROPERTIES OF MAHUA BIODIESEL
WITH DIESEL AND JATROPHA BIODIESEL
Property Test Method Diesel *Jatropha
Biodiesel
Mahua Biodiesel Density at 15oC
(Kg/m3)
ASTMD 1298 832 0.880 882
Kinematic viscosity @ 40°C (cSt)
ASTM D445 4.7 4.84 5.6
Calorific Value (MJ/kg)
ASTM D240 42.49 35.2 36.9
Flash Point(°C) ASTM D93 53 103 129
Fire point(°C) ASTM D93 58 132 174
Cloud Point (°C)] ASTM D2500 -2 11 8
Pour Point(°C) ASTM D2500 -5 6 4
TABLEIV
EXPERIMENTAL ENGINE SPECIFICATIONS
Engine Type Single-cylinder, 4-stroke, constant speed (1500 rpm), variable compression ratio (VCR) CI engine Make and Model Kirloskar, TV1
Ignition System Compression Ignition
Bore 87.5 mm
Stroke 110 mm
Displacement Volume 660 cc Range of Compression
Ratio
12:1 to 18:1
Arrangement of Valves Overhead Cooling Medium Water Cooled Rated Power 3.75 kW at 1500 rpm Fuel Injection Timing 24o bTDC
Type of Combustion Chamber
Hemispherical Open
TABLEV
GAS ANALYZER SPECIFICATIONS
Measured Parameter
Measuring Range Accuracy
CO 0-10% vol ±0.03% vol ±5% of value CO2 0-20% vol ±0.5% vol
±5% of value UBHC 0-20,000 ppm
vol
±10 ppm ±5% of value NOx 0-5,000 ppm vol ±50 ppm
± 10% of value O2 0-22% vol ±0.1% vol
B100 were selected for the optimization. As the additive is used to improve the combustion properties of fuel, high percentage of biodiesel were selected for the experiment
III. RESULTS AND DISCUSSION
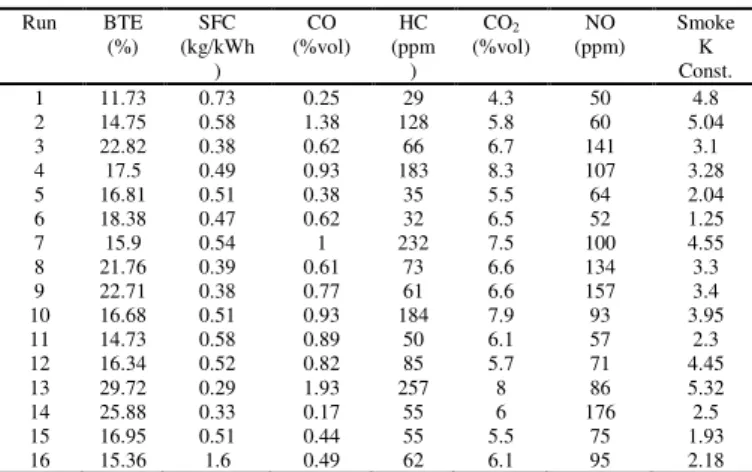
The resultobtained with L16 array is shown in Table VIII the
result is for 100% loading of the engine. The result table shows the BTE, SFC, NO, Smoke results for each test. These results were analyzed with ANOVA. The regression analysis is also done to form a linear model of the obtained results. The ranking of each factor is also described by the response of each factor. Table VIII shows the results of test conducted with diesel with same physical parameters instead of biodiesel blends with additive.
TABLEVIII
OBSERVATION DATA
Run BTE
(%) SFC (kg/kWh
)
CO (%vol)
HC (ppm )
CO2
(%vol) NO (ppm)
Smoke K Const.
1 11.73 0.73 0.25 29 4.3 50 4.8
2 14.75 0.58 1.38 128 5.8 60 5.04
3 22.82 0.38 0.62 66 6.7 141 3.1
4 17.5 0.49 0.93 183 8.3 107 3.28
5 16.81 0.51 0.38 35 5.5 64 2.04
6 18.38 0.47 0.62 32 6.5 52 1.25
7 15.9 0.54 1 232 7.5 100 4.55
8 21.76 0.39 0.61 73 6.6 134 3.3
9 22.71 0.38 0.77 61 6.6 157 3.4
10 16.68 0.51 0.93 184 7.9 93 3.95
11 14.73 0.58 0.89 50 6.1 57 2.3
12 16.34 0.52 0.82 85 5.7 71 4.45
13 29.72 0.29 1.93 257 8 86 5.32
14 25.88 0.33 0.17 55 6 176 2.5
15 16.95 0.51 0.44 55 5.5 75 1.93
16 15.36 1.6 0.49 62 6.1 95 2.18
The results of diesel and biodiesel were compared and it is found that the results obtained with biodiesel are in the same range as that for diesel. The brake thermal efficiency of biodiesel is nearly the same as that of diesel. For some tests the results are better for biodiesel. The maximum difference is within 2%. The same is true for SFC also. The emission parameters are within range with the diesel. Hence it can be concluded that the Mahua biodiesel have given improved results with additive.
A. Effect of operating parameters on brake thermal efficiency
The response obtained from each level of all factors is shown in the Table IX. The given for each parameter for its significance on the basis of its deviation from mean of response. It can be observed from the deviation that nozzle is most significant parameter for BTE which is followed by compression ratio, additive, fuel fraction and injection pressure. A multiple regression using least count is done to find the relation between the factors and BTE. The obtained equation is given as below:
The effect of each parameter is shown in Figure 2. It can be observed that 18 compression ratio is having highest BTE which reduces with reduction in CR. BTE continuously increases with increase in the injection pressure. Highest BTE is obtained with 330 bar injection pressure. Increase in efficiency is due to better atomization of fuel.3 hole nozzle is having highest BTE, while 1 hole nozzle is having lowest efficiency. BTE is highest for 30 percent blending of
biodiesel. BTE increases with increasing biodiesel percentage, this is because, and biodiesel is having high oxygen percentage which helps in improving the combustion.
Further addition of biodiesel decreases the calorific value of the fuel fraction which results in decrease in BTE. 6 ml/lit additive is having the highest brake thermal efficiency.
Increase in additive also tends to increase in heat losses which ultimately reduce the BTE.
B. Effect of operating parameters on specific fuel consumption
The response for each factor for SFC is shown in the Table X. It can be observed from the deviation of response from mean that nozzle is most significant parameter which is similar to BTE. Second most significant parameter is additive which is followed by fuel fraction, injection pressure and compression ratio. The linear relation between the operating parameter and SFC formed using multiple regressions least square method is shown below.
Fig. 3. Effect of operating parameters on specific fuel consumption
The effect of operating parameters on mean of SFC is shown in figure 3.
M
e
a
n
o
f
S
FC
(
k
g
/
k
W
h
)
18.0 17.5 17.0 16.0 0.8
0.7
0.6
0.5
0.4
330 310 290
270 1 2 3 4
100 50 30 15 0.8
0.7
0.6
0.5
0.4
9 6 3 0
C O MPRESSIO N RA TIO INJEC TIO N PRESSURE NO ZZLE
BLEND A DDITIVE
Effects of Factors On SFC (kg/kWh)
Fig. 2. Effect of operating parameters on brake thermal efficiency
M
e
a
n
o
f
B
T
H
E
(
%
)
18.0 17.5 17.0 16.0 24
22
20
18
16
330 310 290
270 1 2 3 4
100 50 30 15 24
22
20
18
16
9 6 3 0
C O MPRESSIO N RA TIO INJEC TIO N PRESSURE NO ZZLE
BLEND A DDITIVE
Effects of Factors On BTHE (%)
TABLEIX
RESPONSE FOR MEANS OF BTE
Level CR IP NOZZLE FUEL FRACTION ADD
1 16.70 17.74 15.05 17.46 16.78
2 18.21 17.60 16.21 20.24 17.18
3 17.62 18.92 23.29 17.92 21.82
4 21.98 20.24 19.95 18.89 18.73
Delta 5.28 2.64 8.24 2.78 5.03
It can be observed that 17 and 17.5 compression ratios are having nearly the same lowest SFC. 18 compression ratio is
having highest SFC. 270 bar injection pressure is having highest SFC which decreases with increase in pressure.330 bar is having lowest SFC.3 hole nozzle and 330 bar injection pressure are having lowest SFC because better penetration and atomization of fuel. The best results are obtained with 3 hole nozzle and 1 hole nozzle has given the worst results.30 and 100 percent are having nearly the same SFC. These results are similar to the BTE results. 6 ml/ ltr are having lowest SFC.
C. Effect of Operating Parameters on NO emission
The response for factors for NO emission is given in Table XI. It can be observed from the deviation of response from mean that nozzle is most significant factor which is followed by compression ratio, additive, fuel fraction and injection pressure. The following equation shows the relation between the factors and NO emission. A multiple regression using least square method is used to find the relation.
Fig. 4. Effect of Operating Parameters on NO emission
Figure 4 shows that no emissions increase with increase in compression ratio. This is due to better combustion due to increase in compression ratio. Compression ratio 17 is having lowest NO emissions. The injection pressure is not having much effect on the NO emission. 330 bar in injection pressure shows lowest emission.
The nozzle with 3 holes is having highest NO emission. The
lowest emission are shown by 1 hole nozzle because it has poor combustion which results in low flame temperature. NO formation is primary function of flame temperature. Higher the flame temperature, higher will be the NO emissions. The 30 percent fuel fraction has shown the lowest NO emission. 0 and 6 ml/ ltr additives are having the same effect on NO emission which is lowest.
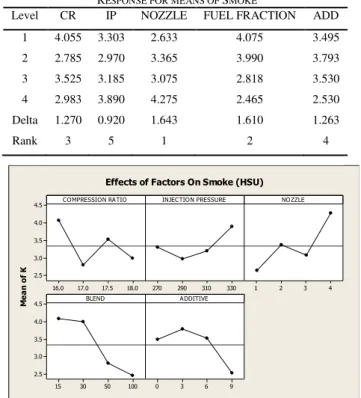
D. Effect of Operating Parameters on Smoke
The response of factor for smoke is shown in the Table XII. Nozzle is most significant factor for smoke emission. Which is followed by fuel fraction, compression ratio, additive and injection pressure.
Fig 5 Effect of Operating Parameters on smoke emission
The resultant equation obtained with multiple regression using least square method is given below.
Effect of operating parameters is shown in a figure 5. Formation of smoke is lowest for 17 compression ratio. This is nearly equal to smoke emissions caused by 18 compression ratio. The lowest smoke is found for 290 bar injection pressure which increases with increase in pressure. The single hole nozzle is having lowest smoke and it increases with increase in number of holes. The smoke decreases with increase in percentage of fuel fraction. This may be because percentage of oxygen increases with increase in biodiesel blending which results in reduction of smoke. The 9 ml/ ltr additive has shown the minimum smoke emission.
E. Summary
Design of experiments was done by using Taguchi method for optimization of diesel engine for Mahua oil with additive. AA-93 additive was used for improvement of
M
e
a
n
o
f
N
O
18.0 17.5 17.0 16.0 140
120
100
80
60
330 310 290
270 1 2 3 4
100 50 30 15 140
120
100
80
60
9 6 3 0
C O MPRESSIO N RA TIO INJEC TIO N PRESSURE NO ZZLE
BLEND A DDITIVE
Effects of Factors On NO (ppm)
M
e
a
n
o
f
K
18.0 17.5 17.0 16.0 4.5
4.0
3.5
3.0
2.5
330 310 290
270 1 2 3 4
100 50 30 15 4.5
4.0
3.5
3.0
2.5
9 6 3 0
C O MPRESSIO N RA TIO INJEC TIO N PRESSURE NO ZZLE
BLEND A DDITIVE
Effects of Factors On Smoke (HSU) TABLEXII
RESPONSE FOR MEANS OF SMOKE
Level CR IP NOZZLE FUEL FRACTION ADD
1 4.055 3.303 2.633 4.075 3.495
2 2.785 2.970 3.365 3.990 3.793
3 3.525 3.185 3.075 2.818 3.530
4 2.983 3.890 4.275 2.465 2.530
Delta 1.270 0.920 1.643 1.610 1.263
Rank 3 5 1 2 4
TABLEX
RESPONSE FOR MEANS OF SFC
Level CR IP NOZZLE FUEL FRACTION ADD
1 0.5450 0.7500 0.8450 0.5300 0.5350
2 0.4775 0.5025 0.5300 0.4600 0.7750
3 0.4975 0.4725 0.3700 0.7500 0.4150
4 0.6825 0.4775 0.4575 0.4625 0.4775
Delta 0.2050 0.2775 0.4750 0.2900 0.3600
Rank 5 4 1 3 2
TABLEXI
RESPONSE FOR MEANS OF NO EMISSION
Level CR IP NOZZLE BLEND ADD
1 89.50 101.75 63.50 99.25 88.00
2 87.50 93.25 67.50 84.25 103.00
3 94.50 95.25 152.00 98.25 87.50
4 108.00 89.25 96.50 97.75 101.00
Delta 20.50 12.50 88.50 15.00 15.50
performance of diesel engine for mahua oil. The results obtained with Mahua oil biodiesel with additive were compared to that of diesel. It was found that Mahua biodiesel with additive has given nearly same results as those diesel readings. The diesel engine operating parameters was optimized are: compression ratio, injection pressure, nozzle, fuel fraction and additive with four levels of each factor by using L16 orthogonal array. The optimized
engine conditions are; 18:1 compression ratio. 330bar injection pressure, 3 hole nozzle, 30 percent biodiesel fuel
fraction and 6 ml/ltr additive content. The result obtained with optimize condition are given in Table XIII
IV. CONCLUSION
The world is facing the energy crisis hence it is necessary to find the different energy resources, due to this the use of non-renewable energy sources is new trend in the energy world. One of the alternative renewable energy resource options is the use of biodiesel. Concept of use of biodiesel is there from the invention of the diesel engine. But due the large prize, unavailability the concept was not developed. Government of India has taken an initiative to mainstream the biofuels. Use of biofuels will be beneficial for country to become energy independent. In national biofuel policy, the use of edible oils for the use of biofuel production is prohibited. It is mentioned to focus on the local feedstocks for the biofuel production which gives direction to the research. Mahua seed is available in plenty of amount in our country; it can be large source of biodiesel.
Operating parameters of diesel engine were optimized for the Mahua oil methyl ester with additive. AA-93 additive was to improve the combustion of biodiesel blends. L16 orthogonal array was selected for experiment with five factors and four levels. The operating parameters optimized are: compression ratio, injection pressure, nozzle geometry, biodiesel fuel fraction and additive amount. The results of combustion and emission were obtained and compared with the results of diesel for same parameters. It was found that Mahua oil with additive has given results similar to the diesel. Results obtained were analyzed using ANOVA. Optimum operating parameters are: 18 compression ratio, 330 bar injection pressure, 3 hole nozzle, 30% biodiesel fuel fraction and 6 ml/ltr additive amount. Further test was taken at optimum conditions. The obtained results are: 29.89% BTE, 0.28 SFC (kg/ kwh), 42 ppm HC, 4.1% vol CO2, 81 ppm NOx, 1.52 HSU smoke. At optimum conditions the engine performance is improved and emissions are reduced as compared to diesel.
REFERENCES
[1] Ahmad, a.L., N.H. Mat Yasin, C.J.C. Derek, and J.K. Lim. 2011.
“Microalgae as a Sustainable Energy Source for Biodiesel Production:
A Review.” Renewable and Sustainable Energy Reviews 15 (1). Elsevier Ltd: 584–93. doi:10.1016/j.rser.2010.09.018.
[2] Ashraful, a.M., H.H. Masjuki, M.a. Kalam, I.M. Rizwanul Fattah, S. Imtenan, S.a. Shahir, and H.M. Mobarak. 2014. “Production and Comparison of Fuel Properties, Engine Performance, and Emission Characteristics of Biodiesel from Various Non-Edible Vegetable Oils:
A Review.” Energy Conversion and Management 80 (April). Elsevier Ltd: 202–28. doi:10.1016/j.enconman.2014.01.037.
[3] Balat, Mustafa, and Havva Balat. 2010. “Progress in Biodiesel
Processing.” Applied Energy 87 (6). Elsevier Ltd: 1815–35. doi:10.1016/j.apenergy.2010.01.012.
[4] Barnwal, B K, and M P Sharma. 2005. “Prospects of Biodiesel
Production from Vegetable Oils in India.” Renewable and Sustainable
Energy Reviews 9 (4): 363–78. doi:10.1016/j.rser.2004.05.007.
[5] Boro, Jutika, Dhanapati Deka, and Ashim J. Thakur. 2012. “A Review on Solid Oxide Derived from Waste Shells as Catalyst for
Biodiesel Production.” Renewable and Sustainable Energy Reviews 16 (1). Elsevier Ltd: 904–10. doi:10.1016/j.rser.2011.09.011. [6] “BP Statistical Review of World Energy. http://www.bp.com
/en/global/statistical-review-of-world-energy (2014).
[7] “Faster sustainable and more inclusive growth, an approach to the twelfth five year plan (2012-17), Government of India planning commision http://www.planningcommission. nic.in (2012)”
[8]Ganapathy, T., K. Murugesan, and R. P. Gakkhar. 2009.
“Performance Optimization of Jatropha Biodiesel Engine Model
Using Taguchi Approach.” Applied Energy 86 (11). Elsevier Ltd: 2476–86. doi:10.1016/j.apenergy.2009.02.008.
[9]Haas, Michael J, Andrew J McAloon, Winnie C Yee, and Thomas a
Foglia. 2006. “A Process Model to Estimate Biodiesel Production
Costs.” Bioresource Technology 97 (4): 671–78. doi:10.1016/j.biortech.2005.03.039.
[10]Helwani, Z., M.R. Othman, N. Aziz, W.J.N. Fernando, and J. Kim.
2009. “Technologies for Production of Biodiesel Focusing on Green Catalytic Techniques: A Review.” Fuel Processing Technology 90 (12). Elsevier B.V.: 1502–14. doi:10.1016/j.fuproc.2009.07.016. [11]Iglesias, Loreto, Adriana Laca, Mónica Herrero, and Mario Díaz.
2012. “A Life Cycle Assessment Comparison between Centralized
and Decentralized Biodiesel Production from Raw Sun Fl Ower Oil
and Waste Cooking Oils” 37: 162–71. doi:10.1016/j.jclepro.2012.07.002.
[12]Karaosmanog, Filiz. 2004. “Optimization of Base-Catalyzed
Transesterification” 5 (2): 1888–95.
[13]Karnwal, A, M M Hasan, N Kumar, A N Siddiquee, and Z A Khan. 2011. “Multi-Response Optimization Of Diesel Engine Performance Parameters Using Thumba Biodiesel-Diesel Blends By Applying The Taguchi Method And Grey Relational Analysis” 12 (4): 599–610. doi:10.1007/s12239.
[14] Government of India, Minstry of new and renewable energy: National policy of biofuel, New delhi, India 1-18 (2012)
[15]Marchetti, J M Ã, V U Miguel, and A F Errazu. 2007. “Possible
Methods for Biodiesel Production” 11: 1300–1311. doi:10.1016/j.rser.2005.08.006.
[16]Mythili, R, P Venkatachalam, P Subramanian, and D Uma. 2014.
“Production Characterization and Ef Fi Ciency of Biodiesel : A Review.” doi:10.1002/er.
[17] S. S. Raju, R. Chand, P. Kumar, and Siwa Msangi: Biofuels in India: Potential , Policy and Emerging Paradigms. NCAP, Government of India, New Delhi, India (2012).
[18]Production, Reserves, Prices Refi, and Prices Trade. 2013. “BP Statistical Review of World Energy About This Review Contents,” June2013.
[19]Santori, Giulio, Giovanni Di Nicola, Matteo Moglie, and Fabio
Polonara. 2012. “A Review Analyzing the Industrial Biodiesel
Production Practice Starting from Vegetable Oil Refining.” Applied
Energy 92 (April). Elsevier Ltd: 109–32.
doi:10.1016/j.apenergy.2011.10.031.
[20]Sharma, Y C, and B Singh. 2009. “Development of Biodiesel :
Current Scenario” 13: 1646–51. doi:10.1016/j.rser.2008.08.009. [21]Shay, E.Griffin. 1993. “Diesel Fuel from Vegetable Oils: Status and
Opportunities.” Biomass and Bioenergy 4 (4): 227–42. doi:10.1016/0961-9534(93)90080-N.
[22]Silitonga, a.S., H.H. Masjuki, T.M.I. Mahlia, H.C. Ong, a.E. Atabani,
and W.T. Chong. 2013. “A Global Comparative Review of Biodiesel
Production from Jatropha Curcas Using Different Homogeneous Acid and Alkaline Catalysts: Study of Physical and Chemical Properties.”
Renewable and Sustainable Energy Reviews 24 (August). Elsevier:
514–33. doi:10.1016/j.rser.2013.03.044.
[23] Statistical Division Food and Agricultural Organisation of United Nations. Economic and social Department. UN Food and Agricultural Organisation Corporate statistical Database, http://www.fao.org/statistical/en (2012).
[24]Talebian-Kiakalaieh, Amin, Nor Aishah Saidina Amin, and Hossein
Mazaheri. 2013. “A Review on Novel Processes of Biodiesel
Production from Waste Cooking Oil.” Applied Energy 104 (April): 683–710. doi:10.1016/j.apenergy.2012.11.061.
TABLEXIII
RESULTS FOR OPTIMUM CONDITION
Test No.
BTE (%)
SFC (kg/kWh)
CO (%vol)
HC (ppm)
CO2 (%vol)
NO