International Journal for Quality Research 10(3) 495–510 ISSN 1800-6450
Pratik Badgujar
1Bachchan Kanungo
G.D. Thakar
Article info:
Received 23.11.2015 Accepted 08.02.2016 UDC – 54.061 DOI – 10.18421/IJQR10.03-04
IDENTIFICATION OF FACTORS
AFFECTING LEAN MANUFACTURING
IMPLEMENTATION IN PUMP
MANUFACTURING COMPANIES IN INDIA-
A CASE STUDY
Abstract: Lean Manufacturing has now become a common
word in the industrial corridors. It has now been applied to the industries of several domains. No wonder that the Pump manufacturing has also witnessed profound influence of Lean philosophy. Pump manufacturing in India has a history as old as 80 years with more than 500 pump manufacturing units presently working. The present research is an explorative study and was undertaken to identify various factors affecting lean manufacturing implementation in pump manufacturing industry. Analysis of results revealed that the companies registered increase in productivity and reduction in costs and wastes. Lack of understanding, Supply chain and Company culture are found to be the strongest barriers of lean manufacturing implementation. The multiple regression model revealed that Lack of workers support can be fairly reduced by educating them about Lean Manufacturing and establishing a healthy communication with workers. An analysis across different management levels revealed disparity in perceptions and views of personnel. There is a need for top management to align organization toward common goals so as to achieve better success in implementing lean manufacturing.
Keywords: Lean manufacturing, pump industry, lean
manufacturing implementation
1.
Introduction
1Lean manufacturing has become a very popular tool for production management. Industries from various domains are adopting lean manufacturing in hope for improving their performances. Many researchers have studied lean manufacturing implementation in different industries all
1
Corresponding author: Pratik Badgujar email: [email protected]
strength of about 560 and is situated in central India. Plant 2 is established recently about, 3 years ago with employee strength of 140 and is situated in western India.
The purpose of this research is to identify various factors that affect lean manufacturing implementation in pump manufacturing industry. The research is done using a questionnaire based survey aided with non-structured interviews with employees of company at various levels.
2.
Literature review
Researchers have defined Lean Manufacturing in different words. Shah and Ward (2003) defined Lean manufacturing as an integrated system composed of highly inter-related elements and a wide variety of management practices, including Just-in-Time (JIT), quality systems, work teams and cellular manufacturing.
Since the early 1980s, the new lean manufacturing methods have gained worldwide acceptance and international acclaim (Womack, 2007).
According to Hudli Mohd et al. (2010)
―Lean production method is an effective way to improve management, enhance the international competitiveness of
manufacturing enterprises.‖ Following are
some of the major lean manufacturing techniques (Mahapatra and Mohanty, 2007; Chaple et al., 2014; Kumar Akhil, 2014):
1) 5S
2) Value Stream Mapping (VSM). 3) Group Problem Solving 4) Cross Functional Team 5) Kanban /Pull Production 6) Visual Control
7) Setup time reduction 8) Continuous flow 9) Leveled Production 10) One Piece flow 11) Kaizen 12) Poka-Yoke
Lean Manufacturing has also been applied in pump manufacturing industry and results were quite encouraging. Here are some examples of implementation of lean manufacturing in pump manufacturing industry:
Ramamoorthy et al. (2008) reported that "...The efficiency of the centrifugal pump manufacturing industries is to be increased considerably by applying the Lean Manufacturing System and Kaizen Technique."
Joshi et al. (2009) succeeded in reducing the throughput time of pump manufacturing by almost 35 % by implementing lean manufacturing techniques. They identified various wastes (Muda, Mura and Muri) to improve the productivity.
Mopuru et al. (2013) applied lean manufacturing in oil pump unit in Chennai (India) and they report that "...The project was very useful for the organization and it has enhanced single piece flow, manpower reduction. Material movement and transport time is reduced".
Prabhu C and Aravindha Balaji S (2014) applied Value Stream Mapping and successfully reduced production lead times with increased productivity.
3.
Objectives of study
4.
Data Collection and Analysis
The research has five dimensions viz. trigger factors, expected benefits, benefits achieved, wastes eliminated and barriers interfaced. Here is a short description of included dimensions:
Trigger factors are factors based on which organizations are compelled to adopt lean manufacturing. Expected benefits and Benefits
achieved are benefits apart from trigger factors which are expected and achieved by implementing lean manufacturing.
Barriers experienced are the major obstacles which companies face in the course of implementing lean manufacturing.
Wastes Eliminated measures the extent of elimination of seven kinds of wastes as identified in lean manufacturing philosophy.
4.1. Sample Size determination
The sample size is statistically determined using the following equation:
n = σ2 z2 / L2
where,
n = Sample Size
z = z value associated with the confidence level
L = Margin of Error
σ = Standard Deviation
Firstly, pilot survey was done on a sample of 30 respondents. Following data was obtained from this sample:
σ = 1.084, mean = 3.75, for all variables considered for study. The margin of error L is chosen as 5% of mean, thus L = .187 and z = 1.96, for 95% confidence level. This yields a value of sample size of 130.
n = (1.084)2 * (1.96)2 / (.187)2 = 129.08 ≈ 130
The data has been collected using convenient sampling. The employees of two pump manufacturing units located in central India (plant 1) and western India (plant 2) are considered for collecting data. The total number of valid and complete responses received is 135 which can be said to be satisfactory.
On analyzing the results of pilot study the results of all the variables included were
found to be significant (having Cronbach‘s
alpha higher than 0.60). Hence the pilot questionnaire was finalized and it was used for further study as well.
4.2. Respondent Profile
As stated above total 135 responses were collected from employees of the two pump manufacturing companies. A detailed analysis of respondent profile is presented here:
Table 1. Responses Rate
Plant Total Staff Responses available Response rate Cumulative %age
Plant 1 45 31 68.89 % 23
Plant 2 134 104 77.61 % 77
Figure 1. Respondents‘ Job Profile
Table 2. Management level wise available responses
S. No.
Management level
Job titles included Respondent No.
Tota l
%ag e
1 Lower Supervisors and Assistant Managers 6 + 48 54 40.0 0 2 Middle Team leaders and Associate Managers 15 + 34 49 36.3
0 3 Top Executives, Managers and Divisional
Managers
3 + 8 + 21 32 23.7 0
Total 135 100
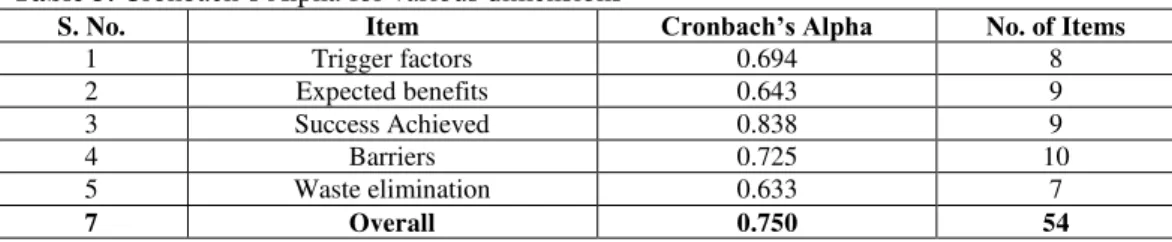
4.3. Internal reliability
The data collected was tested for internal
consistency using Cronbach‘s alpha. Cronbach‘s alpha (α) or Coefficient alpha is
a measure of internal consistency reliability that is the average of all possible split-half
coefficients resulting from different splitting of the scale terms, Malhotra and Dash,
(2011). The value of Cronbach‘s alpha for
various dimensions is found to be satisfactory as all the values are above the threshold value of 0.60.
Table 3. Cronbach‘s Alpha for various dimensions
S. No. Item Cronbach’s Alpha No. of Items
1 Trigger factors 0.694 8
2 Expected benefits 0.643 9
3 Success Achieved 0.838 9
4 Barriers 0.725 10
5 Waste elimination 0.633 7
7 Overall 0.750 54
5.
Results and discussions
5.1. Identification of Trigger factors
The research was carried out to identify various factors affecting lean manufacturing
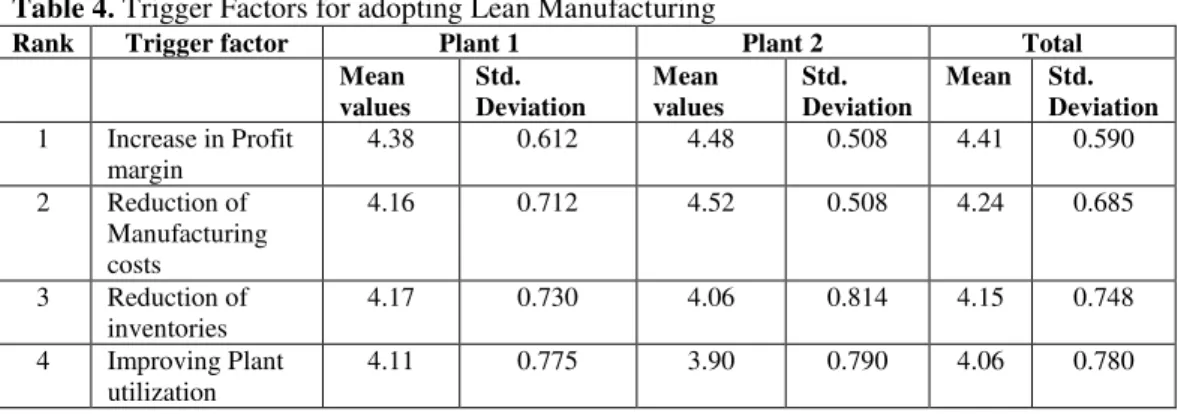
Table 4. Trigger Factors for adopting Lean Manufacturing
Rank Trigger factor Plant 1 Plant 2 Total Mean
values
Std. Deviation
Mean values
Std. Deviation
Mean Std. Deviation
1 Increase in Profit margin
4.38 0.612 4.48 0.508 4.41 0.590
2 Reduction of Manufacturing costs
4.16 0.712 4.52 0.508 4.24 0.685
3 Reduction of inventories
4.17 0.730 4.06 0.814 4.15 0.748
4 Improving Plant utilization
4.11 0.775 3.90 0.790 4.06 0.780
1) Increase in Profit Margin: This has been rated as the highest trigger factor for adopting lean manufacturing in both the pump manufacturing units. It is observed that the factor is stronger at Plant 2 as compared to Plant 1.
2) Reduction of Manufacturing costs: This is the second major trigger factor for adopting lean manufacturing. It is observed that the factor is stronger at Plant 2 as compared to Plant 1.
3) Reduction of Inventories: The companies also wanted to reduce
their inventory levels and hence switched to lean manufacturing. It is observed that the factor is stronger at Plant 1 as compared to Plant 2.
4) Improving Plant Utilization: Plant utilization is also found to be a major factor for adopting lean manufacturing. Considering means and standard deviation it is observed that the factor is stronger at Plant 1 as compared to Plant 2. Employees of plant 1 are more inventories conscious while those of plant 2 are more concerned about profit, cost and quality.
Table 5. Management level wise view of Trigger factors
Rank 1 Rank 2 Rank 3
Top level Management
Trigger factor
Reduction of Manufacturing cost
Increasing Profit margins
Maintain Market share
Mean 4.25 4.25 4.19
Std. Deviation
0.618 0.718 0.734
Middle level Management
Trigger factor
Increase in profit margin
Reduction of Manufacturing cost
Reduction of Inventory
Mean 4.49 4.18 4.18
Std. Deviation
0.545 0.659 0.755
Lower level Management
Trigger factor
Increase in profit margin
Reduction of manufacturing cost
Reduction of inventory
Mean 4.43 4.30 4.22
Std. Deviation
0.536 0.662 0.718
The most important trigger factor identified by top management is reduction of
However priorities of implementing lean manufacturing are seen to vary down the management levels. The middle and lower management has perception that lean is implemented to increase profits followed by reduction of costs and reduction of inventory. The disparity in views across management levels highlights misalignment of perception about goals of implementing lean manufacturing. To achieve profound success in lean manufacturing it becomes
important that there is a uniformity of objectives throughout the organization, which is found to be missing in the concerned organizations.
5.2. Identification of benefits expected
The major benefits expected by the companies as revealed on the basis of frequency analysis are (Table 6 and 7):
Table 6. Benefits Expected by applying Lean Manufacturing
Rank Expected Benefits
Plant 1 Plant 2 Total
Mean Std. Deviation
Mean Std. Deviation
Mean Std. Deviation
1 Improved Productivity
4.24 0.675 4.23 0.680 4.24 0.704
2 Reduced costs 4.14 0.781 4.16 0.735 4.15 0.768
3 Decreased Inventory levels
4.16 0.860 3.87 0.670 4.10 0.827
4 Improve Customer Satisfaction
4.01 1.029 4.03 0.795 4.01 0.977
Table 7. Management level view of Expected benefits
Rank 1 Rank 2 Rank 3
Top level Management
Expected Benefits
Reduction of wastes
Improve productivity
Improve Customer satisfaction
Mean 4.28 4.16 4.08
Std. Deviation
0.851 0.808 0.749
Middle level Management
Expected Benefits
Improving Productivity
Improve response time
Improve Customer satisfaction
Mean 4.31 4.02 3.92
Std. Deviation
0.619 0.750 0.886
Lower level Management
Expected Benefits
Improving Productivity
Improving quality
Improving Customer satisfaction
Mean 4.22 3.96 4.06
Std. Deviation
0.708 0.795 0.843
Improved Productivity: Improved productivity was the most highly expected benefit of lean manufacturing implementation. However, considering means and standard deviation it is observed
that the factor is almost equally strong at Plant 1 as well as Plant 2. Reduced Costs: It was rated as
factor is stronger at Plant 2 as compared to Plant 1.
Decreased Inventory Levels: it was also an expected benefit. Considering means and standard deviation it is observed that the factor is stronger at Plant 1 as compared to Plant 2. However the strength of view is higher at Plant 2. Improved Customer satisfaction:
Improving customer satisfaction was also a benefit sought by the companies.
The top management expected reduction of wastes, improvement and improving
customer satisfaction as major expected benefits. However middle and lower management expected improving productivity as prime benefit. All the three management levels expect improved customer satisfaction as an benefit.
5.3. Benefits Achieved
The companies succeeded in achieving following benefits after implementing lean manufacturing.
Table 8. Benefits Achieved by applying Lean Manufacturing
Rank Benefits Achieved
Plant 1 Plant 2 Total
Mean values
Std. Deviation
Mean values
Std. Deviation
Mean Values
Std. Deviation
1 Improved productivity
4.23 0.753 4.58 0.672 4.31 0.748
2 Improved quality
4.07 0.792 4.39 0.715 4.14 0.784
3 Reduced costs 4.09 0.739 3.81 0.833 4.02 0.767 4 Improved
Profitability
3.97 0.908 3.94 0.727 3.96 0.867
Improved productivity: The pump manufacturing companies experienced an increase in their productivity. However considering means and standard deviation it is observed that the increase is stronger at Plant 2 as compared to Plant 1.
Improved Quality: The quality of production was improved. The improvement in quality was higher at plant 2 than plant 1.
Reduced Costs: The cost of production of companies was also reduced. Considering means and standard deviation it is inferred that the reduction is higher at Plant 2 as compared to Plant 1.
Table 9. Management level view of Benefits achieved
Rank 1 Rank 2 Rank 3
Top level Management
Benefits Achieved
Improved productivity
Improved quality
Improved Customer satisfaction
Mean 4.31 4.38 4.06
Std. Deviation 0.693 0.707 0.619
Middle level Management
Benefits Achieved
Improved Productivity
Reduced costs Improved Response time
Mean 4.33 4.20 4.08
Std. Deviation 0.747 0.763 0.739
Lower level Management
Benefits Achieved
Improved Productivity
Improved quality
Reduced inventory
Mean 4.30 4.07 4.07
Std. Deviation 0.792 0.797 0.873
5.4. Identification of Barriers experienced
Following major barriers are observed to be obstructing progress of lean manufacturing
implementation in the concerned pump manufacturing units:
Table 10. Barriers identified in implementing Lean Manufacturing
Rank Barriers Identified
Plant 1 Plant 2 Total
Mean values
Std. Deviation
Mean values
Std. Deviation
Mean values
Std. Deviation
1 Lack of understanding
4.15 0.773 4.39 0.844 4.21 0.793
2 Supply Chain 3.84 1.025 4.23 0.762 3.93 0.982
3 Company culture
3.81 0.749 3.53 0.840 3.59 0.849
Lack of Understanding and its
implications: Lack of
understanding is the most significant barrier identified. Hence it can be said that there is lack of clarity about lean manufacturing principles Due to lack of understanding the staff members cannot work smoothly and there may be a chaotic situation. The barrier is experienced strongly for Plant 2 than at Plant 1. However the view of Plant 1 respondents is more uniform as the value of standard deviation for plant 1 is less.
Supply Chain and its
implications: Another significant barrier experienced by companies is Supply Chain. Due to the presence
Company Culture and its implications: Company Culture
includes workers‘ behavior,
worker-staff-management
relationship, employee perceptions etc. There is a human tendency to
resist change and the organizations under this research also faced this problem. Considering means and standard deviation it is inferred that the barrier is observed to be strong at Plant 1 as compared to Plant 2.
Table 11. Barriers viewed at different management levels
Rank 1 Rank 2 Rank 3
Top level Management
Barrier Lack of understanding
Supply Chain
Company Culture
Mean 4.31 4.09 3.72
Std. Deviation
0.738 0.963 0.888
Middle level Management
Barrier Lack of understanding
Supply Chain
Lack of suppliers support
Mean 4.14 3.71 3.63
Std. Deviation
0.913 0.843 0.742
Lower level Management
Barrier Lack of understanding
Supply Chain
Company culture
Mean 4.20 4.02 3.59
Std. Deviation
0.711 0.961 0.836
On analyzing the data considering different management levels, no significant difference in views of different management levels about barriers was observed. The respondents were equivocal in realization of barriers faced by the companies in implementing lean manufacturing.
5.5. Success achieved in Wastes Elimination/Reduction
As stated above there are seven different types of wastes identified in Lean manufacturing. Following wastes were eliminated /reduced by the pump manufacturing companies under consideration:
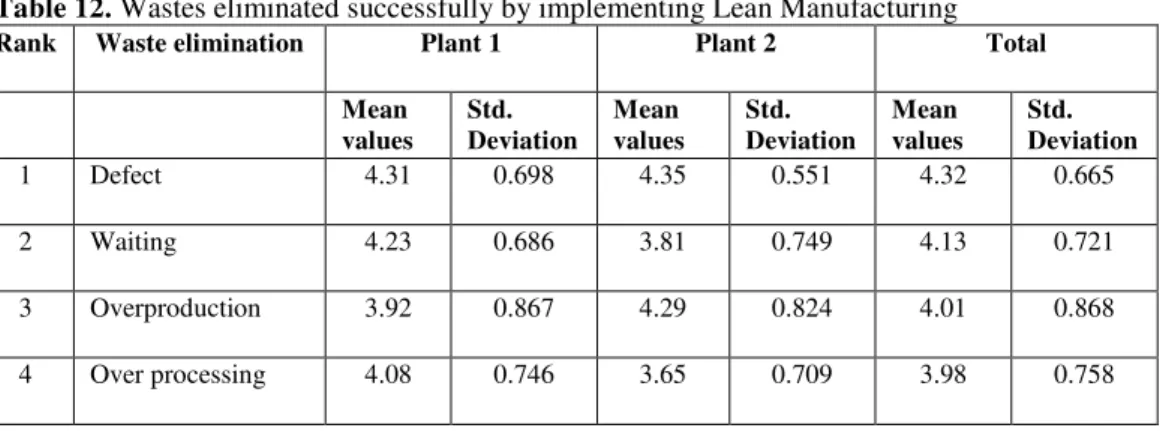
Table 12. Wastes eliminated successfully by implementing Lean Manufacturing
Rank Waste elimination Plant 1 Plant 2 Total
Mean values
Std. Deviation
Mean values
Std. Deviation
Mean values
Std. Deviation
1 Defect 4.31 0.698 4.35 0.551 4.32 0.665
2 Waiting 4.23 0.686 3.81 0.749 4.13 0.721
3 Overproduction 3.92 0.867 4.29 0.824 4.01 0.868
Table 13. Management level view of Wastes eliminated
Rank 1 Rank 2 Rank 3
Top level Management Waste eliminated Defects Waiting Overproduction
Mean 4.31 4.16 4.03
Std. Deviation 0.693 0.723 0.782
Middle level Management Waste eliminated Defects Waiting Overproduction
Mean 4.43 4.18 4.06
Std. Deviation 0.677 0.667 0.800
Lower level Management Waste eliminated Defects Waiting Over processing
Mean 4.22 4.07 3.89
Std. Deviation 0.634 0.773 0.744
Defects: Both the pump
manufacturing companies were able to reduce defects in their production output. Although the defect level is still high, it is reduced considerably as compared to times before lean manufacturing was implemented. The elimination of this waste was more successful at Plant 2 as compared to Plant 1.
Overproduction: There was also a reduction in overproduction. As the lean manufacturing is a pull production technique the production levels are limited only to the requirement. The elimination of this waste was done more successfully at Plant 2 as compared to Plant 1. Waiting Time: There was also a
reduction in waiting time. It symbolizes that the production schedules were streamlined, lines became more balanced and hence
production planning was improved. The elimination of this waste was done more successfully at Plant 1 as compared to Plant 2.
Over processing: The over processing was also reduced as a consequence of lean manufacturing adoption and implementation. The elimination of this waste was done more successfully at Plant 1 as compared to Plant 2.
Reduction in number of Defects and waiting time was noticed by all management levels personnel. Here also there is unanimity in the views across management levels which is desirable.
5.6. Correlations
Correlation analysis is carried out to identify any major correlations between variables.
Pearson‘s correlation coefficient was used for this purpose.
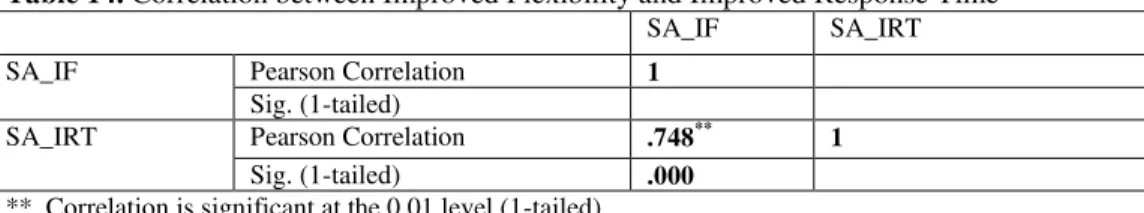
Table 14. Correlation between Improved Flexibility and Improved Response Time
SA_IF SA_IRT
SA_IF Pearson Correlation 1
Sig. (1-tailed)
SA_IRT Pearson Correlation .748** 1
Sig. (1-tailed) .000
**. Correlation is significant at the 0.01 level (1-tailed). Where SA_IF= Success achieved in improving flexibility, SA_IRT= Success achieved in improving response time
On performing correlations analysis strongly positive correlation is observed between
Table 15. Correlation between Reduced cost and Improved Productivity
SA_RC SA_IPROD
SA_RC Pearson Correlation 1
Sig. (1-tailed)
SA_IPROD Pearson Correlation .853 1
Sig. (1-tailed) .001
**. Correlation is significant at the 0.01 level (1-tailed). Where, SA_RC= Success achieved in Reducing costs, SA_IPROD= Success achieved in improving productivity
Another strong positive correlation was found between Reduced costs and Improved productivity with Pearson‘s coefficient value
0.853. It means that productivity can be improved by reduction of costs of production. This is a commonly accepted and understood fact and the same has been proved in this research also.
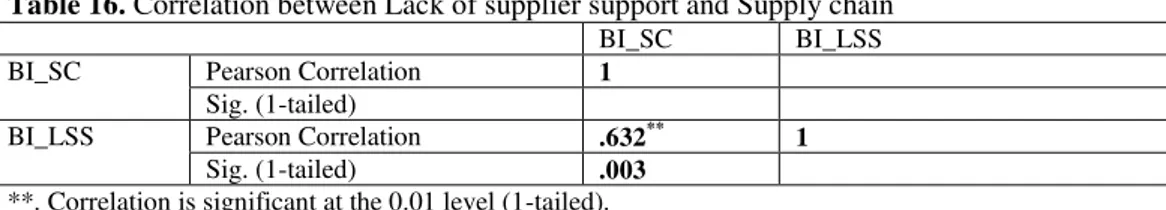
Table 16. Correlation between Lack of supplier support and Supply chain
BI_SC BI_LSS
BI_SC Pearson Correlation 1
Sig. (1-tailed)
BI_LSS Pearson Correlation .632** 1
Sig. (1-tailed) .003
**. Correlation is significant at the 0.01 level (1-tailed). Where, BI_SC= Barriers interfaced Supply chain, BI_LSS= Barriers interfaced Lack of
suppliers‘ support.
A strong positive correlation was found between barriers Lack of Suppliers’ support and Supply Chain withPearson‘s coefficient value 0.632 .It implies that Supply chain performance can be improved if suppliers support is good.
5.7. Development of Regression Model
Multiple regression analysis is a stastical technique that simultaneously develops a mathematical relationship between two or more independent variables and an interval-scaled dependent variable (Malhotra and Dash, 2011).
A regression model was developed for Lack of Workers Support stepwise linear multiple regression. It was developed in order to identify contributors of workers resistance. The Regression Analysis revealed that workers support is significantly influenced
positively by four input factors viz. Lack of Leadership (t= 4.009, p<0.01), Past Failure (t= 3.432, p< 0.01), Lack of communication (t= 3.035 p<0.01) and Company Culture (t= 2.379, p< 0.01). The predictor variable of Lack of Workers support has value of t= -1.528 and small value of p<0.00 suggests, it has negative impact on dependent variable than any other variable.
Where, BI_LL is Lack of Leadership, BI_PF past failures, BI_LC Lack of communication and BI_CC Company culture
Regression Equation:
Lack of Workers support (Y) = -.764 + 0.302 X1+ 0.254X2 + 0.226X3 +0.173X4 Where, Y = Lack of Workers‘ Support
(BI_LWS)
Table 17. Standardized and unstandardized coefficients
Model Unstandardized Coefficients Standardized Coefficients t Sig.
B Std. Error Beta
(Constant) -.764 .500 -1.528 .129
BI_LL .331 .083 .302 4.009 .000
BI_PF .250 .073 .254 3.432 .001
BI_LC .268 .088 .226 3.035 .003
BI_CC .245 .103 .173 2.379 .019
Workers‘ support is a major concern in any changes adopted in organizations. This barrier is not just limited to Lean Manufacturing but affects any organization implementing changes. This research identifies Lack of Leadership, Past failures, Lack of communication and Company Culture as major reasons for Lack of
workers‘ support. The workers‘ resistance
can be reduced or eliminated by addressing identified factors.
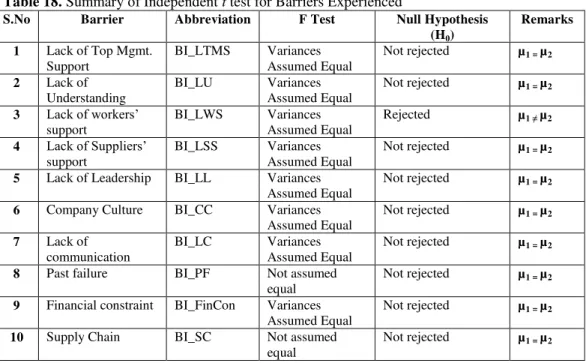
Testing of hypotheses
Independent t test was applied to find out difference in opinions of employees of two companies about Barriers Experienced by the two pump manufacturing units under considerations Following hypotheses were tested using this test at a 95% confidence level:
Null Hypothesis H0: µ1 = µ2 Alternate Hypothesis H1: µ1 ≠ µ2
where, µ1 and µ2 are means of plant1 and plant 2 respectively.
Table 18. Summary of Independent t test for Barriers Experienced
S.No Barrier Abbreviation F Test Null Hypothesis (H0)
Remarks
1 Lack of Top Mgmt. Support
BI_LTMS Variances Assumed Equal
Not rejected µ1 = µ2
2 Lack of Understanding
BI_LU Variances Assumed Equal
Not rejected µ1 = µ2
3 Lack of workers‘
support
BI_LWS Variances Assumed Equal
Rejected µ1 ≠ µ2
4 Lack of Suppliers‘
support
BI_LSS Variances Assumed Equal
Not rejected µ1 = µ2
5 Lack of Leadership BI_LL Variances Assumed Equal
Not rejected µ1 = µ2
6 Company Culture BI_CC Variances Assumed Equal
Not rejected µ1 = µ2
7 Lack of communication
BI_LC Variances Assumed Equal
Not rejected µ1 = µ2
8 Past failure BI_PF Not assumed equal
Not rejected µ1 = µ2
9 Financial constraint BI_FinCon Variances Assumed Equal
Not rejected µ1 = µ2
10 Supply Chain BI_SC Not assumed equal
Not rejected µ1 = µ2
On analyzing the results of Independent t test (Table No. 10) it is observed that both the plants are equivocal in barriers perceived by them except in case of Lack of Workers’
support. In case of Workers‘ support at plant
1 observed BI_LWS (Lack of Workers‘
It implies that companies which were working with conventional systems are likely to face more resistance from workers than those units which adopt lean manufacturing system right from the establishment.
6.
Conclusion
After analyzing responses it is concluded that Increase in Profit margin, Reduction of manufacturing costs, Reduction of inventories and Improving quality are the strongest trigger factors for adopting Lean Manufacturing in pump manufacturing industry. The companies succeeded in improving productivity and quality as well as reducing costs and wastes in the plant. In the course of implementing lean manufacturing the companies interfaced Lack of understanding, Supply Chain and Company culture as major barriers.
Strong positive correlations were observed between improved flexibility and improved response time, reduced cost and improved productivity as well as barriers Lack of
suppliers‘ support and Supply Chain.
The Regression model for barrier ‗Lack of worker‘s support‘ revealed that Lack of
Leadership, Past failure experience, Lack of communication and Company contribute to
increase workers‘ resistance. To counter this,
company should have a deep understanding of lean manufacturing philosophy and principles. The workers should be educated and taken into confidence before implementation.
On analyzing the data management level wise it is observed there is lack of uniformity of goals across different management levels. There are differences observed in perceptions of personnel at different levels observed and this could be making lean manufacturing implementation difficult. For a smooth and successful lean manufacturing adoption it is important that whole organization is aligned to achieve common goals. This is not the case here. Due to
misalignment of goals and objectives personnel at different level is trying to achieve different objective which in turn hinders the effective implementation of many lean manufacturing techniques such as Kaizen, cross functional team etc.
Lack of communication and leadership are primarily responsible for the differences observed. The onus of keeping the organization aligned is that of top management and hence more efforts should be made to improve communication in the organization and also to lead the lean implementation from front.
Managerial Implications
Improvement in productivity, quality and profitability are perceived to be consequences of an manufacturing implementation in both the pump manufacturing industries chosen for study. However lack of understanding and Supply chain posed as obstacles barring organizations from achieving maximum benefits. Lack of understanding has to be addressed by proper training of employees before and during lean manufacturing implementation. Higher emphasis must be given towards improving supply chain management and supply chain goals. These should be aligned with those of lean production system. A synergy between supply chain and production system has to be achieved for deriving maximum benefits of lean manufacturing implementation. Both the companies have a similar view on barriers experienced except in case of Lack
of workers‘ support where plant 1 (which is
more than 50 years old) has a higher resistance than at plant 2 (recently established). In light of the above the workers of plant 1 should be further motivated towards the change.
Also it was Lack of Leadership, Lack of communication, company culture and past failure experience are contributors of Lack
of workers‘ support. Out of these, lack of
effects of company culture can be fairly minimized by a good understanding of lean manufacturing philosophy. So management must take employees of the company into confidence about lean manufacturing and its potential benefits.
7.
Future scope for work
The results of research work presented in this paper can be further strengthened by applying other analytical methods such as structural equation modeling, factor analysis, comparative factor analysis etc. The research
work can be extended to include other Indian pump manufacturing industries so that the outcomes can be said to be robust.
8.
Limitations of the project
The project is mainly based on primary data collected from employees of two companies. It is assumed that respondents have responded with due concerns and sincerity. Also data could be collected from two pump manufacturing units only. The present study therefore cannot be generalized to reflect the entire Indian scenario.
References:
Chaple, P.A., Narkhede, E.B., & Akarte, M.M. (2014). Status of implementation of Lean manufacturing principles in the context of Indian industry: A Literature Review. 5th International & 26th All India Manufacturing Technology, Design and Research Conference. IIT Guwahati, India, 567-1-567-7.
Achanga, P., Shehab, E., Ro, R. & Nelder, G. (2006). Critical success factors for lean implementation within SMEs, Journal of Manufacturing Technology Management, 17, 460-471.
Askin, R.G., & Goldberg. J.B. (2002). Design and Analysis of Lean Production Systems, John Wiley and Sons, New York, 352-406.
Ram, B., & Singh, A. (2007). Lean Manufacturing System: Building Blocks and Its Implementations, National Proceeding of Emerging Trends in Mechanical Engineering, Brox, J.A., & Fader, C. (2002). The set of just-in-time management strategies: an assessment
of their impact on plant-level productivity and input-factor substitutability using variable cost function estimates. International Journal of Production Research, 40(12), 2705–2720. Mopuru, C., Dilip, Y., Kumar., V., Sreenivasulu P., Rao, D. & Udaya Kiran, C. (2013),
Implementation of Lean Manufacturing System on Oil Pump. International Journal of Innovations in Engineering and Technology (IJIET), 2(1).
Dennis, P. (2007). Lean production simplified. New York: Productivity Press. Dixon, D. (2007). Lean in the job shop. Fabricating & Metalworking, 6(4), 16-19.
Emiliani, M.L. (2005). Leaders lost in transformation. Leadership & Organization Development Journal, 26(5), 370-387.
Forrester, P., Shimizu, U., Meier, H., Reyes, J., & Basso L. (2010). Lean Production, Market Share, and Value Creation in the Agricultural Machinery Sector in Brazil, Journal of Manufacturing Technology Management, 21(7), 853-871.
Rameez, H.M. & Inamdar, K.H. (2010). Areas of Lean Manufacturing for Productivity Improvement in a manufacturing Unit, World Academy of Science, Engineering and Technology,4(9), 890-893.
Khadse, B. Priti., Sarode. D. Avinash., & Renu, W. (2003). Lean Manufacturing in Indian Industries: A Review, International Journal of Latest Trends in Engineering and Technology (IJLTET), 3(1).
Kothari, R.C. (2004). Research Methodology. 2nd Edition New Age International Publishers, New Delhi, India.
Kumar, A. (2014). A quantitave study on the barriers of Lean Manufacturing Implementation : An Indian Context (Delhi NCR region). The International Journal of Engineering and Sciences, 2(4), 21-28.
Mahapatra, S.S., & Mohanty, R.S. (2007). Lean manufacturing in continuous prosess industry: An empirical industry, Journal of Scientific and Industrial Research, 66, 19-27.
Malhotra, N.K., & Dash, S. (2011). Marketing Research, An applied orientation, Pearson Prentice Hall, India.
Manish, B.B., & Darshak, A.D. (2014). The Perception & Methodology of Lean Manufacturing: A Review, International Journal of Engineering Development and Research, 2(1), 1151-1158. ISSN: 2321-9939.
Nenni, M., Giustiniano, L., & Pirolo, L. (2014). Improvement of Manufacturing Operations through a Lean Management Approach: A Case Study in the Pharmaceutical Industry. Int. J. Eng. Bus. Manag., 1. http://dx.doi.org/10.5772/59027
Lee. C.Y. (1996). The applicability of just-in-time manufacturing to small manufacturing firms: an analysis, International Journal of Management, 13(2), 249-258.
Polito, T., & Watson, Kevin. (2006). Just-in-Time Under Fire: The Five Major Constraints Upon JIT Practices, The Journal of American Academy of Business, Cambridge, 9(1). Ravikumar Marudhamuthu, Marimuthu Krishnaswamy, and Damodaran Moorthy Pillai (2011).
The Development and Implementation of Lean Manufacturing Techniques in Indian garment Industry, Jordan Journal of Mechanical and Industrial Engineering, 5(6), 527–532. ISSN 1995-6665.
Joshi, R.R., Patil, R., Naik, G.R. & Kharade, M.V. (2009). Through-Put Time Reduction by Lean Manufacturing, OSR Journal of Mechanical and Civil Engineering (IOSR-JMCE), 40-45. ISSN: 2278-1684.
Mahapatra. S.S., & Mohanty, R.S. (2007). Lean Manufacturing in continuous Process industry: An empirical, Journal of Scientific and Industrial Research, 66, 19–27.
Ade, M. & Deshpande, V.S. (2012). Lean Manufacturing and Productivity Improvement in Coal Mining Industry, International Journal of Engineering Research and Development, 2(10), 35-43. ISSN: 2278–800X.
Ramamoorthy, C., Selladurai, V., Venkatachalam, S., Amuthakkannan, R., & Muthusamy, P. (2008). Efficiency Enhancement of Centrifugal Monoblock Pump through Lean Manufacturing System using Kaizen Techniques. International Conference on Industrial Engineering and Operations Management.
Shah, R., & Ward, P.T. (2003). Lean manufacturing: context, practice bundles and performance, International Journal of Production, Journal of Operations Management, 21, 129-149.
Wisner, J.D., Leong, G.K., & Tan, K.C. (2005). Principles of Supply Chain Management: A Balanced Approach. Southwestern, United States.
Womack, J. (2007). The state of lean in 2007. Retrieved from: http://www.lean.org/ Accessed: 22/09/2014 at IST 14:15
Pratik Badgujar Shri G. S. Institute of Technology and Science, 23 Park Road
Indore, (Madhya Pradesh) India
Bachchan Kanungo Associate Manager-Manufacturing, Kirloskar Brothers Limited, Station Road
Dewas, (Madhya Pradesh) India
G.D. Thakar Shri G. S. Institute of Technology and Science, 23 Park Road
Indore, (Madhya Pradesh) India