Diana Margarida Pereira de Almeida
Licenciada em Ciências de Engenharia e Gestão IndustrialConstruction of Lean and Green indexes to
measure companies’
performance
Dissertação para obtenção do Grau de Mestre em Engenharia e Gestão Industrial
Júri:
Presidente: Doutor Rogério Salema Araújo Puga Leal,
Professor Auxiliar, Faculdade de Ciências e Tecnologia da Universidade Nova de Lisboa.
Arguente: Doutora Ana Paula Ferreira Barroso,
Professora Auxiliar, Faculdade de Ciências e Tecnologia da Universidade Nova de Lisboa.
Vogal: Doutora Helena Maria Lourenço Remígio,
Professora Auxiliar, Faculdade de Ciências e Tecnologia da Universidade Nova de Lisboa.
Setembro 2014
Orientadora: Helena Maria Lourenço Carvalho Remígio,
Professora Auxiliar, Faculdade de Ciências e Tecnologia
da Universidade Nova de Lisboa
Co-orientadora: Virgínia Helena Arimateia de Campos Machado,
Construction of Lean and Green indexes to measure companies’ performance
Diana de Almeida
Diana Margarida Pereira de Almeida
Licenciada em Ciências de Engenharia e Gestão Industrial
Construction of Lean and Green indexes to
measure companies’ performance
Dissertação para obtenção do Grau de Mestre em Engenharia e Gestão Industrial
Júri:
Presidente: Doutor Rogério Salema Araújo Puga Leal,
Professor Auxiliar, Faculdade de Ciências e Tecnologia da Universidade Nova de Lisboa.
Arguente: Doutora Ana Paula Ferreira Barroso,
Professora Auxiliar, Faculdade de Ciências e Tecnologia da Universidade Nova de Lisboa.
Vogal: Doutora Helena Maria Lourenço Remígio,
Professora Auxiliar, Faculdade de Ciências e Tecnologia da Universidade Nova de Lisboa.
Setembro 2014
Orientadora: Helena Maria Lourenço Carvalho Remígio,
Professora Auxiliar, Faculdade de Ciências e Tecnologia
da Universidade Nova de Lisboa
Co-orientadora: Virgínia Helena Arimateia de Campos Machado,
Construction of Lean and Green indexes to measure companies’
performance
Copyright © Diana Margarida Pereira de Almeida, Faculdade de Ciências e Tecnologia, Universidade Nova de Lisboa.
i
Acknowledgments
I want to express my sincere gratitude to Professor Helena Carvalho and Professor Virgínia Machado by the orientation in this dissertation. I appreciate all the availability and encouragement during the dissertation.
A special thank to my family, particularly my parents for their effort to provide me this opportunity to get here and my sister who always believed in me and encouraged me to go further.
iii
Resumo
A procura pela redução dos custos e tempo despendidos nos processos com vista ao aumento da eficiência, leva as empresas a procurarem paradigmas de gestão inovadores que sustentem as suas necessidades de crescimento e melhoria contínua. O paradigma Lean tem grande relevo nesta necessidade de redução de desperdícios nas empresas, em especial nas empresas de manufatura.
Por outro lado, as preocupações das empresas em reduzir o desperdício têm vindo a ganhar uma nova vertente não só material, mas também a nível ambiental com a introdução do paradigma Green. Como tal, têm vindo a ser adotadas práticas nas empresas de manufatura que visam reduzir o impacto das suas atividades sobre o meio ambiente.
Apesar de muitas empresas de manufatura já implementarem práticas de redução de desperdícios que visam a aplicação dos paradigmas Lean e Green, muitas delas não conseguem entender concretamente se os seus esforços são suficientes para que a aplicação dessas práticas seja bem sucedida, ou mesmo se a sua real performance na implementação dessas práticas reflete a avaliação que têm de si próprias.
Desta forma, a presente dissertação tem como principal objetivo, para além da análise do desenvolvimento dos paradigmas Lean e Green ao longo dos anos, a construção de dois índices (o Lean Index e o Green Index), permitindo a medição de performance das empresas de manufatura Portuguesas no que diz respeito à implementação de práticas Lean e Green.
Os dados utilizados para a criação dos índices Lean e Green são relativos à implementação do European Manufacturing 2012 em Portugal. As questões do inquérito relacionadas com a implementação de práticas Lean e Green representam as variáveis no modelo de construção dos índices. Para a construção das expressões representativas dos índices Lean e Green foi aplicada a Análise Fatorial para atribuição de ponderações e agregação das variáveis.
v
Abstract
The demand for costs and time reductions in companies’ processes, in order to increase efficiency, leads companies to seek innovative management paradigms to support their needs for growth and continuous improvement. The Lean paradigm has great relevance in companies’
need for waste reduction, particularly in manufacturing companies.
On the other hand the demand of companies for waste reduction has gained a new dimension not only at the material level, but also at the environmental level with the introduction of the Green paradigm. As such, manufacturing companies have been adopting practices that reduce the impact of their activities on the environment.
Although nowadays many manufacturing companies already implement waste reduction practices related to Lean and Green paradigms, many of them are unable to understand specifically if their efforts are enough for the application of these practices to be successful or even if their actual performance in implementing Lean or Green practices reflects the self-assessment that they have of themselves.
Thus, besides the study of the development of Lean and Green paradigms in recent years, the present dissertation has the important objective of the construction of two indexes (the Lean Index and the Green Index) enabling the measurement of the performance of Portuguese manufacturing companies relating the implementation of Lean and Green practices.
The data used to create the Lean and Green indexes where obtained from the implementation of the European Manufacturing Survey 2012 in Portugal. The survey questions related to the implementation of Lean and Green practices are used as variables in the development of the model for the two indexes. For the construction of representative expressions of Lean Index and Green Index it was applied the Factorial Analysis for assigning the variables weights and aggregation.
vii
Contents
1 Introduction ... 1
1.1 Context ... 1
1.2 Objective ... 2
1.3 Methodology ... 2
1.4 Contents ... 3
2 Background ... 5
2.1 Manufacturing management paradigms ... 5
2.1.1 Lean paradigm ... 7
2.1.2 Green paradigm...16
2.2 Implementation of Lean and Green practices in manufacturing companies and measurement of their performance ...22
2.3 Green and Lean indexes in manufacturing companies ...23
2.4 Conclusions ...27
3 Composite index construction methodology ...29
3.1 Composite index ...29
3.2 Indexes construction methodology ...30
3.2.1 Using Factor Analysis to construct indexes ...32
3.3 Conclusions ...37
4 Development of a Lean and Green index ...39
4.1 The EMS survey ...39
4.2 Sample characterization ...39
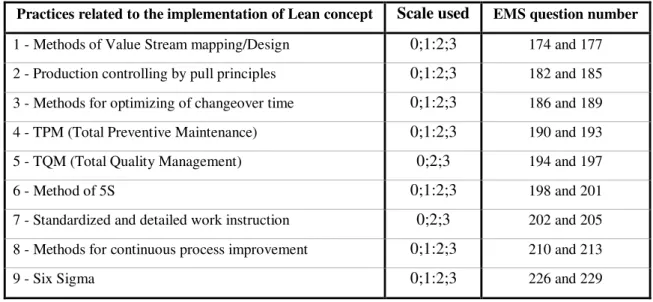
4.3 Selection of the Lean and Green practices under analysis ...41
4.4 Output - Lean Data Analysis ...43
4.5 Output - Green Data Analysis...49
4.6 Indexes development ...54
4.6.1 Lean Index ...54
viii
4.7 Application of the Lean and Green indexes to the inquired companies ...56
4.8 Conclusions ...58
5 Conclusions ...59
5.1 Overview and discussion ...59
References ...61
Appendix A - Data analysis through Statistical Package for the Social Sciences ...67
Appendix B – Excerpt from the European Manufacturing survey applied to Portuguese manufacturing companies ...71
ix
List of figures
Figure 2.1 - The Lean Manufacturing system ...11
Figure 4.1 - Scree plot. Lean variables ...45
Figure 4.2 - Rotated component plot. Lean Variables ...48
Figure 4.3 - Scree plot. Green variables ...51
Figure 4.4 - Lean Index application. Distribution of companies by class ...57
xi
List of tables
Table 3.1 – Advantages and disadvantages of Composite Indicators ...30
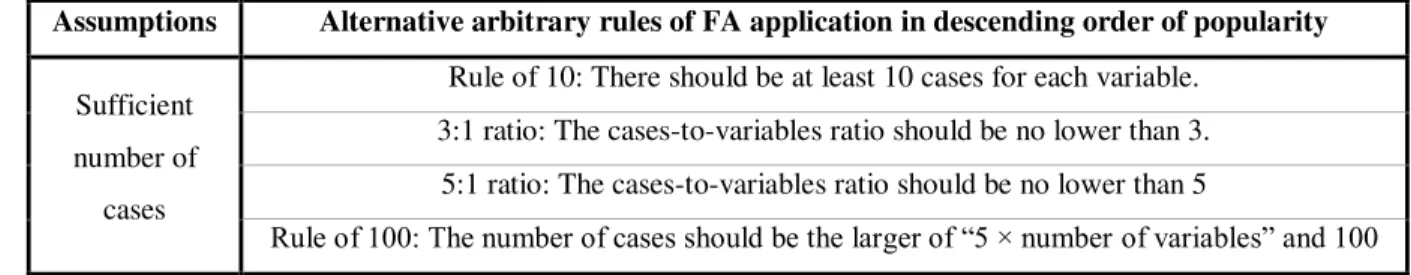
Table 3.2 - Assumptions in Factor Analysis ...33
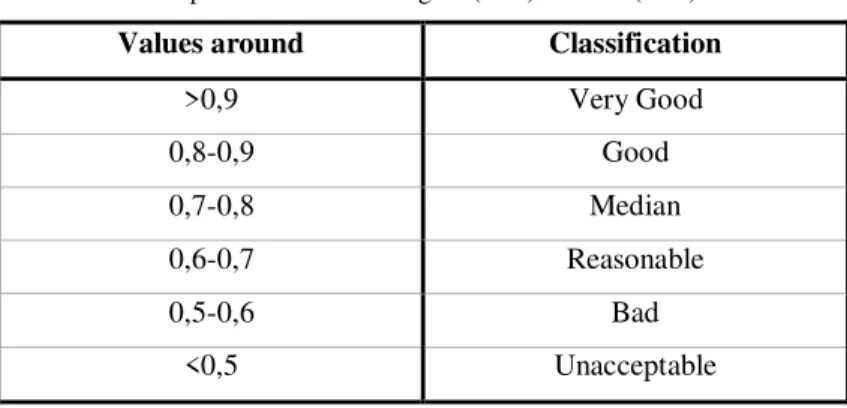
Table 3.3 - Classification for Kaiser - Meyer – Olkin Measure values ...35
Table 4.1- Percentage of companies by number of employees ...40
Table 4.2 - Percentage of companies by 2011 turnover. ...40
Table 4.3 - Lean Practices ...41
Table 4.4 - Green Practices ...41
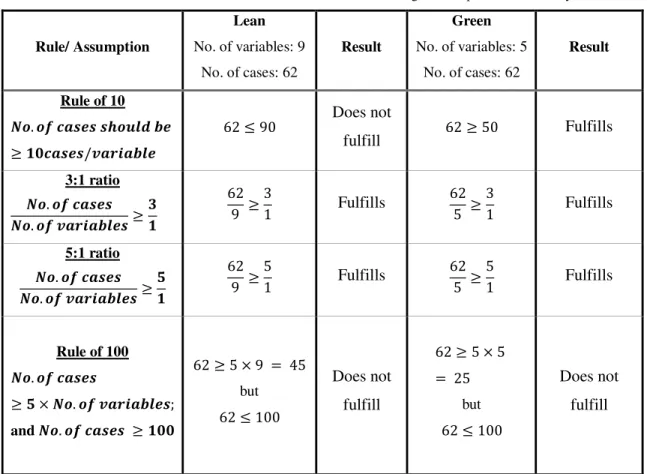
Table 4.5- Verification of the existence of a sufficient number of cases using the assumptions in Factor Analysis ...42
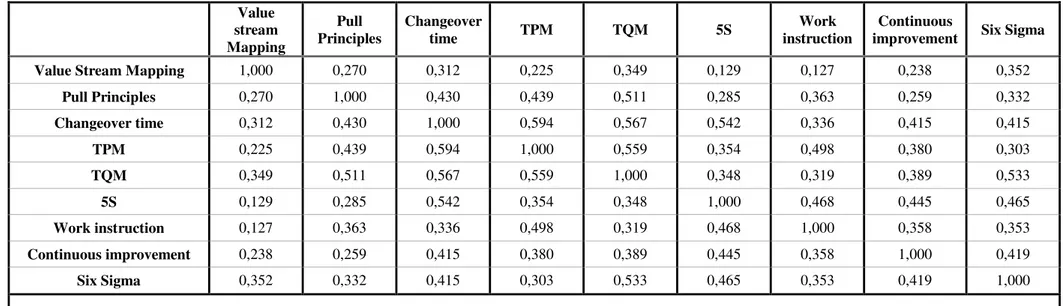
Table 4.6- Lean Correlation Matrix ...44
Table 4.7 - Kaiser - Meyer – Olkin and Bartlett's tests results for Lean data ...44
Table 4.8 - Total Variance Explained. Lean variables ...45
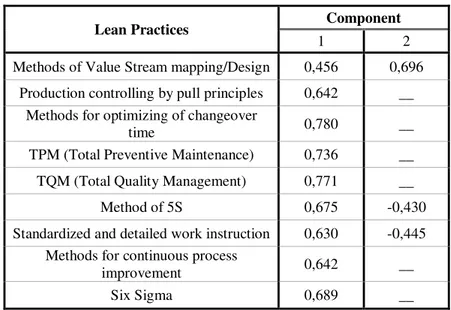
Table 4.9 - Component Matrix. Lean variables ...46
Table 4.10 - Rotated Component Matrix. Lean variables ...46
Table 4.11 – Components Score Coefficients. Lean variables...48
Table 4.12 – Lean variable score designation ...49
Table 4.13 - Green Correlation Matrix ...49
Table 4.14 - Kaiser - Meyer – Olkin and Bartlett's tests results for Green data ...50
Table 4.15 - Total Variance Explained. Green variables ...50
Table 4.16 - Component Matrix. Green variables ...52
Table 4.17 - Rotated Component Matrix. Green variables ...52
Table 4.18 - Component Score Coefficient Matrix. Green variables ...53
Table 4.19 - Green variable score designation...53
Table 4.20 - Maximum value for Lean Score ...55
Table 4.21 – Maximum value for Green Score...56
xiii
List of abbreviations and symbols
AHP - Analytical Hierarchy Process ASC - Agile Supply chains
(Bx)j - company j behaviour related to the paradigm x (x = G or x = R).
(Bx)j - company j behavior according to the paradigm x (x = G or R).
EMS – European Manufacturing Survey ENMs - Energy Management System EPE - Environmental performance evaluation FA - Factorial Analysis
FASCI - fuzzy ASC index GI - Green Index
GL - Green Logistics
GLPI - Green Logistics Performance Index HEA - Home electronic appliance
ISI - Fraunhofer Institute for Systems and Innovatio ISO - International Organization for Standardization JIT - Just-in-Time
KMO - Kaiser - Meyer - Olkin measure of sampling adequacy LI - Lean Index
PCA - Principal Component Analysis
(Pxi)j - Implementation of practice i level according to the paradigm x for company j
Rj - Average fuzzy ratings
S - Total Score Performance
SG - Green variables total score
SG (Max) - Maximum value that each Green variable total score can take
SG (Min) - Minimum value that each Green variable total score can take
SGmax - Maximum value that SG can take
SGmin - Minimum value that SG can take
Sig - Significance value (Bartlet’s test) SL - Lean variables total score
SL (Max) - Maximum value that each Lean variable total score can take
SL (Min) - Minimum value that each Lean variable total score can take
SLmax - Maximum value that SL can take
SLmin - Minimum value that SL can take
xiv
SMED - Single Minute Exchange of Die
Smin - Minimum value that S can take
SPSS - Statistical Package for Social Sciences TPM - Total Preventive Maintenance
TQM - Total Quality Management
UNIDEMI - Unit of Mechanical and Industrial Engineering VSM - Value Stream Mapping
wG - Weight of resilient paradigm
WIP - Work in progress
Wj- Average performance weights
wR - Weight of green paradigm
1
1
Introduction
This chapter aims to provide an introduction to this dissertation. Here are discussed the research context, motivation, objectives and research questions. It is also included in this chapter a brief description of the research methodology used, concluding with a description of the dissertation structure.
1.1
Context
Nowadays, the markets are in constantly change, which leads to an increased competitiveness. Thus it arises the need for companies to adopt a policy of continuous improvement at all levels, such as processes, strategies to adopt or organizational level. It becomes essential achieving a high level of excellence, allowing opportunities for improvement and growth to render organizations more competitive. The adoption of Lean and Green strategies is crucial for the
companies’ development.
Management paradigms as Lean and Green have been adopted in companies worldwide, particularly in manufacturing companies (Azevedo et al., 2012a). Regarding to the Lean paradigm in manufacturing, it can be said that this concept stipulates the attainment of continuous improvement of the wastes elimination (Devadasan et al., 2012). Companies also have recognized the Green paradigm as a way to achieve a more efficient management. The Green management approach, is characterized for having the ability to induce the reduction of
companies’ costs through more efficient use of resources such as water, energy or raw materials (Azevedo et al., 2012a). Measuring the impact of the implementation of Green practices in companies is a way of companies perceive the environmental impact of their activities through the analysis of their degree of implementation of the underlying strategies.
2
1.2
Objective
Despite the existing extensive research on Lean and Green management paradigms, studies in this area have not developed issues related to the measurement and assessment of companies’
performance regarding the degree of implementation of representative practices related to Lean and Green paradigms implementation.
The focus of this dissertation relies on the analysis of Lean and Green practices adoption in the context of Portuguese manufacturing companies. The main objective of this dissertation is the creation of two indexes (the Lean Index and the Green Index). These two indexes are design to measure the Portuguese manufacturing companies performance in the implementation of practices related to Lean and Green paradigms.
The obtained indexes will be applied to real cases to illustrate the index application and obtain a representative result of the degree of implementation of Lean and Green practices in those companies.
1.3
Methodology
The methodology used in this research comprises two main phases. The first phase consists on the literature review related to Lean and Green paradigms. In this phase are presented the foundations for understanding the Lean and Green paradigms. Through the study of the literature, it is possible to identify the benefits of implementing these paradigms as well as their evolution over the years, with special attention to its application in the context of manufacturing companies.
3
1.4
Contents
The structure of this dissertation is divided on five chapters and two appendices. This chapter provides a global view of this dissertation, focusing on the proposed objectives and justification of the chosen theme. This dissertation presents research about the application of Lean and Green concepts in manufacturing companies, focusing on the creation of a method that allows measuring the performance of companies in the implementation of these concepts. The methodology to achieve this goal comprises a bibliographical research phase and a second phase characterized by the analysis of the available data and indexes construction. This methodology is developed over the next chapters.
In Chapter 2 are addressed issues related to Lean and Green paradigms, their application in manufacturing companies as well as its effects on their performance. The chapter contains a literature review of these issues and it concludes with the proposal of Lean and Green practices to consider as variables in the Lean and Green indexes proposed in this dissertation.
In the third chapter is presented information that supports the creation of the basis of the indexes. In this chapter is also described the Factor Analysis, a statistical technique that supports and guides the researcher in the construction of new indexes. Conditions of applicability of this technique are also reviewed on this chapter.
Chapter 4 is the one that presents greater prominence in this dissertation; it presents the development and construction of Lean and Green indexes through the application of Factor Analysis. It is also given to known, the source and characterization of the data used for this purpose. Also it is described a practical application of indexes created using the data used in their own building. The results for each company considered are presented, thus producing a score that characterizes their performance concerning the implementation of Lean and Green practices.
5
2
Background
2.1
Manufacturing management paradigms
The manufacturing management paradigms have been widely studied over the last decades by several authors. The models or paradigms are considered typical examples of something that has been used throughout history, as a manufacturing aid in the task of managing the production (Filho & Fernandes, 2009). O’Brien (2013) described the successive changes about manufacturing paradigms over the last 50 years. The author highlighted not only changes at the level of thoughts about manufacturing concepts, but also the consequent change in its associated paradigms, that have been performing changes in business productivity, as well as the quality of its goods and services. According to the author, these changes had their major boost with the first publication of The International Journal of Production Research in 1961. In the literature on Manufacturing Management are discussed many paradigms (Filho & Fernandes, 2009), that with the application of practices related to them, have the common goal to help companies to support, maintain and improve their competitiveness in today's globalized markets. Some authors have been exploring and developing new paradigms associated with Manufacturing, wishing to distinguish themselves from those who have been gaining importance and recognition in recent decades.
Among the traditional paradigms mentioned in various papers concerning the paradigms associated with the manufacturing, stand out Lean Manufacturing, Agile Manufacturing, Mass Customization Manufacturing (Filho & Fernandes, 2009; Zhen, 2012), but also the Flexible Manufacturing, Computer-Integrated Manufacturing, Just-in-Time Manufacturing, Green Manufacturing, Virtual, Marketing-Manufacturing Integration and Re-Manufacturing (Zhen, 2012). Filho & Fernandes (2009) consider that the introduction of these manufacturing concepts is due to Henry Ford with the application of Mass Manufacturing, created at the beginning of the 20th Century, followed by the creation of the Lean Manufacturing paradigm, that started in Japan and is associated with the Toyota Production System (Hajmohammad et al., 2013). Despite Lean Manufacturing started to emerge in the mid fifties, it was only consolidated in the 1970s (Filho & Fernandes, 2009). Other manufacturing paradigms and practices had its development in the following years.
6
approaches regarding these concerns were adopted. Although the connotation with traditional paradigms such as Lean and its focus on reduction of waste, these new approaches regarding the reduction of time, energy or money, elevate the concept of waste reduction to a level that combines this subject with the concern of the effects of activities on the environment. Although organizations often adopt ecological practices with the obligation to meet the requirements of legislation, (Azevedo et al., 2013) its environmental performance can also lead to competitive advantage.
Pampanelli et al. (2013) states that the introduction of Green practices in companies has no longer been an optional decision in their management strategies. Increasingly management policies in manufacturing companies take into account the implementation of Lean and Green practices. In recent studies, the relationships between Lean Manufacturing practices and environmental management practices has been studied, as well as, their influence on business results and companies performance (Yang et al., 2011). Some researchs has been developed suggesting that management practices based on Lean paradigm and consequently its influence in supply management, can be decisive regarding the environmental performance of the company and can be regarded as resources that ease the adoption of environmental practices (Hajmohammad et al., 2013).
Nowadays, companies have been suffering an increasing pressure to integrate the models of sustainable development (Hajmohammad et al., 2013). With the development of know-how and production capabilities, companies have been able to implement practices that make them achieve cleaner production, with constant research and development of theories in this area. Several studies have been studying the relationship between production and environmentally conscious practices in order to improve productivity and performance of manufacturing (Florida, 1996).
With the introduction and popularization of the manufacturing practices that are based on the concept of waste reduction, companies were, over the past few years, forced to compete with each other based on the increased levels of quality, flexibility and timeliness (Kennedy & Widener, 2008). In order to achieve these goals, there have been changes in companies’
7
2.1.1
Lean paradigm
From designing the assembly line and consequent development of the Toyota Production System, the efficiency has been a major goal of the manufacturing companies. The Lean Manufacturing paradigm focuses on the systematic disposal of companies’ operations through a set of practices of cooperative work, fulfilling the purpose of producing goods and services to demand rate (Yang et al., 2011).
Companies working with the Lean paradigm uses much less resources compared to those that still operate as mass producers. Feld (2001) refers to this approach in a highly intuitive way, indicating that the Lean Production vs Mass Production presents a ratio which translates to:
“½ the human effort in the factory, ½ the manufacturing space, ½ the investment tools, ½ the engineering hours and ½ the time to develop new products”
The application of Lean paradigm in business reflects the demand for increasing value added
activities, by waste reduction to maintaining profitability and satisfying customer’s needs. The Lean Manufacturing paradigm can be explained briefly as a set of practices applied to manufacturing operations of the company, aimed at reducing waste and non-value added activities (Yang et al., 2011). Lean Manufacturing is a multifaceted concept, which can be subdivided into other practices such as, among others, Just-in-Time (JIT), Total Quality Management (TQM), Total Preventive Maintenance (TPM), Human Resource Management, Pull or Productive Maintenance (Yang et al., 2011). Furthermore, the parameters for assessing the Lean level in a company, should not only cover the internal concerns of the company as investment priorities or the Lean practices and waste, but also consider issues related to their suppliers and customers (Azevedo et al., 2012a).
8
are related to environmental sustainability. According Martínez-Jurado & Moyano-Fuentes (2013) besides its quest for improved results, the companies implementing Lean Management, they also aspire to be seen as leaders and managers aware of the impact of their activities.
It is vital for the success and continuing implementation of Lean Management practices that they are not applied only to intra-organizational aspects, but are also disseminated to the supply chain. In this area, a major challenge for companies that drive Lean practices is to lead the increasing integration and involvement of key suppliers and customers. So it is interesting to analyze the application of Lean Management practices focusing not only the company but also its supply chain (Martínez-Jurado & Moyano-Fuentes, 2013).
The implementation of Lean practices is often considered the most important way to manufacturing companies achieve high performance, largely because it is a complete business system that combines a large number of management practices like work teams, cellular manufacturing, supplier management, among others. In this way, the Lean strategy quickly became a dominant paradigm in the context of manufacture (Vinodh & Joy., 2012). However, despite the Lean paradigm has been studied by several authors as Lewis (2000) or Hines et al. (2004), the Lean’s definition still generates some disagreement and confusion mainly on the choice of the features that should be associated with the concept (Pettersen, 2009). These disagreements can lead to difficulties in assessing the effectiveness of the implementation of the concept itself in companies. As such, in recent years there are several authors who have published literature in which the central theme is the Lean Manufacturing applied in the context of individual companies (Shah & Ward, 2003). In these studies it is possible to identify some practices that are usually associated with Lean Manufacturing.
9
The nuclear issue of Lean Manufacturing is that every integral practices can work together, synergistically, creating a system. This system is then able to produce finished products to customer and fulfilling the demand with little, or sometimes, with no waste (Shah & Ward, 2003). Thus, Lean Manufacturing is then defined as a business system that integrates necessarily more than just production processes.
For a successfully implementation of Lean practices in manufacturing companies, it is critical that companies have a high level of flexibility, responding quickly to customer needs and adopting a strategy of market differentiation quite distinct from the traditional strategy, which relies more on cost leadership.
Feld (2001) states that Lean Manufacturing is based on five key elements:
1. Manufacturing Flow, that is the aspect that deals with the design standards and the physical changes that are deployed;
2. Organization, which focuses on the identification of people’s functions, training in new ways of working and communicating;
3. Process control, is the aspect directed to monitoring, control, stabilization, always looking for new ways to improve the process.
4. Metrics, that addresses the visible part of the look and the results of performance measures; focusing on improving; and useful too in team rewards and recognition
5. Logistics: Which defines the operational rules, mechanisms for planning and control of material flows.
10
According to Feld (2001) the lack of interest in admitting the system as a whole, is still a retrograde thinking because the change in organizational culture and improvements in logistics infrastructures lead to the institutionalization of the improvements, providing a sustained change within the organization. When a company initiatives focus only on the mechanics and techniques (which are indicators of the manufacturing flow and process control), the ability of the workforce is not being improved. Nowadays it is easy to find in companies, someone who is able to read and perform number analysis about the behavior of demand, calculate takt time, or for example apply a more efficient layout. However, these are practices and methods that have been used over many years of industry development, which may indicate that the continuing use of the same actions and working methods without any level of evolution or development will not bring to the company competitive advantages that allow them to stand out from their competitors. The real competitive advantage is built through stimulation of skills in the workforce, which can only be achieved through the merger of three principles:
1. Achieve a transfer of knowledge through building a skilled workforce;
2. Involvement of all employees within the company, driving the collective energy in the same direction;
3. Provide expectations and common goals for the workforce and accountability to get the job done.
The advantage for a company that has this capability is the impossibility of it being copied, lost or acquired by competition.
2.1.1.1
The Lean Manufacturing system structure
Other authors have been addressing this issue of Lean Manufacturing. For example, Dennis (2007), relates that before we understand the Lean paradigm, it is necessary to understand the system that it is supplanting, i.e. the mass production. The mass production was first implemented by Henry Ford. This concept refers to the process of creating a large number of similar products efficiently, i.e. the production in large quantities of standardized products frequently by using the technology of the assembly line.
11
effort, machinery and materials, not forgetting the importance of meeting customer requirements.
The Lean system was designed by Taiichi Ohno (Dennis, 2007), but other personalities were giving their contribution to extend and deepen the concept such as Hiroyuki Hirano with the development of 5S system; Seiichi Sekine through the concept of TPM; Kenichi Sekine with Continuous Flow; Shingro Shingo developing Jidoka and SMED. However, the consolidation of the overall concept was only possible with an integration of all others. Dennis (2007) used a
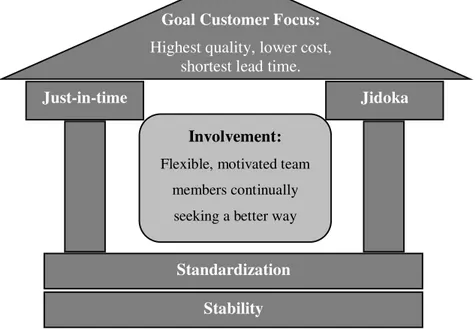
“Lean house” as an analogy to illustrate this integration between Lean Manufacturing and its related practices (Figure 2.1). This house demonstrates the structure that supports the Lean Manufacturing concept, from its base, its structural walls, reaching its objectives, represented symbolically by the roof. In the structure, the walls of the house, are the JIT delivery of parts of products and the Jidoka also known as automation with a human mind. The last module of the Lean house, the roof, is related to customer focus, which means delivering to the customer high quality products at the lowest possible cost and following a short lead time. In addition to the surrounding structure, Dennis (2007) also established that the heart of the whole system is the Involvement, or "flexible motivated members continually seeking a better way."
Figure 2.1 - The Lean Manufacturing system Adapted from Dennis (2007)
2.1.1.2
Lean Manufacturing system basis
Stability and standardization are the basis of Lean System Construction. Dennis (2007) refers that there is no improvement without stabilize the 4M's, i.e., stabilize Man/woman, Machine,
Stability Standardization
Just-in-time Jidoka
Involvement: Flexible, motivated team
members continually seeking a better way
Goal Customer Focus:
12
Materials and the Method. The stability is closely tied to the 5S system. The 5S supports practices such as TPM and standardized work practices that are essential to the stability of the process and machines, and also supports the application of the concept JIT, by providing information that assists in making decision.
The 5S system is a concept related to the development of a clean, well-ordered workplace and comprises the following notions (Dennis, 2007):
- Sort out what isn’t necessary (for example parts, work in progress, scrap, storage shelves, documents). While some of these materials are essential to achieve the objective of the job, others are not, sometimes preventing the flow of work, and may cause some problems and contributing to the increase in long lead times.
- Set in order the remaining materials, minimizing the waste motion
- Shine (and inspect).It is important to establish methods of cleaning to achieve the goals. The 5S workplace should be equipped with cleaning materials and it is important to do some of the work the 5S minutes of cleaning. This item also includes the inspection, which translates into the ability of the worker to recognize changes in the equipment through the knowledge it acquires to accomplish its regular state and condition inspections.
- Sustain the 5S practices developed. It is important to create a solid foundation in business practices for the implementation of 5S, viewing them as the natural method of operating through involvement of all team members. This involvement of the entire company to accept and contribute to the continuity of the 5S system is only possible through the promotion of new ideas, communication and training.
-Standardize the work. It is important because it provides to the employee information about how to perform the tasks correctly. Include for example information about the type of tools to use which perform tasks (when and by whom). According Dennis (2007), standardized work is one of the safest, easiest and most effective ways of doing the job.
The concept of Standardization has been generating great benefits in manufacturing such as:
13
2. Clear stop and start points for each process, giving the possibility of seeing the production status in a flash.
3. Organizational learning. Standardized work enables the preservation of know-how and expertise. In the case of an experienced worker leaves the company, their experience will not disappear.
4. Audit and problem solving. Standardized work provides access to the current status of the production system, easing the identification of problems by tracking vital checkpoints and process steps.
5. Employee Involvement and Poka-Yoke. The standardized work are developed by cooperation of various elements of the company that go from the system team members up to supervisors and engineers, identifying new simple, inexpensive, error-proofing opportunities or Poka-Yoke devices. The Poka-Yoke method represents the defects and errors prevention originating in the mistake (Szewieczek, 2009). This is a technique to prevent human error at work, applied through the installation of devices that either prevent or detect potentially anomalies, both for the quality of the product and for the health and safety of workers. These error prevention devices can be of three types: physical, by blocking the flow of mass, energy or information, not depending on users’
interpretation (e.g. a wall); it may be functional if they might be turned off due to an event (e.g. a lock or password); and finally they can be symbolic if they require interpretation (e.g. a safety sign) (Saurin et al., 2012).
6. Kaizen, which is the continuous improvement of a complete value stream or an individual process in order to generate even more value with less waste. This continuous improvement effort is executed by all company members and focuses mainly as Lean own in waste reduction (Augusto et al, 2006).
14
TPM is a natural consequence of the 5S system. According to Roberts (1997), TPM is a concept of maintenance schedule. TPM has its focus on maintenance, which translates into a necessary and vitally important part of business. Currently the TPM are no longer considered as non-profit activities since downtime for maintenance are part of the production day, and in some cases is an integral part of the manufacturing process. This reflects the need to train workers to ensure proper operation and safety in the equipment use, providing changes in the employees’ mindsets regarding their job responsibilities, always aiming zero breakdowns (Roberts (1997); Dennis (2007)).
2.1.1.3
Lean Manufacturing system walls
Returning now to the structure of Lean aforementioned, it is important to focus on one of its main pillars, JIT. According to Dennis (2007) JIT means producing the right item at the right time, in right quantity. Toyota was a pioneer in the introduction of this concept in 1950, when trying to answer very specific problems such as tough competition, the problem of low volume, contrasting with the highest diversity of products demanded by fragmented markets, constant changes in technologies, high costs of capital or the issue of capable work demanding higher levels of involvement (Dennis, 2007). The author states that this principle is based on certain rules:
1. Produce just what the customer ordered;
2. Placement of demand for that work can progress smoothly by the plant;
3. Link all processes to customer demand using simple visual tools (Kanbans)
4. Maximize the people and machinery flexibility.
According Dennis (2007) JIT system is based on two components:
15
2. The level of output (or Heijunka), which supports kaizen, standardized work, in order to maintain the production rate without peaks or downs, allowing easy adaptation to oscillations in demand.
In turn, Kanban and Heijunka application dependent on other factors, namely (i) quick machine changeover, that allows a quick response to daily customer orders; (ii) visual management through the implementation of the 5S system; (iii) capable processes (means capable workers, methods and machines).
Unlike conventional mass manufacturers, that push the product through the system, not taking into account the current demand for the application of the rules governing the JIT, it is necessary to take the opposite approach, this is pull. Pull means that nobody upstream should produce the goods or service until the customer downstream asks for it (Dennis, 2007), bringing a big advantage at the level of reduction of parts stores. According to Powell et al. (2013) the Pull associated with manufacture is one of the most important principles Lean paradigm, in which tasks are being "pulled" by successive workstations as are required, and any workstation located upstream should not be produce/accomplish tasks before the downstream station asks for it. Pull system has the ability to control the work in progress (WIP), achieving large reductions in cycle time level. It is also useful in reducing operating costs by, for example, eliminating the need to order or generate large amounts of raw materials, WIP and finished goods or reducing excessive inventory. According to Dennis (2007) Pull system is also a way of achieving improvements in quality levels by not allowing defects production in large batches, being easier to detect those in which there are such abnormalities. The author states that Pull system may also be advantageous in terms of health and safety of workers. In relation to health, for example, there may be improvements at ergonomic level, by reducing the size and number of part bins, so there is less heavy lifts, and for example, a reduction in the number of trucks forklifts, which generates an improvement of safety level.
As previously mentioned, the JIT is an extensive subject, comprising other numerous concepts. Dennis (2007) described that beyond its great purpose of production of certain components, in the right quantity at the right time, the JIT is intervening in the production leveling and includes kanban methodologies, taking into account the concept of Pull systems. All these practices are useful not only in production but also in another relevant aspect regarding the Leans’
16
allows the identification of improvement opportunities (kaizen) as well as the current condition of the system.
Jidoka is the other pillar of the Lean system. This was nicknamed by Toyota as "automation with a human mind" (Dennis, 2007), implying as its name indicates, the intelligence of workers allied to errors identification by machines. This concept provides to the operator or to the machine, autonomy to be able to stop the process when an abnormality is detected. The main idea is to prevent the generation and propagation of defects, eliminating any anomalies in processing and production flow. Stopping the process, either by the operator or the machine, the problem is visible to all the workers or supervisors, triggering a concerted effort to identify the root cause, eliminating it and preventing the recurrence of the problem by reducing the likelihood of further stops.
2.1.1.4
Lean Manufacturing system core
To be able to build a Lean production system, it is essential to take into account that the structure should have a strong organizational core. The core of the Lean system described by Dennis (2007) presented with house-shaped structure, is based on the Involvement of team members. With the Involvement is possible to develop the capabilities of team members, improving the company prospect for long-term success. Supervisors and managers have an important role in its implementation, must underpin and support the development and participation of all workers, this concept should be managed as production and quality usually has been managed (Dennis, 2007).
2.1.2
Green paradigm
17
reduction. Green Manufacturing can be effective in achieving this goal, through money saved by doing recycling and waste reduction.
Although currently the benefits achieved with the implementation of Green Manufacturing practices are already quite widespread, there are still companies who are unaware of these potential benefits of using it. It is noteworthy that, in addition to the general benefits already detailed, others more practical and direct advantages can be listed as resulting from the application of Green practices such as lower waste-disposal and training costs, or fewer environmental licensing and reduced material costs (Asefeso, 2013).
The evolution of the production systems allow an increase in the know-how and in the capability of companies to develop their production through a cleaner method, becoming important to continue the studies about the potential to improve environmental performance, as well as focus the activities that affects the companies’ environmental externalities. Green Manufacturing is an important part of business (Dornfeld et al., 2013). Nowadays, companies are finding there are multiple benefits of using Green Manufacturing being increasingly aware that the implementation of this concept is based on reasons that go beyond the simple commitment to be environmentally friendly (Asefeso, 2013).
To define what represents the Green Manufacturing it is interesting to understand what refers the Green concept. According to Dornfeld et al. (2013) Green is defined as a concern with environmentalism, caring for the preservation of environmental quality and, as such, the approach to issues such as recycling or the ability of the materials used being biodegradable and non-polluting. However, this concept alone does not say much in the specific context of industrial activities. The application of this concept to manufacture results on the concept of Green Manufacturing characterized as a process or system which has a minimal or nonexistent negative impact on the environment.
18
Manufacturing. Moreover, over the years it has been possible to watch the increasing awareness about environmental risks, as well as the focus on competitiveness based on the efficiency of production systems.
Green Manufacturing is a new paradigm of manufacturing and as such, covers a group of strategies or techniques integrated in management (related to the environment), working together to achieve certain goals (Deif, 2011). Green Manufacturing paradigm is no longer just a trend in manufacturing, and over the years it becomes one of its key pillars. Asefeso (2013) states that companies that have been adopting the Green Manufacturing paradigm present high quality products. Thus they are confirming that Green Manufacturing is a management decision that contributes to the companies’ success in today's competitive markets.
The Green Manufacturing is regarded as a management policy in a company, especially with the emergence of problems related to large energy expenditure (Asefeso, 2013). By applying small changes, the overall operation of the company can become more environmental friendly. Some of these small changes are based on the appliance of concepts related to Green Manufacturing including (Asefeso, 2013):
The use of raw ingredients “which can and does include organic ingredients if pricing is reasonable as much as possible if the finished product is biodegradable”.
“Does not use hazardous chemical conditioners, chemical anti-bacterial or chemical preservatives if any of the products that might end up in waste system (landfills) or in the environment.”
Provide a cleaner source of energy through new technology. “This will decrease energy consumption.”
Conversion of pollutants and wastes into by products and promotion of their use.
Use of process improvements to maximize the yeld and the minimization of produced waste.
19
Green manufacturing concept employs various Green strategies (objectives and principles) and techniques (innovations and technologies), in order to a company more ecologically and environmentally efficient. Some examples of these applications are production with lower consumption of materials and energy, or the replacement of raw materials for products more environmentally friendly (non-toxic and recyclable products for example) (Deif, 2011).
According Li et al. (2013) as Manufacturing activities represent a significant share of total energy expenditure, the Green Manufacturing plays a key role in reducing atmospheric emissions. By trying to minimize the impact of greenhouse gases, the reduction in consumption of energy and natural resources, the Green Manufacturing enhances not only the rapid growth of renewable energy and clean technology in the industrial sector, but also assumes a beneficial role not only at the economical level but also at the social level (Li et al., 2013).
The Green Manufacturing concept did not come alone. With the spread of the set of practices associated with Lean paradigm, it was natural that the emergence of this concept, such as Lean, aims to minimize waste but at the environmental sphere. Darmawan et al. (2014) claim that there is a close connection between these two concepts, indicating that the application of Green methodologies to a production system helps it to become a Lean system. While Lean Manufacturing practices focus on preserving value with less work (Pampanelli et al., 2013; Dornfeld et al., 2013), Green application in the context of manufacture is intended to minimize damage to the environment by applying to such environmental production practices. Dornfeld et al., (2013) stated that Green Manufacturing is more focused on the continuity of global economy without further damaging the environment, so being the focus of using this concept the environmental impact resulting from the activities instead of creating value for the customer.
Pampanelli et al. also suggest two of main practices associated with the Green paradigm:
1. Cleaner production: it is characterized as a preventive initiative and is designed to minimize waste and emissions and maximize productive output. Strategies to reduce emissions and waste in the process are outlined by analyzing the flow of materials and energy. With these actions can be avoided large waste in various sectors such as waste water, gases or heat.
20
services, increased use of recyclable materials, reducing energy costs and maximizing the utilization of resources
With the implementation of the Green practices is intended that, on the one hand there is an increase in productivity by reducing the use of natural resources and on the other hand, that there is a reduction of the environmental impact caused by industrial activities.
Green Manufacturing embraces a wide range of productive activities from development of Green technology products, implementation of advanced manufacturing and production technologies, introduction of energy efficient, environmentally friendly manufacturing processes and systems (Li et al., 2013), whether in the factory as the organizational level and throughout the associated supply chain. Li et al. (2013) reported that the Green Manufacturing success has on its basis an element of great importance - the automation. Several associated innovations have been applied in the industrial context for the implementation of Green practices. For example, are highlighted techniques related to the control for startup and shutdown of machines that are very important in controlling and reducing energy consumption.
2.1.2.1
Adoption of Green practices through Standardization
The control of energy consumption is a major concern of Green Manufacturing. Moreover, companies have had a growing environmental awareness and consequent concern with their image and social performance. As such it is important for companies to adopt the approaches listed in the International Organization for Standardization (ISO) standards related to Green practices (Zailani et al., 2012). Two standards raised in this context are for example the ISO 50001 and ISO 14031.
21
the requirement of the supply chains in the future (HKEIA, 2013). According to HKEIA, (2013) ISO 50001 can be used for certification of the company in accordance with the parameters of the standard, but the advantages of adoption can expand on a global scale, taking effect on about 60% of energy use in the world. With the application of this standard in business, it is possible to achieve a more efficient use of available energy sources, thereby increasing competitiveness and reducing emissions of greenhouse gases as well as other negative environmental impacts related.
Industrial facilities are a major energy consumer, as such, they must join forces to reduce this consumption, with the goal of preserving the environment. The implementation of energy saving measures encourages companies to manage their energy-related issues through a systematic approach to ensure continuous improvement of its energy performance.
Technologies and energy saving equipment are just some of the methodologies for improving energy efficiency. A more sensible and systematic approach to improving the energy performance of a sustainable company is to establish and implement a standardized process based power management structure.
22
2.2
Implementation of Lean and Green practices in manufacturing companies
and measurement of their performance
Relative performance evaluation is important to help the companies to be able to monitor their performance. The Benchmark refers to a methodology to compare the performance of a company with a set of other companies. The group of companies that make up the set for comparison, can be defined in various ways, but ultimately, the definition adopted depends on the utility of performance results to the end user involved (Feeny & Rogers, 2003).
The increasing competitive markets, confronts companies with the need of use management tools that allow them to diagnose the critical factors of the business, with the aim of developing strategies to achieve their goals. Performing Benchmarking is the search of the best methods used in different business processes and functions, with special focus on those whose impact on performance, enables secure and sustain competitive advantages (IAPMEI, 2014). Benchmarking exists to fulfill this need being widely requested by companies as a tool to support the improvement of its performance. In this way, Benchmarking is characterized as being an analytical tool that can help to understand the complex nature of the companies’
performance. Thus, Benchmarking represent a means to support the improvement process, establishing itself as a form of learning, since the search for best practices implies a careful analysis of the various ways to implement the processes and methods of work adopted by companies.
In this way, Feeny & Rogers (2003) suggest that the comparative analysis of the group may involve a comparative process between companies’ effort in relation to their results. On the other hand, it may also be interesting to do this by analyzing the relative comparison between business parameters. Finally, it may also be interest to assess which company has a superior performance compared to some established limit for best practices.
23
areas covered, it is necessary to choose the measures which may be considered useful in the construction of metric measurement systems.
The Lean practices mentioned in section 2.1.1, focus on areas and particular aspects of the productive process, in order to eliminate waste, while increasing quality levels while the costs and time associated with the process are decreasing (Kumar & Abuthakeer, 2012). So, it is relevant a study about the quantification of the application of practices associated with the Lean, which takes into account all the tools/practices considered to be significant for this purpose.
Similarly to the Lean paradigm, it is also important to identify the practices that allow the definition of the Green paradigm application in a company. The practices listed in the literature review of the Green paradigm present in sub-chapter 2.1.2, when applied in manufacturing companies, are a way for application, analysis and expansion, of the Green Manufacturing paradigm itself through company. Regarding the implementation of Green practices, despite being a huge improvement at an environmental level, and the possibility to make better exploitation of materials and resources used, not everything is positive about it implementation. Although the companies have a growing awareness of the benefits that Green can provide, it remains difficult for some of them achieve this implementation, due to implicit costs that are often very high due to the need for conversion of previous manufacturing practices which involves several changes around all levels of the company.
Taking as background all the literature on practices applied in Lean and Green context, well as their relationship with the kind of data that will be used in the development of the models proposed in this dissertation, in section 4.3 will be propose the practices that will be used to define the Lean and Green construct.
2.3
Green and Lean indexes in manufacturing companies
24
Lau (2011) developed a study aiming to compare the performance of two countries (China, a developing country, and Japan, a developed country) with regard to the Green Logistic Performance theme. For that purpose, the author developed an index that calls itself Green Logistics Performance Index (GLPI) and used as an example for the study, the data from a survey of Green Logistics performance practices of home electronic appliance (HEA), investigating and comparing Chinese and Japanese manufacturers. The aim of the constructions of the GLPI is the easy comparison of performance among industries and countries. The major research focus is placed on three major areas of logistics in the HEA supply chain, i.e. purchases, packaging and transport, where the Green activities can bring meaningful benefits. Lau (2011) justifies the use of this methodology stating that the aggregate findings should reflect more or less the current situation, although there might be possibilities of under- or over- assessment of performance on certain activities by individual respondents. Lau refers to the emphasis on the relationship, rather than absolute performance using just a five-point scale, furthering lessens the impact of any random assessment bias. The Principal Component Analysis (PCA) was used to obtain the weights in order to develop the GLPI used for an overall comparison of Green Logistics (GL) performance between the two countries. The 15 GL activities in question were represented by the abbreviations A1, ..., A15, where these variables can
take values from a five-point scale (values between 1 to 5). By applying the PCA method, the performance scores of activities A1 to A15 reported were obtained, being possible to obtain the value corresponding to the total score for performance (S). Lau (2011) describes the measure S by the expression presented in Equation (2.1):
(2.1)
Since obtaining the S value is then possible to obtain the expression for the proposed composite index, GLPI, which adopt values between 0 and 100. The Smin and Smax variables are,
respectively the minimum and maximum values that S can achieve by replacing the variables
A1, ..., A15 by the minimum and maximum values of the scale that they can take (1-5). The
expression of GLPI is described in Equation (2.2):
( )
25
The design methodology of GLPI has enough interest in the context of this dissertation, since its principles can be applied to the creation of Lean and Green indexes. So this relationship will be developed later in section 4.4.
Other authors have been exploring the development of indexes not only for Green practices, but also linking them to other concepts such as resilience. Azevedo et al. (2013) suggested an Ecosilient Index to assess the greenness and resilience of automotive companies and the associated supply chain using the Delphi technique. Their main objective was to propose an integrated index called Ecosilient to reflect the resilience and Green companies on their supply chain. The application of the proposed index was illustrated using a case study in the automotive sector, applying in particular on the link between supplier and manufacturer. To that end, the authors used the Delphi technique in order to obtain the weights for the paradigms of the supply chain, which was considered the focus of study. As Azevedo et al. (2013) discuss, the Delphi technique is a tool used to develop weights using the views of academics/experts on topics related to the research in question. The Delphi technique is a method which provides for the consensual validity of all evaluators by providing feedback to the responses of other evaluators, so is a useful communicating tool to reach consensus among entities given a problem (Azevedo et al., 2012b). As the authors stated, the indicators for each company can be calculated by aggregating the individual corresponding sub-indicators according to their importance. For each company j was presented a generic formula for the index Bx (where x is the paradigm in question, x = G: Green or x = R: Resilience), Equation (2.3)).
( ) ( ) ( ) ( ) (2.3)
Where:
1. (Bx)j: company j behavior according to the paradigm x (x = G or R).
2. (Pxi)j: company j the implementation of practice i level according to the paradigm
x. A total of y practices are considered for each paradigm. Each practice
implementation level is assessed in a five point scale where 1 means “practice not implemented” and 5 “practice totally implemented”.
26
For each company the Bx behavior ranges from 1 (not practice paradigm implemented) to 5 (all
seven practices are implemented paradigm). Thus Ecosilient Index for a particular company (Ecosilientj) is a composite indicator, described in Equation (2.4):
( ) ( ) (2.4)
Where:
1. (Bx)j represents the company j behaviour related to the paradigm x (x = G or x =
R).
2. wR and wGsymbolize the weight of green and resilient paradigms. The weight
values represent the significance of each paradigm for Supply Chain competitiveness.
Other techniques are available for assessment of the multiple manufacturing paradigms. Vinodh et al. (2011) argue for the need of using fuzzy logic due to the impreciseness and vagueness associated with decision-making problems. The authors present a study in which they used fuzzy association rules for leanness evaluation. According the authors the fuzzy methodology is described as:
“Fuzzy set theory is one of the useful tools where problems related to vague logics are dealt.
Fuzzy set theory allows representation of partial member- ship of elements in more than one set, .i.e. an element can be a member of more than one set at the same time. According to fuzzy set theory, the sets that we use in classical set theory is called a crisp set and one or more sets are associated with a crisp set which are called fuzzy sets whose elements are fuzzy numbers
(integers between 0 and 1).”
In order to evaluate the performance of Agile Supply chains (ASC), Vinodh et al. (2013) created an evaluation model. The calculation of the model was performed using fuzzy logic approach. The method for assignment of the performance variables was based on the expert’s
27
( ( ) ( ) )
(2.5)
( ) ( ( ) ( ) ) (2.6)
Where, Rj is the average fuzzy ratings; Rjm is the fuzzy performance ratings; Wjm is the
performance weights; Wjrepresents the average performance weights and xj, yj, zj are the three
warehouses under analysis regarding the supply chain under study, considering m as the number of experts.
Consolidated fuzzy ratings and fuzzy weights were used to determine the fuzzy ASC index (FASCI), according to Equation (2.7).
∑ ( ∑ ( ) )
( 2.7)
Other researchers developed models to measure indexes based on fuzzy approach. For example Yang & Li. 2002) proposed a procedure for evaluating Agility with fuzzy logic approach for mass customized product manufacturing, identifying intervals on a scale of 2-10 to indicate whether the company are agile or not. Also, Yu et al., (2012) also stand out in this context since they used the fuzzy multi-objective vendor selection program for lean procurement, developing an algorithm solution using fuzzy Analytical Hierarchy Process (AHP).
2.4
Conclusions
28
29
3
Composite index construction methodology
3.1
Composite index
In this section the theoretical bases for composite indexes are presented and the numerous advantages in the use of composite indexes are identified. In addition, is their suitability to data from practices implementation level that in this work are the variables of the index.
In general, an indicator is a quantitative or quality evaluation from real observations. When the evaluation is performed at regular intervals, it is possible to observe the evolutionary trends of the indicator through time. Composite indexes can be obtained from indicators since indexes are characterized as being aggregated indicators that comprise individual indicators and their respective weights (Nardo et al., 2008). Composite indexes are weighted elements, generating a composite variable that does not suffer from disorders, which means that the composite variable is an exact linear combination of composite variables indicators. In the context of this dissertation, composite indexes are those that have relevance to the study and construction of the proposed index.
Composite indexes can be useful in politics and benchmarking or performance monitoring priorities. A composite indicator is formed by compiling individual indicators into a single index based on a mathematical model. The composite indicator shall measure multi-dimensional concepts, which is not possible with the simple indicators analysis Nardo et al. (2008). As examples of multi-dimensional concepts stand out competitiveness, industrialization, sustainability, etc. Due to the easy interpretation of composite indicators results, they have been used in comparative analyses of countries, classifying and evaluating their performance regarding a wide range of topics. Among the more recently studied themes, stand out those related to social, human, environmental and safety aspects, as well as those related to globalization theme. Several institutions and academics have been developing composite indexes. These indexes are based on various indicators and sub-indexes aggregated according to some analytical methodology that has the purpose to give a score to the organization involved. The scores obtained by companies resulting from the calculation of these indexes are used to create a classification that shows their progress (or reverse).
30
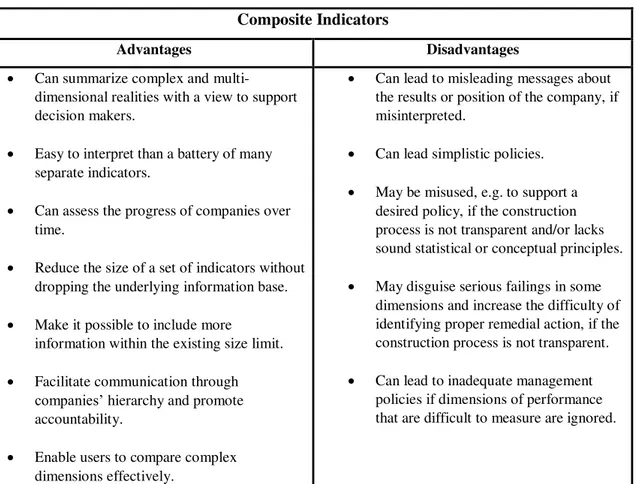
fact that such indexes are easy to interpret, especially when compared with a large number of other indicators that need to be analysed separately, also highlighting the fact that with its implementation, it is possible to reduce the size of the initial set of indicators without losing the basic underlying information. The possibility of measuring progress over time is another positive characteristic. However, it can be stated that one of the major advantages of using this type of indicators is the fact that it can provide users the ability to effectively compare complex dimensions. Saisana & Tarantola (2002) summarized the possible advantages and disadvantages of creating and using composite indexes for comparisons and country rank performance in areas such as industrial competitiveness, sustainable development, globalization and innovation. These advantages and disadvantages, adapted to the business context, can be found in Table 3.1.
Table 3.1 – Advantages and disadvantages of Composite Indicators Adapted from Saisana & Tarantola (2002)
Composite Indicators
Advantages Disadvantages
Can summarize complex and
multi-dimensional realities with a view to support decision makers.
Easy to interpret than a battery of many separate indicators.
Can assess the progress of companies over time.
Reduce the size of a set of indicators without dropping the underlying information base.
Make it possible to include more
information within the existing size limit.
Facilitate communication through
companies’ hierarchy and promote
accountability.
Enable users to compare complex dimensions effectively.
Can lead to misleading messages about the results or position of the company, if misinterpreted.
Can lead simplistic policies.
May be misused, e.g. to support a desired policy, if the construction process is not transparent and/or lacks sound statistical or conceptual principles.
May disguise serious failings in some dimensions and increase the difficulty of identifying proper remedial action, if the construction process is not transparent.
Can lead to inadequate management policies if dimensions of performance that are difficult to measure are ignored.