Habitat Heterogeneity Affects Plant and
Arthropod Species Diversity and Turnover in
Traditional Cornfields
Eliana Martínez1*, Matthias Rös2,3, María Argenis Bonilla4, Rodolfo Dirzo5
1Escuela de Posgrados, Facultad de Ciencias Agrarias, Universidad Nacional de Colombia, Bogotá, Colombia,2Instituto de Ecología A. C., Red de Ecoetología, Xalapa, México,3Centro Interdisciplinario de Investigación para el Desarrollo Integral Regional, Instituto Politécnico Nacional, Oaxaca, México, 4Departamento de Biología, Facultad de Ciencias, Universidad Nacional de Colombia, Bogotá, Colombia, 5Department of Biology, Stanford University, Palo Alto, California, United States of America
Abstract
The expansion of the agricultural frontier by the clearing of remnant forests has led to human-dominated landscape mosaics. Previous studies have evaluated the effect of these landscape mosaics on arthropod diversity at local spatial scales in temperate and tropical regions, but little is known about fragmentation effects in crop systems, such as the com-plex tropical traditional crop systems that maintain a high diversity of weeds and arthropods in low-Andean regions. To understand the factors that influence patterns of diversity in human-dominated landscapes, we investigate the effect of land use types on plant and arthropod diversity in traditionally managed cornfields, via surveys of plants and arthropods in twelve traditional cornfields in the Colombian Andes. We estimated alpha and beta diver-sity to analyze changes in diverdiver-sity related to land uses within a radius of 100 m to 1 km around each cornfield. We observed that forests influenced alpha diversity of plants, but not of arthropods. Agricultural lands had a positive relationship with plants and herbivores, but a negative relationship with predators. Pastures positively influenced the diversity of plants and arthropods. In addition, forest cover seemed to influence changes in plant spe-cies composition and spespe-cies turnover of herbivore communities among cornfields. The dominant plant species varied among fields, resulting in high differentiation of plant com-munities. Predator communities also exhibited high turnover among cornfields, but differ-ences in composition arose mainly among rare species. The crop system evaluated in this study represents a widespread situation in the tropics, therefore, our results can be of broad significance. Our findings suggest that traditional agriculture may not homogenize biological communities, but instead could maintain the regional pool of species through high beta diversity.
OPEN ACCESS
Citation:Martínez E, Rös M, Bonilla MA, Dirzo R (2015) Habitat Heterogeneity Affects Plant and Arthropod Species Diversity and Turnover in Traditional Cornfields. PLoS ONE 10(7): e0128950. doi:10.1371/journal.pone.0128950
Editor:Nicholas J Mills, University of California, Berkeley, UNITED STATES
Received:July 30, 2014
Accepted:May 1, 2015
Published:July 21, 2015
Copyright:© 2015 Martínez et al. This is an open access article distributed under the terms of the
Creative Commons Attribution License, which permits unrestricted use, distribution, and reproduction in any medium, provided the original author and source are credited.
Data Availability Statement:All relevant data are within the paper and its Supporting Information files.
Introduction
Agroecologists propose that traditional farming systems may provide invaluable agroecological principles needed to develop global sustainable agriculture [1]. These principles are useful in developing strategies for pest management in crops, as well as, for conservation of biodiversity in human-modified landscapes. Indeed, traditional agriculture sustains a huge diversity of organisms that in some cases may be comparable to that of natural ecosystems [2]. This diver-sity may benefit agroecosystems through positive effects on ecosystem functioning that increase adaptability to extreme climatic conditions, and resilience to biotic and abiotic stress [3]. However, underestimation of traditional knowledge, intensification of small family farm-ing [4], and rural-urban migration [5] are leading to the abandonment of traditional agricul-ture. The combination of these factors results in an irreparable loss of native varieties of crops, their wild relatives, and associated biota that perform essential ecological functions for agricul-ture (e.g., pest regulation, pollination and nitrogen fixation, etc.). Therefore, agroecologists need to elucidate how traditional farming systems prevent biodiversity loss, a key factor for achieving sustainable agriculture.
The large number of species in traditional crop systems could result from high habitat het-erogeneity, especially if the species exploit resources in different habitats in the landscape mosaics [6]. In addition, cultural practices for the control of pests and weeds could contribute to the maintenance of overall diversity. For instance, weeds within crops have been related to better pest suppression because natural enemies will increase in diversified agroecosystems and thereby control herbivores more effectively [7]. Furthermore, weeds could encourage longevity and fecundity of natural enemies of pests by providing them with extra resources, such as nec-tar, pollen and habitats [8–13]. Alternatively, however, resources provided by plants may also benefit herbivores in crops [14]; thus, increased plant diversityper semay not necessarily result in better pest suppression [15,16]. Much research is still needed on the biodiversity of tradi-tional crops and the roles of those species.
Assessments of biodiversity in human-dominated landscapes indicate that less-intensive land use has a positive effect on biodiversity [6,17]. For example, comparison of biodiversity between organic and conventional farms has demonstrated higher species richness of weeds and benefi-cial arthropods in organic fields [12,18–21]. At the landscape level, the presence of natural habi-tats may favor the species richness and abundance of beneficial arthropods in crops [21–24]. Although these findings are consistent across different regions and crops [25], the methodologi-cal approaches of these studies have been criticized because they have mainly focused on diver-sity at the plot scale [17,26]. Consequently, the impacts of human activities on biodiversity in agricultural landscapes should consider different spatial scales in order to gain more insight into the relationships between landscape structure, crop management practices, and biodiversity.
A growing number of studies have partitioned diversity into components (alpha, beta and gamma diversity) to assess the effects of crop management practices and landscape structure on biodiversity in agroecosystems [17,26–29]. The findings of these studies have led agroecologists to suggest that intensifying agriculture (through the transformation of natural habitats to agri-culture, or through crop management practices to increase crop yields) may homogenize biolog-ical communities across agricultural landscapes [17,28]. This homogenization may arise either from the reduced availability of niches in simplified habitats, which can promote the loss of rare or habitat specialist species, or from the dominance of disturbance-adapted species that can dominate biological communities [30]. However, agricultural intensification may also differenti-ate communities across agricultural landscapes; in this case, we would expect beta diversity to increase as land use intensifies. For instance, a higher contribution of beta diversity to overall diversity has been observed for weeds [27] and arthropods [26] in temperate agroecosystems.
This type of differentiation may occur if the landscape configuration restricts the dispersion of organisms across different habitats. For example, food production activities result in habitat patchiness in the landscape, which in turn promotes differentiation of communities through extinction-colonization dynamics [31]. These processes are highly dependent on the spatial scale and the organisms’life history traits, although geographical distances between plots and similari-ties in environmental conditions might also be important predictors of changes in the composi-tion of species [31]. Few studies, however, have analyzed these relationships considering multiple taxa, and instead have focused on one particular group of organisms [17,22,32–34].
In this article, our aim was to study plant and arthropod biodiversity in traditional cornfields located in a mountainous environment in the Colombian Andes. We analyzed diversity data with a multi-taxonomic focus (plants, herbivores and predators) and multi-scale perspective (within fields and among fields). Specifically, we addressed the following questions:i)How does alpha diversity change across a gradient of forest cover for different taxa in this area?ii)To what extent does beta diversity change among different taxa and among rare and common species? iii)Are environmental factors related to differences in species composition among cornfields? iv)How do species composition and the relative abundance of species vary among cornfields?
The presence of natural habitats in agroecosystems is associated with higher species richness of arthropods in crops [25]; therefore, we expected that plant and arthropod biodiversity in cornfields would increase with increasing forest cover surrounding the crop. The long land use history and traditional knowledge in this region—indigenous people inhabited this area before the Spanish conquest in the sixteenth century [35]—creates highly heterogeneous landscape mosaics, so we hypothesized that beta diversity could be high among cornfields. We also expected that the geographical distance between cornfields would cause species replacement, leading to higher beta diversity as the distance between cornfields increased.
Methods
Study area
Fieldwork was conducted from August 2011 to February 2012 in the municipality of Topaipí, Cundinamarca, a rural area located on the west slope of the Central Cordillera in Colombian Andes (5 23.366N, 74 18.125W). In this region, we chose twelve traditional cornfields with a minimum distance of 230 m from each other. All fields were small, varying in area from 591 to 5112 m2. Cornfields were embedded in a landscape sector of 19 km2in an altitudinal gradient ranging from 1296 to 1550 m.
The landscape in this region is a mosaic of native forest and human land use, such as culti-vated fields, fallows and pastures, with a forest cover of not more than 30% of the municipality [36]. Annual rainfall in the region is 2525.8 mm, with peaks in April and September, and the average temperature is 21.3°C, with a range of 19.9 to 23.3°C.
Crop management
Land use types surrounding cornfields and other environmental
descriptors
We used GPS to record the geographical coordinates, the altitude and the area for each corn-field. We mapped the land-use types at multiple radii around each cornfield (100, 250, 500, 750, and 1000 m) via field visits and inspections of aerial photographs (Ground Sample Dis-tance = 27.7 cm), and we estimated the amount of area covered by each land-use type using ArcView 3.2 [37]. We classified land-use types in the study area as native forest, secondary growth, hedges, pastures, transitional crops, perennial crops, home gardens, and constructions.
Land use cover surrounding each crop was selected as the main predictors for further analy-sis. In particular, we used the cover of native forest, natural and semi-natural habitats (native forests, hedges, and secondary growth combined), and the cover of pastures and crops as addi-tional predictor variables.
We evaluated possible co-varying effects of soil quality on measurements of diversity by sampling soil in each plot at harvest time. The introduction of organic matter into soils may increase biomass and species numbers [38,39], so we chose the percentage of carbon in soils as a predictor of species richness for further analysis. We also included altitude and the perime-ter-to-area ratio of each field as co-variables.
Previous use of the plots differed among cornfields. Therefore, at the beginning of the study, we recorded the known former type of cover of each field. Five categories were established: native forest, fallow (secondary growth), pasture, other crops, and invaded plots (fallow plots dominated by a unique plant species).
Arthropod sampling
We sampled flying and leaf-dwelling arthropods in September and December 2011. Samples were obtained by sweep netting (N = 10 strikes) at the center of each cornfield. Arthropods were preserved in 70% alcohol until further identification at the family level and morphospe-cies of herbivores and predators. We classified arthropods into trophic groups (predators, para-sitoids, herbivores) according to literature records for families or genera [40–44].
Weed sampling
We sampled plants in December 2011, four months after the corn sowing date. We randomly selected five rows in the center of each cornfield. For each row, we used equidistant sampling stations along a 20-meter-long transect, for a total of 25 sampling stations per cornfield. Each station was sampled using a 50 cm x 50 cm quadrat divided into 100 subquadrats. We recorded the presence of all plant species in each station and counted the number of subquadrats occu-pied by each species as a measure of cover.
A measure of dominance of each species per cornfield was estimated as the sum of their rel-ative values of frequency and coverage. The relrel-ative frequency was estimated as the proportion of quadrats in which a species was present in each cornfield; relative coverage was the sum of the coverage of each species in all quadrants divided by the sum of the values of coverage for all species in each cornfield.
Ethics Statement
Data analysis
Sample completeness in each cornfield was evaluated as the percentage of species observed rel-ative to the number of species predicted by the Abundance Coverage-based Estimator of spe-cies richness (ACE) using EstimateS ver. 8.2 [45]. In addition, we estimated the sampling coverage of our data; these values representing the proportion of the total number of individu-als in a community that belong to the species represented in a sample [46].
Local diversity. We calculated the Hill numbers or“true diversities”of each cornfield by following the methodological approach developed by Jost [47]. According to that method, common diversity indices are converted to measures of diversity in the community, which are known as the“effective number of species”and which obey the duplication principle [47]. We calculated these numbers at three different orders (q) of diversity. Orderqindicates the mea-surement’s sensitivity to common and rare species. Aqvalue of 0 indicates indifference to spe-cies abundance, such that all spespe-cies are given the same weight, thereby favoring rare spespe-cies. Whenq= 1, species are weighted exactly for their abundance in the community; rare or com-mon species are not favored, whereasq= 2 favors more abundant species [47]. Accordingly, species richness is a measure of diversity of order zero (0D), the exponential of Shannon’s index is the measure of diversity of order one (1D), and the inverse of Simpson’s index is a mea-sure of order two (2D) [47,48]. We constructed diversity profiles by plotting diversities at dif-ferent orders in an increasing manner, which allowed us to identify patterns of dominance in cornfield communities. True diversities were calculated using R and a modified version of the Entropy calculator, an Excel code developed by L. Jost.
We used linear regression models to examine the relationships between diversity of plants or arthropods and land use types around the cornfields, including native forest, natural and semi-natural habitats combined, crops and pastures. We constructed alternative models with land use types at different distances around the crops (100, 250, 500, 750, and 1000 m) to iden-tify the spatial scale in which models have a better fit with observed data. To select the best models we used Taylor diagrams for comparing non-nested regression models, based on the correlation between fitted values from the models and observed values, and also the Root Mean Square (S1 Fig) [49]. The land use data over a 100 m radius around the crops showed an increasing overlap (6, 24, 38, and 51% at 250, 500, 750, and 1000 m, respectively), so we tested model residuals for spatial autocorrelation in order to ensure spatial independence between the twelve study sites [50]. We found no evidence for spatial autocorrelation at any spatial scale considered (S1 Table).
The natural variation between fields led us to use soil organic matter, altitude, and field perimeter-area ratio in the models as covariates. Before performing regression models all pre-dictor variables were log-transformed (Ln Variable = ln (variable-(minimum (variable)-1)), to account for non-linear relationships among variables. We then controlled possible multicolli-nearity among predictors by calculating the Variance Inflation Factor (VIF), and included vari-ables with VIF equal to or lower than 10 in the models [51]. Finally, we used stepwise forward and backward simplification for model specification in order to comply with the principle of parsimony and we chose the best models based on the criteria of Akaike [52]. We checked all model assumptions including homoscedasticity, normality and independence, and we only present significant models (P<0.05) that accomplish all assumptions. All analyses were con-ducted using R software [53].
Additional linear regression models were performed to examine the relationship
Turnover of species between cornfields. We used multiplicative diversity partitioning of Hill numbers in their unweighted form to analyze the changes in species composition between cornfields [47]. This method partitions the regional gamma diversity (γ) into independent components of local alpha diversity (α) and beta diversity (β) in a multiplicative manner: Dα× Dβ= Dγ[47]. Beta diversity can be transformed into compositional similarity (CS) as follows:
ð^qÞCS¼ ð1=ð^qÞDb 1=NÞ=ð1 1=NÞ ð1Þ
Values of compositional similarity vary between 0 (all sampling units have different species) and 1 (all sampling units have the same species). Whenq= 0 and N = 2, the value is equivalent to the Jaccard Index; whenq= 2, the result is the Morisita-Horn Index. Such transformation is useful when comparing values based on a different number of sampling units [48].
We performed a Mantel test to evaluate whether the variation in the pairwise beta diversity of cornfields was related to pairwise crop distance. In addition, we performed a Mantel test between the pairwise beta diversity matrices and the environmental distance matrices to deter-mine if the dissimilarity in species composition was related to environmental gradients. Envi-ronmental distance matrices were constructed based on pairwise differences between cornfields, including forest cover surrounding each cornfield, altitude, percentage of soil organic matter and the raw number of plant species in each cornfield. Correlation coefficients and p-values were estimated from 1000 permutations. Pairwise beta diversity matrices and the Mantel Test were performed in R [53].
Patterns of relative abundance. For each cornfield, we ranked species according to their abundance from highest to lowest. We plotted the abundance of the ten most dominant species in each cornfield. These graphs allowed us to identify changes in the dominance and composi-tion of the more abundant species among the cornfields.
Context-dependent changes in species composition. We performed Non-Multidimen-sional Scaling analysis to visualize changes in species compositions as a function of the land use context of the cornfield. We classified cornfields into two categories of land use contexts based on the percentage of native forest in a radius of 250 m around the crop. The first group, called the“Agricultural Context”(fields A1-A6), consisted of fields with 1 to 26% of native for-est. The second group, the“Forest Context”(fields F1-F6), comprised of fields with 27–50% of native forest around the crop.
Ordination was undertaken for quantitative data using the Jaccard and Morisita-Horn Indi-ces, which are also direct transformations of beta diversity of orders 0 and 2, respectively. The stress values of each analysis are reported in the results. These analyses were performed in R [53].
Results
We collected 198 morpho-species of plants from 53 families; 5975 individuals of herbivores from 5 orders, 38 families and 217 morpho-species; and 1574 individuals of predators from 7 orders, 34 families and 132 morpho-species. According to the ACE richness estimator, we sam-pled 83% and 70% of the total estimated number of plant and arthropod species in the commu-nity, respectively. However, when we used sampling coverage values, we obtained values of 90% to 95%, suggesting that only 5% to 10% of individuals of the community belonged to spe-cies not represented in our sampling. Therefore, we conclude that our sampling was satisfac-tory for characterization of plant and arthropod communities within the cornfields.
Local diversity
in the community (although highly variable among cornfields); thus, most of species richness was due to rare species (S2 Fig). This pattern of dominance was consistent throughout all corn-fields and all taxonomic groups. Furthermore, high dominance of communities of plants and arthropods within the cornfields occurred, regardless of whether the field was mainly sur-rounded by agricultural land or by native forest.
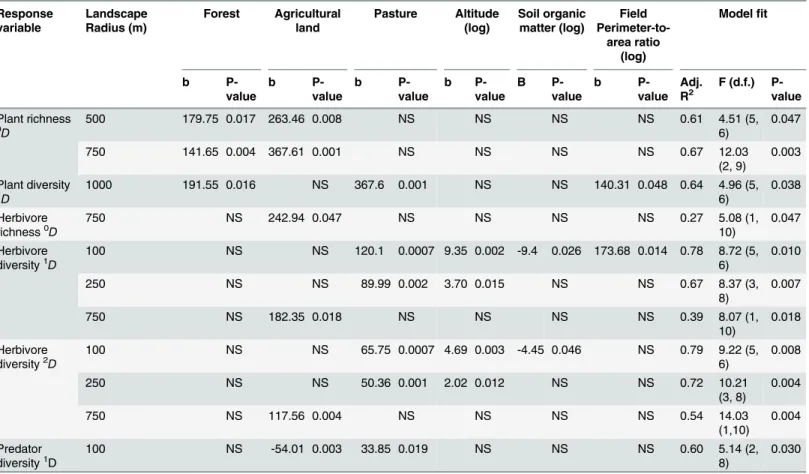
Forest and agricultural cover had significant positive regression weights on models that examined the relationships between plant richness and land use covers, indicating that corn-fields with larger proportion of these landscape elements were expected to have higher plant species richness (0D), for the 500 and 750 m landscape buffers. Other land uses, such as pas-tures (at a spatial scale of 1000 m) had a positive relationship with the diversity of common plant species (1D). In contrast, the diversity of abundant plant species (2D) was not associated with any land use or environmental predictor. Altitude and soil organic matter did not contrib-ute to regression models examining relationships with plant diversity. Finally, field perimeter-to-area ratio had a significant and positive relationship with diversity of common plant species (1D) but only for the 1000 m landscape buffer (Table 1).
Forest cover did not contribute to regression models for herbivores. Instead, pasture cover (log-transformed) measured at small spatial scales (100 and 250 m) had significant positive regression weights, indicating that cornfields with a larger proportion of pastures were expected to have more diverse herbivore communities (1Dand2D). In addition, the cover of agriculture also had a positive relationship with the diversity of herbivore communities (0D,1D,2D), but
Table 1. Results of linear regression models for biodiversity of plants and arthropods in twelve traditional cornfields located in the Colombian Andes.Coefficient values (b) of predictor variables and P-values are shown for each model. Alternative models were constructed using land use types mea-sured at 100, 250, 500, 750 and 1000 m. Only significant models at 0.05 confidence level are included here.
Response variable Landscape Radius (m) Forest Agricultural land Pasture Altitude (log) Soil organic matter (log) Field Perimeter-to-area ratio (log)
Modelfit
b P-value b P-value b P-value b P-value B P-value b P-value Adj.
R2 F (d.f.) P-value
Plant richness
0D 500 179.75 0.017 263.46 0.008 NS NS NS NS 0.61 4.51 (5,
6)
0.047
750 141.65 0.004 367.61 0.001 NS NS NS NS 0.67 12.03
(2, 9)
0.003
Plant diversity
1D 1000 191.55 0.016 NS 367.6 0.001 NS NS 140.31 0.048 0.64 4.96 (5,
6)
0.038
Herbivore richness0D
750 NS 242.94 0.047 NS NS NS NS 0.27 5.08 (1,
10)
0.047
Herbivore diversity1D
100 NS NS 120.1 0.0007 9.35 0.002 -9.4 0.026 173.68 0.014 0.78 8.72 (5,
6)
0.010
250 NS NS 89.99 0.002 3.70 0.015 NS NS 0.67 8.37 (3,
8)
0.007
750 NS 182.35 0.018 NS NS NS NS 0.39 8.07 (1,
10)
0.018
Herbivore diversity2D
100 NS NS 65.75 0.0007 4.69 0.003 -4.45 0.046 NS 0.79 9.22 (5,
6)
0.008
250 NS NS 50.36 0.001 2.02 0.012 NS NS 0.72 10.21
(3, 8)
0.004
750 NS 117.56 0.004 NS NS NS NS 0.54 14.03
(1,10)
0.004
Predator diversity1
D
100 NS -54.01 0.003 33.85 0.019 NS NS NS 0.60 5.14 (2,
8)
0.030
only when land use cover was measured at 750 m around the crop. Altitude, field perimeter-to-area ratio, and soil organic matter had significant weights in regression models for herbivore diversity; however, these relationships were not consistent at all spatial scales considered (Table 1). For instance, altitude (log-transformed) had a positive relationship with herbivore diversity (1Dand2D) when regression models included landscape data at 100 and 250 m. In con-trast, the soil organic matter (log-transformed) had a negative relationship with herbivore diver-sity (1Dand2D), but only when models included land uses at 100 m around the crop. Similarly, field perimeter-to-area ratio had a positive relationship with the diversity of common herbivores (1D), but only when models considered landscape types at 100 m around the cornfield.
Forest cover did not contribute to the multiple regression models examining the richness of predators (0D) or the diversity of common or abundant predators (1Dand2D) in cornfields. However, agricultural cover at small spatial scales (100 m) had a significant negative regression weight, indicating that cornfields with a larger proportion of agricultural lands were expected to have lower diversity of common predator species (1D). On the contrary, the cover of pastures at 100 m around the crop (log-transformed) had significant positive weights indicating that cornfields with a larger proportion of pastures around them had more diverse communities of common predator species (1D). Altitude, soil organic matter and field perimeter-to-area ratio did not contribute to the regression models for predator diversity (Table 1).
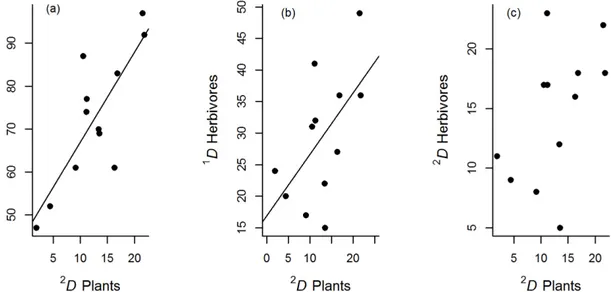
We observed a strong positive relationship between herbivore diversity (0Dand1D) and the diversity of abundant plant species (2D), but this relationship was not detected for2Dof herbi-vores (Fig 1andTable 2). Similarly, plant species richness0D(log-transformed) had a positive relationship with predator species richness0D, but not with1Dand2Dpredator diversity (Fig 1
andTable 2).
Former land use seemed to affect plant diversity regardless of the order of diversity consid-ered (Table 3). In particular, the lowest values of plant diversity were observed in fields that, prior to being sown with corn, were invaded by a dominant plant (e.g.,Hedychium coronarium Koening orGynerium sagitatumAubl.). Similarly, dominant and common species of predators also had the lowest values of diversity in these invaded plots (Table 3).
Fig 1. Relationships between the diversity of herbivores and plant diversity of order q = 2 in cornfields.a)For all herbivore species0D,b)for common
herbivore species1D, and c) for abundant herbivore species2D. The plots indicate a positive relationship between the effective number of common plant species (1D) and all orders of herbivore diversity. Lines show fitted values from significant linear regression models.
Species turnover among cornfields
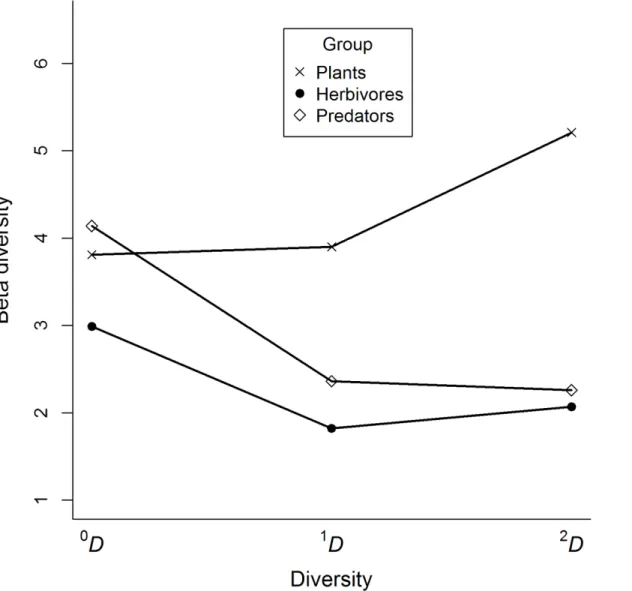
Beta diversity profiles indicated that the turnover of species among cornfields differed for plants and arthropods. Plant beta diversity increased as the order of diversity (q) increased, whereas arthropod beta diversity decreased (Fig 2). Consequently, the highest differences in species composition among cornfields were stronger among abundant plant species, whereas for arthropods these differences arose among rare species, and particularly among predators.
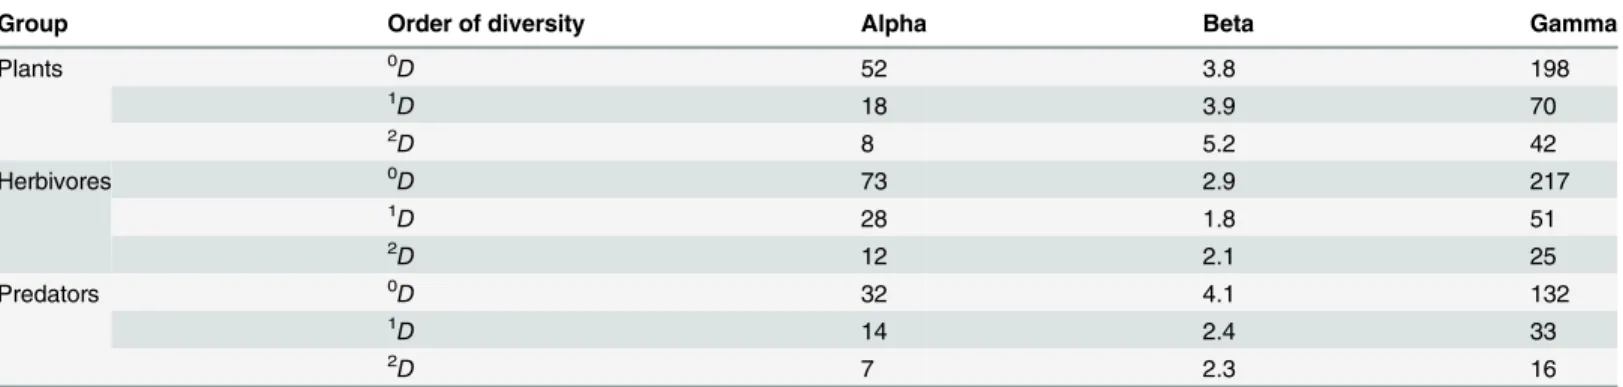
We evaluated 12 cornfields in our study area, so the true beta diversities could range in value from 1 to 12, providing an estimate of the number of effective communities in this land-scape. The values for our data ranged from 1.8 to 5.2, with the lowest values for herbivores and the highest values for plant communities, regardless of the order of diversity considered (Table 4). Therefore, plant communities in this landscape tended to differ among cornfields, whereas herbivore communities tended to be more homogeneous (Table 4). Common and abundant species of predators tended to be the same for most of the cornfields, whereas rare species substantially differed among them.
Spatial autocorrelation and relationships between beta diversity and
environmental gradients
We found no evidence for spatial autocorrelation in the dissimilarity of species composition (pairwise beta diversity matrices) and the geographical distance between cornfields (Table 5). By contrast, the turnover of herbivores between cornfields was associated with environmental gradients in forest cover surrounding the crop and with differences in plant species richness between crop fields, in most of the spatial scales considered for land use characterization
Table 2. Results of linear regression models for biodiversity of arthropods and plant diversity in twelve traditional cornfields located in the Colombian Andes.Coefficient values of predictor variables (b) and P-values are shown for all models. Only significant models at a 0.05 confidence level are included here.
Response variable Plant richness
0
D
Plant richness0
D (log)
Plant diversity2
D
Modelfit
b P-value b P-value b P-value Adj. R2 F (d.f.) P-value
Herbivore richness0D NS NS 1.54 0.019 0.68 12.84 (1, 10) 0.002 Herbivore diversity1D NS NS 0.97 0.049 0.27 4.98 (1,10) 0.049
Predator richness0D NS 4.47 0.042 NS 0.28 5.41 (1, 10) 0.042
doi:10.1371/journal.pone.0128950.t002
Table 3. Effective number of plant and predator species (Mean and SD) according to previous land use of the cornfields.
Group Order of diversity Forest (n = 1) Crops (n = 2) Pastures (n = 2) Fallow (n = 5) Invaded plots (n = 2)
Plants 0D 70.0 60.0 (2.8) 54.0 (2.8) 52.0 (13.7) 32.5 (7.8)
1D
27.0 26.0 (7.1) 22.0 (2.8) 20.8 (6.8) 6.5 (5.0)
2D 17.0 18.0 (3.5) 13.5 (4.8) 12.8 (4.8) 3.0 (1.4)
Herbivores 0D 83.0 80.5 (16.3) 67.5 (9.2) 78.4 (14.1) 49.5 (3.5)
1D 36.0 25.5 (14.9) 34.0 (9.9) 30.2 (12.2) 22.0 (2.8)
2D
18.0 11.5 (9.2) 19.5 (4.9) 15.2 (5.4) 10.0 (1.4)
Predators 0D 34.0 30.0 (7.1) 31.5 (3.5) 36.8 (7.2) 20.5 (2.1)
1D 21.0 12.0 (2.8) 16.5 (6.4) 17.2 (5.6) 7.5 (0.7)
2D 15.0 7.0 (0.0) 11.0 (4.2) 10.8 (5.6) 4.0 (1.4)
(Table 5andS2 Table). Therefore, a greater difference in forest cover between two cornfields was associated with greater the difference in their herbivore communities (1Dand2D). Simi-larly, forest cover matrices correlated to predator beta diversity (1D) but only when land uses were evaluated at a 250 m radius around the crop (S2 Table). Finally, our data suggest that increasing differences in the number of plant species between cornfields were associated with higher replacement of herbivore species between cornfields (Table 5).
Relative abundance patterns and changes in species composition
Rank-abundance curves for the ten most abundant species of plants, herbivores and predators confirmed that beta diversity was higher for plants than for arthropods (S3 Fig). We recorded 65 different plant species in the ten first ranks, in contrast to 34 herbivore species and 38 preda-tor species. These graphs also revealed highly variable patterns of dominance among the corn-fields. For plants, two cornfields had the highest dominance; for example, fields C5 and C7.
Fig 2. Beta diversity profiles of plants, arthropods and predators collected in twelve traditional cornfields.The plot indicates that differences in species composition among cornfields were stronger among abundant plant species, whereas for arthropods these differences arose among rare species, particularly for predators.
This uneven distribution was due to the presence of invasive species such asH.coronarium andG.sagittatum, whose cover values reached up to 71% and 45%, respectively, of each corn-field. Herbivore communities also had high dominance; the highest value of relative abundance was 46%, and the four dominant species included two leafhoppers (Cicadellidae), a leaf beetle (Chrysomelidae) and a katydid (Tettigonidae). Finally, predator communities had an uneven distribution of dominant species; most abundant species included flies from the families Doli-chopodidae and Empididae, spiders from the genusLeucauge(Tetragnatidae) and ant species from the generaAzteca,Linepithema,BrachymyrmexandEctatomma.
The NMDS analysis indicated that dissimilarity in plant species composition was related to the landscape context in which the cornfield was located. Ellipses joining cornfields that were mainly surrounded by agricultural habitats (A1-A6) and cornfields mainly surrounded by native forest (F1-F2) conformed two groups. This pattern was particularly evident when the similarity index was based on presence/absence data (Fig 3a), whereas some overlap occurred when the index favored abundant species (Fig 3b). For herbivore species (q= 0), we observed a clear overlap in the composition of species between landscape contexts (Fig 3c), whereas for abundant species (q= 2), there was some degree of differentiation (Fig 3d). Finally, we also observed an overlap in species predator composition between landscape contexts (Fig 3e and 3f). Therefore, the proportion of forest surrounding the crop did not have a substantial influ-ence on the differentiation of arthropod communities among cornfields in the study area.
Table 4. True diversities of plants, herbivores and predators collected in twelve traditional cornfields in an area of 19 km2in the Colombian Andes.
Group Order of diversity Alpha Beta Gamma
Plants 0D 52 3.8 198
1D 18 3.9 70
2D 8 5.2 42
Herbivores 0D 73 2.9 217
1D
28 1.8 51
2D 12 2.1 25
Predators 0D 32 4.1 132
1D 14 2.4 33
2D
7 2.3 16
doi:10.1371/journal.pone.0128950.t004
Table 5. Pearsons’s r correlation for the Mantel tests between pair-wise beta diversity matrices and distance matrices for geographical location and environmental gradients in twelve traditional cornfields.Environmental gradients included differences between fields in altitude, forest cover, per-centage of soil organic matter and plant species richness. Bold values indicate significant correlations at the 95% confidence level.
Group Order of diversity
Geographical distance
Differences in altitude
Differences in forest cover (250 m radius)
Differences in soil organic matter
Differences in plant species richness
Plants 0D -0.04 0.15 -0.01 0.13
1D
-0.19 0.07 0.00 0.18
2D -0.17 0.01 0.04 0.19
Herbivores 0D 0.03 -0.06 0.03 0.02 0.33
1D 0.08 0.05 0.32 0.21 0.05
2D
0.07 0.13 0.37 0.12 0.01
Predators 0D -0.21 0.01 0.23 -0.02 -0.02
1D -0.16 0.02 0.32 0.00 0.04
2D 0.06 0.1 0.29 0.12 0.14
Discussion
We found that diversity of plants, herbivores and predators was related to land use types around the cornfields. The positive relationship between forest cover and plant diversity suggests that cornfields with larger proportion of surrounding forest were expected to have more plant rich-ness and plant diversity. However, plant richrich-ness also had a significant and positive relationship with the cover of agricultural lands. Therefore, forest and agricultural areas could be source habitats from where plants colonized the cornfields; supporting the notion that species could benefit from different types of habitats in the landscape [54,55]. In addition, our characteriza-tion of land uses at different spatial scales revealed that plant communities seemed to respond more to changes in the landscape composition occurring at 500–750 m around the crop.
Fig 3. Non-metric multidimensional scaling ordination diagrams based on the Jaccard (left column) and Morisita-Horn (right column) indices for plants (a-b), herbivores (c-d), and predators (e-f) collected in twelve traditional cornfields.Ellipses indicate the clustering of biological communities based on the land use context of the cornfield: Fields A1 to A6: 1–26% of native forest in a radius of 250 m around the crop; fields F1 to F6: 27–50% of native forest around the crop. The plots indicate that dissimilarity in plant species composition was related to the land use context around the crops, however for arthropods, the plots indicate a clear overlap in species composition between land use contexts. Stress values: a = 0.01, b = 0, c = 0.16, d = 0, e = 0.18 and f = 0.
The central role of the forest for plant diversity was also supported by the results of NMDS analyses, suggesting that the closeness of cornfields to forests does affect the composition of plant species. For instance, the dominant species in the agricultural context werePteridium aquilinum(L.),H.coronariumandSpermacocesp., whereas in the forest context, the dominant species wereImpatiens balsaminaL.,Cortaderiasp.,Brachiariasp.,Alocasiasp., andDrymaria cordata cordata(L.) Willd. ex Schult. Other cornfield characteristics, such as the former land use could be related to diversity measurements. In particular, lower values of plant and preda-tor diversities occurred in those fields previously invaded by a dominant plant. These results support a central role for local factors, like crop management practices in the assemblage of weed communities in crops. As discussed by Navas (2012), the structure of plant communities in agroecosystems may depend on current conditions and the legacy of previous land use, as weeds do recover from the seed bank or through vegetative reproduction facilitated by agricul-tural practices. We speculate that plant diversity in each field may reflect the composition and size of the seed bank, which in turn is mainly affected by field management [56]. Therefore, future research should consider the impacts of landscape configuration and field management practices on the diversity as well as the composition of the seed bank in crop fields.
Our results contrast with previous findings of a positive relationship between predator diver-sity and proximity to forests in agroecosystems [33,57]. Furthermore, our data did not support the hypothesis that non-crop areas (forests and secondary growth) have a positive effect on the species richness of predators, in contrast to several previous studies with spiders [22,23,32]. However, we observed that diversity of common predators seemed to respond to other types of habitats in the local environment. In particular, cornfields with larger proportions of agricultural land, at small spatial scales (100 m around the crop) were expected to have lower diversity of common predator species, whereas an increased proportion of pastures enhanced predator diversity in cornfields. Similar findings of negative relationships between crop land and predator diversity have been reported previously [7]. These results suggest that predator response to land-scape composition may vary among species. Thus, some predators could be affected negatively by land use intensification, whereas other species could benefit from new habitats like pastures. The lack of a clear pattern in the response of predators to changes in land use types, may arise as a consequence of the higher landscape complexity typical of traditional agriculture landscapes. This, in turn, would enhance spillover of arthropods among different habitats types in the landscape. The moderate landscape hypothesis postulates that this spillover may have consequences in community structure by modifying the effect of landscape-wide diversity in local assemblages [6]. Thus, at least in these systems, the availability of native forest may be less important than the proportion of agricultural land or stochastic processes. Predators in cornfields may be able to obtain resources such as alternative prey, pollen and refuge in other habitats surrounding the field, including pastures and other crops. For example, a higher abun-dance of earwigs—a main predator ofSpodoptera frugiperdaJ.E. Smith (Lepidoptera: Noctui-dae) in maize crops—was found in environments with higher cover of grassland habitats in the landscape, whereas spiders and ground beetles were more abundant in environments domi-nated by coffee plantations [58]. Clearly, further research is needed to classify predators based on their dispersion capability, to provide a better determination of the role of the landscape composition on pest natural enemies in crop systems.
Regardless of the order of diversity considered, we observed a strong and positive relation-ship between the diversity of plant species and herbivore diversity in cornfields. These results are consistent with the Plant Richness Hypothesis, which was initially formulated for galling insects and argues that a higher number of plant species in a given site will equate to a higher number of herbivore species [59]. Mechanisms explaining this relation include higher host spe-cialization by herbivores and the increase in plant speciesper se, if the number of herbivore species is similar among plant species but the number of plant species per area is higher [60,
61]. Most phytophagous insect species (>70%) are specialized in their use of host plants [62], so the herbivores collected in cornfields likely exhibit a high level of host specialization.
Consistent with our expectation of high species turnover among the cornfields studied, we observed high beta diversity values, particularly for plants and predators in our study area. Dominant plant species differed among fields, which translated into high differentiation of plant communities. Predator communities also exhibited high turnover among the cornfields, but differences in composition arose among rare species. Herbivore communities tended to be more homogeneous across cornfields than plants and predators, but they also exhibited a high degree of differentiation. Our results support a high turnover of weed species in agroecosys-tems [63], in comparison with mobile species such as herbivores and predators [31]. Similar findings of high beta diversity values for agroecosystems have been reported for weeds [27] and arthropods [26] in temperate regions. Overall, these results indicate high heterogeneity at small spatial scales, particularly if we take into account the small size of the study area (19 km2). Thus, traditional agriculture could maintain or increase habitat heterogeneity, which supports a high number of species in the agroecosystem landscape. This heterogeneity may be linked to factors including complex landscape spatial configuration, and crop management practices such as weeding, polyculture, and crop rotation.
Environmental gradients typical of mountain areas may also be a factor. For instance, in mountainous environments, large changes in slope can occur at fine spatial scales, which may affect soil properties (e.g. depth, water retention capacity), which are key factors for plant development [64]. In addition, plants can modify microhabitats through facilitating or inhibit-ing the colonization of other species [65] and increasing habitat heterogeneity, particularly because of the high number of species inhabiting traditional cornfields. Furthermore, if we con-sider plants as habitats for arthropods, then plants deliver a high variety of resources and thus a higher number of potential niches, thereby increasing habitat heterogeneity, particularly for herbivores [62,66]. This increase in habitat heterogeneity may explain why herbivore turnover was related to differences in plant richness among the cornfields.
We observed no significant correlations between beta diversity matrices and environmental distance matrices for most groups of organisms. However, for herbivore and predator commu-nities, we observed that a higher dissimilarity in the amount of surrounding forest was associ-ated with a higher turnover of arthropods between cornfields. This result suggests that
landscape configuration—and habitat patchiness, in particular—may promote community dif-ferentiation through extinction-colonization dynamics [31]. Possible mechanisms explaining this result include a reduction in the matrix permeability to the dispersal of organisms. For example, some habitats can act as barriers to an organism’s movement, like open pastures to understory birds [67] or tall vegetation in crop borders to some wind-dispersed species such as aphids [68]. However, we found no evidence for spatial autocorrelation in our data, thus mech-anisms other than matrix impermeability and limited dispersal ability of orgmech-anisms should be considered as factors explaining the high turnover of species among cornfields.
the system, leading to high dominance of the fastest-growing species [70], a pattern also observed in our data. By contrast, the high turnover of rare predator species suggests that some species cannot remain in disturbed habitats, while dominant species might be agrobionts [71]. Thus, the reason why so many plant species dominate cornfields in this small sector of the landscape remains unclear. We speculate that the number of plant species might be related to the composition of the seed bank and the land-use history of the cornfields, factors that clearly warrant future research.
In summary, less-intensively used systems, such as the traditional agriculture system studied here, hold higher community dissimilarity due to larger habitat heterogeneity [8]. As a conse-quence, these systems maintain considerable local diversity, contributing to regional or gamma diversity. This heterogeneity might be the most important factor explaining the high plant and arthropod community differentiation in cornfields. This beta diversity is also promoted by environmental gradients in mountain areas, by high plant species richness, and by high levels of disturbance associated with agricultural practices. Thus, traditional agriculture may not homogenize biological communities; instead, it may maintain the regional pool of species through high environmental heterogeneity and beta diversity.
Supporting Information
S1 Fig. Taylor diagram displaying a statistical comparison with observations of three model estimates of plant and herbivore diversity in traditional cornfields.Alternative mod-els used different landscape radius around the cornfields (100, 250, 500, 750, and 1000 m). In these diagrams, the observed data are indicated as the green square on the x-axis; the standard deviation of the simulated pattern is proportional to the radial distance from the origin. The external circle corresponds to correlation values between estimates and observed data, the green contours indicate the centered root-mean-square (RMS) values. Best models are those with relatively high correlation, narrower amplitude of their variations, and low RMS error (their symbols lied nearest the observed values on the x-axis). The plot indicates that models based on landscape data at 500–750 m around the crop fitted better to observed values of plant richness (0D), whereas models based on landscape data at 100 m fitted better to observed values of herbivore diversity (0Dand1D).
(TIF)
S2 Fig. Alpha diversity profiles (q = 0, 1, 2) of plants, herbivores and predators in 12 tradi-tional cornfields.Farms were ordered left to right, following a gradient of native forest from 4–50%, in a radius of 250 m around the crop. The plots indicate a large decrease in the effective number of species—or true diversities—as the order of diversity (D) increased, indicating a high degree of dominance in the community (although variable among cornfields) regardless the group of organisms considered.
(TIF)
S3 Fig. Rank-abundance curves for the ten most abundant species of plants, herbivores and predators collected in twelve traditional cornfields.Farms were ordered left to right follow-ing a gradient of native forest from 4–50% in a radius of 250 m around the crop.
(TIF)
S1 File. Diversity data across all species per site.
(XLSX)
land uses in twelve traditional cornfields.Land uses were measured at different spatial scales (100, 250, 500, 750 and 1000 m). No evidence of spatial autocorrelation was detected besides over a 100 m radius around the crops. Landscape data had an increasing overlap (6, 24,38, and 51% at 250, 500,750, and 1000 m, respectively).
(DOCX)
S2 Table. Pearson’s r correlation from the Mantel test between Pairwise Beta Diversity matrices and distance matrices for environmental gradients in forest cover, evaluated at different spatial scales around the crops.Bold values indicate significant correlations at the 95% confidence level.
(DOCX)
Acknowledgments
We are grateful to Francisco Fajardo, Andres García, Miguel Medrano, Blanca Rodríguez, Yeimy Cifuentes, Laura Machuca, Ernesto Samacá and Hugo Benítez for taxonomic determi-nation of plant and arthropods. Thanks to Cástor Guisande for his help with data analysis and to Patricia Riveros and María Claudia Franco for providing landscape data. We are grateful to our editor and two anonymous reviewers for their suggestions to improve the manuscript.
Author Contributions
Conceived and designed the experiments: EM MAB RD. Performed the experiments: EM. Ana-lyzed the data: EM MR. Contributed reagents/materials/analysis tools: EM MAB RD. Wrote the paper: EM MR MAB RD.
References
1. Altieri MA. ¿Porque estudiar la agricultura tradicional?. Revista Clades [Internet]. 1991; 1. Available: http://www.clades.cl/revistas/1/rev1art2.htm.
2. Settle WH, Ariawan H, Astuti ET, Cahyana W, Hakim AL, Hindayana D, et al. Managing tropical rice pests through conservation of generalist natural enemies and alternative prey. Ecology. 1996; 77 (7):1975–88.
3. Kahane R, Hodgkin T, Jaenicke H, Hoogendoorn C, Hermann M, Keatinge JDH, et al. Agrobiodiversity for food security, health and income. Agronomy for Sustainable Development. 2013; 33(4):671–93. 4. Oyarzun PJ, Borja RM, Sherwood S, Parra V. Making sense of agrobiodiversity, diet, and intensification
of smallholder family farming in the highland Andes of Ecuador. Ecol Food Nutr. 2013; 52(6):515–41. doi:10.1080/03670244.2013.769099PMID:24083517
5. Grau HR, Aide M. Globalization and land-use transitions in Latin America. Ecol Soc [Internet]. 2008; 13 (2). Available:http://www.ecologyandsociety.org/vol13/iss2/art16.
6. Tscharntke T, Tylianakis JM, Rand TA, Didham RK, Fahrig L, Batary P, et al. Landscape moderation of biodiversity patterns and processes—eight hypotheses. Biol Rev Camb Philos Soc. 2012; 87(3):661– 85. doi:10.1111/j.1469-185X.2011.00216.xPMID:22272640
7. Risch SJ. Agricultural ecology and insect outbreaks. In: Barbosa P, Scultz JC, editors. Insect Out-breaks. New York: Academic Press; 1987. p. 217–38.
8. Drapela T, Moser D, G. Zaller J, Frank T. Spider assemblages in winter oilseed rape affected by land-scape and site factors. Ecography. 2008; 31(2):254–62.
9. Gurr GM, Wratten SD, Luna JM. Multi-function agricultural biodiversity: pest management and other benefits. Basic Appl Ecol. 2003; 4(2):107–16.
10. Lee JC, Heimpel GE. Floral resources impact longevity and oviposition rate of a parasitoid in the field. J Anim Ecol. 2008; 77(3):565–72. doi:10.1111/j.1365-2656.2008.01355.xPMID:18248386
12. Pluess T, Opatovsky I, Gavish-Regev E, Lubin Y, Schmidt-Entling MH. Non-crop habitats in the land-scape enhance spider diversity in wheat fields of a desert agroecosystem. Agric Ecosyst Environ. 2010; 137(1–2):68–74.
13. Rusch A, Bommarco R, Jonsson M, Smith HG, Ekbom B, Landis D. Flow and stability of natural pest control services depend on complexity and crop rotation at the landscape scale. J Appl Ecol. 2013; 50 (2):345–54.
14. Lavandero B, Wratten SD, Didham RK, Gurr G. Increasing floral diversity for selective enhancement of biological control agents: A double-edged sward? Basic Appl Ecol. 2006; 7(3):236–43.
15. Isaacs R, Tuell J, Fiedler A, Gardiner M, Landis D. Maximizing arthropod-mediated ecosystem services in agricultural landscapes: the role of native plants. Front Ecol Environ. 2009; 7(4):196–203.
16. Fiedler AK, Landis DA, Wratten SD. Maximizing ecosystem services from conservation biological con-trol: The role of habitat management. Biol Control. 2008; 45(2):254–71.
17. Tylianakis JM, Klein AM, Lozada T, Tscharntke T. Spatial scale of observation affects alpha, beta and gamma diversity of cavity-nesting bees and wasps across a tropical land-use gradient. J Biogeogr. 2006; 33(7):1295–304.
18. Holzschuh A, Steffan-Dewenter I, Tscharntke T. Agricultural landscapes with organic crops support higher pollinator diversity. Oikos. 2008; 117(3):354–61.
19. Holzschuh A, Steffan-Dewenter I, Kleijn D, Tscharntke T. Diversity of flower-visiting bees in cereal fields: effects of farming system, landscape composition and regional context. J Appl Ecol. 2007; 44 (1):41–9.
20. Clough Y, Kruess A, Tscharntke T. Local and landscape factors in differently managed arable fields affect the insect herbivore community of a non-crop plant species. J Appl Ecol. 2007; 44(1):22–8. 21. Letourneau DK, Bothwell SG, Stireman JO. Perennial habitat fragments, parasitoid diversity and
para-sitism in ephemeral crops. J Appl Ecol 2012; 49:1405–16.
22. Schmidt MH, Roschewitz I, Thies C, Tscharntke T. Differential effects of landscape and management on diversity and density of ground-dwelling farmland spiders. J Appl Ecol 2005; 42:281–7.
23. Schmidt MH, Thies C, Nentwig W, Tscharntke T. Contrasting responses of arable spiders to the land-scape matrix at different spatial scales. J Biogeogr. 2008; 35(1):157–66.
24. Gardiner MM, Landis DA, Gratton C, DiFonzo CD, O'Neal M, Chacon JM, et al. Landscape diversity enhances biological control of an introduced crop pest in the north-central USA. Ecol Appl. 2009; 19 (1):143–54. PMID:19323179
25. Chaplin-Kramer R, O'Rourke ME, Blitzer EJ, Kremen C. A meta-analysis of crop pest and natural enemy response to landscape complexity. Ecol Lett. 2011; 14(9):922–32. doi:10.1111/j.1461-0248.
2011.01642.xPMID:21707902
26. Clough Y, Holzschuh A, Gabriel D, Purtauf T, Kleijn D, Kruess A, et al. Alpha and beta diversity of arthropods and plants in organically and conventionally managed wheat fields. J Appl Ecol. 2007; 44 (4):804–12.
27. Roschewitz I, Gabriel D, Tscharntke T, Thies C. The effects of landscape complexity on arable weed species diversity in organic and conventional farming. J Appl Ecol. 2005; 42(5):873–82.
28. Armengot L, Xavier Sans F, Fischer C, Flohre A, Jose-Maria L, Tscharntke T, et al. Theβ-diversity of arable weed communities on organic and conventional cereal farms in two contrasting regions. Applied Vegetation Science. 2012; 15(4):571–9.
29. Poggio SL, Chaneton EJ, Ghersa CM. Landscape complexity differentially affects alpha, beta, and gamma diversities of plants occurring in fencerows and crop fields. Biol Conserv. 2010; 143(11):2477– 86.
30. Arroyo-Rodríguez V, Rös M, Escobar F, Melo FPL, Santos BA, Tabarelli M, et al. Plantβ-diversity in fragmented rain forests: testing floristic homogenization and differentiation hypotheses. J Ecol. 2013; 101(6):1449–58.
31. Jimenez-Valverde A, Baselga A, Melic A, Txasko N. Climate and regional beta-diversity gradients in spiders: dispersal capacity has nothing to say? Insect Conserv Divers. 2010; 3(1):51–60.
32. Clough Y, Kruess A, Kleijn D, Tscharntke T. Spider diversity in cereal fields: comparing factors at local, landscape and regional scales. J Biogeogr. 2005; 32(11):2007–14.
33. Klein AM, Steffan-Dewenter I, Tscharntke T. Rain forest promotes trophic interactions and diversity of trap-nesting Hymenoptera in adjacent agroforestry. J Anim Ecol. 2006; 75(2):315–23. PMID:16637985 34. Schmidt MH, Tscharntke T. Landscape context of sheetweb spider (Araneae: Linyphiidae) abundance
in cereal fields. J Biogeogr. 2005; 32(3):467–73.
36. Riveros P. Gestión ambiental en la actualización del Esquema de Ordenamiento Territorial en el muni-cipio de Topaipí Cundinamarca, basada en el concepto GTP. M.Sc. Thesis. Bogotá: Pontificia Univer-sidad Javeriana; 2013.
37. ESRI. Arc View 3.2 GIS. New York: Environmental Systems Research Institute, Inc.; 1999. 38. Paoletti MG, Pimentel D, Stinner BR, Stiner D. Agroecosystem biodiversity: matching production and
conservation biology. Agric Ecosyst Environ. 1992; 40:3–23.
39. Pimentel D, Krummel J. Biomass energy and soil erosion: Assessment of resource costs. Biomass. 1987; 14(1):15–38.
40. Triplehorn C, Johnson NF. Borror and Delong's Introduction to the Study of Insects. 7th edition. United States: Brooks Cole Pub Co.; 2005. 888 p.
41. Fernández F, Sharkey MJ. Introducción a los Hymenoptera de la Región Neotropical. Bogotá: Socie-dad Colombiana de Entomología y UniversiSocie-dad Nacional de Colombia; 2006. 894 p.
42. Wharton RA, Marsh PM, Sharkey MJ. Manual of the New World genera of the family Braconidae (Hymenoptera). Washington: The international Society of Hymenoptericsts; 1997. 439 p.
43. Jocqué R, Dippenaar-Schoeman AS. Spider families of the world. Second Edition. Tervuren: Royal Museum of Central Africa; 2007.
44. Kaston BJ. How to know spiders. The pictured key nature series. Third edition. Dubuque IA: Wm C. Brown Company; 1978. 272 p.
45. Colwell RK. EstimateS: Statistical estimation of species richness and shared species from samples. Version 8.2. User's Guide and application. Available:http://purl.oclc.org/estimates. 2009.
46. Chao A, Jost L. Coverage-based rarefaction and extrapolation: standardizing samples by complete-ness rather than size. Ecology. 2012; 93(12):2533–47. PMID:23431585
47. Jost L. Entropy and diversity. Oikos. 2006; 113(2):363–75.
48. Jost L. Partitioning diversity into independent alpha and beta components. Ecology. 2007; 88 (10):2427–39. PMID:18027744
49. Taylor KE. Summarizing multiple aspects of model performance in a single diagram. J Geophys Res. 2001; 106:7183–92.
50. Zuckerberg B, Desrochers A, Hochachka WM, Fink D, Koenig WD, Dickinson JL. Overlapping land-scapes: A persistent, but misdirected concern when collecting and analyzing ecological data. J Wild Manage. 2012; 76(5):1072–80.
51. Chen X, Ender P, Mitchell M, Wells C. Regression with Stata. 2003. Available:http://www.ats.ucla.edu/ stat/stata/webbooks/reg/default.htm. Accessed 24 July 2013.
52. Crawley M. Statistical Computing: an introduction to Data Analysis using S-Plus. Chichester, West Sussex, England: John Wiley & Sons, Ltd; 2002.
53. R_Development_Core_Team. R: A Language and Environment for Statistical Computing. Vienna, Austria. Available:http://www.R-project.org. 2008.
54. Fahrig L, Girard J, Duro D, Pasher J, Smith A, Javorek S, et al. Farmlands with smaller crop fields have higher within-field biodiversity. Agric Ecosyst Environ. 2015; 200(0):219–34.
55. Fahrig L, Baudry J, Brotons L, Burel F, Crist TO, Fuller RJ, et al. Functional landscape heterogeneity and animal biodiversity in agricultural landscapes. Ecol Lett. 2011; 14:101–12. doi:
10.1111/j.1461-0248.2010.01559.xPMID:21087380
56. Franke AC, Lotz LAP, Van Der Burg WJ, Van Overbeek L. The role of arable weed seeds for agroeco-system functioning. Weed Res. 2009; 49(2):131–41.
57. Clough Y, Putra DD, Pitopang R, Tscharntke T. Local and landscape factors determine functional bird diversity in Indonesian cacao agroforestry. Biol Conserv. 2009; 142(5):1032–41.
58. Wyckhuys KAG, O'Neil RJ. Influence of extra-field characteristics to abundance of key natural enemies of Spodoptera frugiperda Smith (Lepidoptera: Noctuidae) in subsistence maize production. Interna-tional Journal of Pest Management. 2007; 53(2):89–99.
59. Fernandes GW, Price PW. Biogeographical gradients in galling species richness: test of hypotheses. Oecologia. 1988; 76:161–7.
60. Lewinsohn TM, Roslin T. Four ways towards tropical herbivore megadiversity. Ecol Lett. 2008; 11 (4):398–416. doi:10.1111/j.1461-0248.2008.01155.xPMID:18248447
61. de Souza Mendonça JM. Plant diversity and galling arthropod diversity searching for taxonomic pat-terns in an animal-plant interaction in the Neotropics. Bol Soc Argent Bot. 2007; 42(3–4):347–57. 62. Price PW, Denno RF, Eubanks MD, Finke DL, Kaplan I. Insect ecology. Behavior, populations and
63. Navas ML. Trait-based approaches to unravelling the assembly of weed communities and their impact on agro-ecosystem functioning. Weed Res. 2012; 52(6):479–88.
64. Western AW, Grayson RB, Bloschl G. Scaling of soil moisture: A hydrologic perspective. Annu Rev Earth Planet Sci. 2002; 30:149–80.
65. Callaway RM, Walker LR. Competition and Facilitation: A Synthetic Approach to Interactions in Plant Communities. Ecology. 1997; 78(7):1958–65.
66. Sobek S, GoßNer MM, Scherber C, Steffan-Dewenter I, Tscharntke T. Tree diversity drives abundance and spatiotemporalβ-diversity of true bugs (Heteroptera). Ecol Entomol. 2009; 34(6):772–82. 67. Sieving KE, Wilson M, De Santo T. Habitat barriers to movement of understory birds in fragmented
South-Temperate Rainforest. Auk. 1996; 113:944–9.
68. Fereres A. Barrier crops as a cultural control measure of non-persistently transmitted aphid-borne viruses. Virus Res. 2000; 71:221–31. PMID:11137174
69. Limberger R, Wickham SA. Transitory versus persistent effects of connectivity in environmentally homogeneous metacommunities. PloS one. 2012; 7(8):e44555. doi:10.1371/journal.pone.0044555 PMID:22952993
70. Limberger R, Wickham SA. Disturbance and diversity at two spatial scales. Oecologia. 2012; 168 (3):785–95. doi:10.1007/s00442-011-2140-8PMID:21971585