Submitted25 November 2015 Accepted 5 February 2016 Published1 March 2016 Corresponding author
Soraya Villalobos, [email protected]
Academic editor Richard Cowling
Additional Information and Declarations can be found on page 15
DOI10.7717/peerj.1740
Copyright
2016 Villalobos and Vamosi
Distributed under
Creative Commons CC-BY 4.0 OPEN ACCESS
Increasing land use drives changes
in plant phylogenetic diversity and
prevalence of specialists
Soraya Villalobos and Jana C. Vamosi
Department of Biological Sciences, University of Calgary, Calgary, Alberta, Canada
ABSTRACT
Increased human land use has resulted in the increased homogenization of biodiversity between sites, yet we lack sufficient indicators to predict which species decline and the consequence of their potential loss on ecosystem services. We used comparative phylo-genetic analysis to (1) characterize how increasing conversion of forest and grasslands to grazing pasturelands changes plant diversity and composition; (2) examine how changes in land use relate to declines in functional trait diversity; and (3) specifically investigate how these changes in plant composition affect the prevalence of zygomorphy and the possible consequences that these changes may have on pollinator functional groups. As predicted, we found that the conversion to grazing pasturelands negatively impacted species richness and phylogenetic composition. Clades with significantly more represented taxa in grasslands (GL) were genera with a high representation of agricultural weeds, while the composition was biased towards clades of subalpine herbaceous wildflowers in Mixed Forest (MF). Changes in community composition and structure had strong effects on the prevalence of zygomorphic species likely driven by nitrogen-fixing abilities of certain clades with zygomorphic flowers (e.g., Fabaceae). Land conversion can thus have unexpected impacts on trait distributions relevant for the functioning of the community in other capacities (e.g., cascading effects to other trophic levels (i.e., pollinators). Finally, the combination of traits represented by the current composition of species in GL and MF might enhance the diagnostic value of productivity and ecosystem processes in the most eroded ecosystems.
SubjectsBiodiversity, Ecology, Ecosystem Science, Plant Science
Keywords Phylogenetic community structure, Functional diversity, Trait composition, Pollinator specialization
INTRODUCTION
the large effects of traits on ecosystem functioning, we are only beginning to understand how critical traits connect with land use changes (Clough et al., 2014).
With habitat modification, ecosystems face not only reduction of number of species, but also the loss of the ecological interactions that maintain ecosystem function (Wittmann et al., 2008;Letcher, 2010;Valiente-Banuet et al., 2014). Grasslands in particular have recently been noted as especially susceptible to land use changes (Weiner et al., 2011), with the effects on plant species composition having consequences to plant–pollinator mutualisms (Clough et al., 2014). In particular, emerging studies indicate the loss of more specialised species due to their highly vulnerability to habitat loss (Weiner et al., 2011;
Dulvy et al., 2014).
In flowering plants, zygomorphy (i.e., bilateral symmetry) is though to serve as an adequate surrogate for functional group specialization of pollinators (Davila et al.,
2012;Vamosi et al., 2014). The strong association between floral zygomorphy and insect
pollinator accessibility is mostly promoted by the morphological restrictions that allow certain pollinator types to visit them (i.e., flies are generally not sufficiently versatile to visit restrictive flowers such as that presented by zygomorphic species;Vamosi et al., 2014). In this sense, flowers with bilateral symmetry are more ecologically specialized in their species-specific functional role (Eltonian’s perspective,Devictor et al., 2010): they establish a specialized pollinator system where pollinator assemblages are primarily shaped by size or tongue length (Gong & Huang, 2009). Previous studies have been equivocal with regard of the extent to which the functions that specialists perform in the ecosystem is insured by more generalist species (i.e., functional redundancy) (Bascompte, Jordano & Olesen, 2006;
Cadotte, Cardinale & Oakley, 2008;Devictor et al., 2010). While some authors hypothesize that generalists provide a buffer for the current erosion of biodiversity (Costanza & Mageau, 1999; Scheffer et al., 2015), more recent studies suggests that species with a particular combination of traits may support more functions that cannot be supplied by species with more generalists habits (Manning et al., 2015;Walker, 2015).
Theoretical and experimental studies highlight that functional trait diversity can explain more variation in ecological processes that other types of biodiversity metrics (e.g., species richness) (Cadotte et al., 2009;Srivastava et al., 2012;Pellissier et al., 2014). Phylogenies are rapidly developing as a useful tool to summarize these functional traits (Cadotte et al., 2009;Faith, 2015), but are based on the assumption that closely related species are more ecologically similar than distantly related (i.e., share ecological roles). If there is a strong phylogenetic signal in the traits that determine ecosystem functioning (Flynn et al., 2011), patterns of phylogenetic diversity can be utilized to address key questions about functional differences related to ecosystem functions (i.e., biological, physical and geochemical processes that occur within an ecosystem).
Egorov et al., 2014; Mi et al., 2015), and rarity is often used as proxy for habitat specialisation, there are fewer studies that examine biotic specialization (Dorado et al., 2015). Zygomorphy, viewed as a functional trait, offers one trait that allows for some examination of how biotic specialization associates with disturbance because zygomorphic species allow visits from fewer functional groups of pollinators (Vamosi et al., 2014). Furthermore, we can quantify how a functional trait contributes to the overall phylogenetic community structure patterns if we detect a phylogenetic signal in its distribution within the assemblage (Mi et al., 2015) and predict how this might affect higher trophic levels.
For effective land management, we need to understand how restoration efforts will be impeded by trait changes produced by increases in land use intensity and forest fragmentation. We currently lack sufficient indicators to predict which species will be most affected and what consequence their potential loss will have on ecosystem services (Garnier & Navas, 2011;Cardinale et al., 2012). The identification of vulnerable clades, a major goal of conservation prioritization, is still largely based on trial and error due to the lack of comparative metrics that effectively capture the range of morphological and ecological diversity that species contain (Gossner et al., 2014). This study aims to the contribute to the identification of traits with functional properties that change in response to environmental conditions (Ricotta et al., 2015;Cadotte et al., 2015).
To better understand how trait diversity changes with land use, we characterize the effect of land conversion on reducing plant phylogenetic diversity and proportion of zygomorphic species (i.e., specialists) of plant communities in Southern Alberta.
Explicitly, we explore whether: (1) increasing land use (specifically, conversion of forest and grasslands to grazing pasturelands) is correlated with changes in plant species diversity and composition; (2) changes in land use relate to declines in phylogenetic diversity and community structure; and (3) declines in phylogenetic diversity relate to declines in diversity of a trait, such as zygomorphy, that potentially offers an indicator towards predicting the vulnerability of plant assemblages.
METHODS
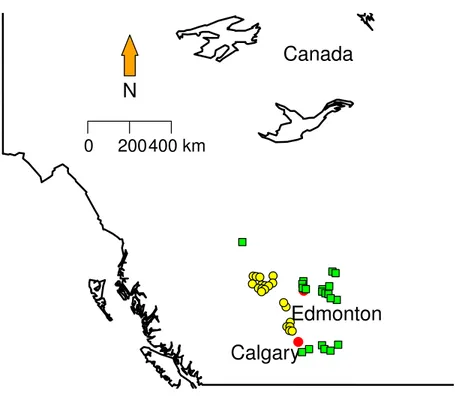
Plant communityWe compiled a database of flowering plant communities using The Alberta Biodiversity Monitoring Institute (ABMI) vascular plant lists. ABMI has collected information about terrestrial ecosystems visiting approximately 330 sites each year, five times throughout spring and summer in the entire province of Alberta (http://www.abmi.ca). The survey for vascular plants was carried out delimiting a 1-hectare area surrounding the site centre and further dividing it into 50×50 m quadrants, where all plants were observed and collected
at the site (http://www.abmi.ca/abmi/rawdata/rawdataselection.jsp). Using the 20 km National Forest Inventory (NFI) grid, 10 Eco-regions were defined based on the dominant plant community present or inferring that would have been present pre-disturbance. Taxonomical identification of plants was recordedin situ and vouchers of specimens deposited in the multiple collections in each site.
Figure 1 Sampling localities.Green squares correspond to Grassland (GL) communities and yellow tri-angles represent Mixed Forest (MF).
means) for collection dates in each collection sites were obtained from Environment Canada weather stations (http://climate.weather.gc.ca/prods_servs/cdn_climate_summary_e. html).
Land use
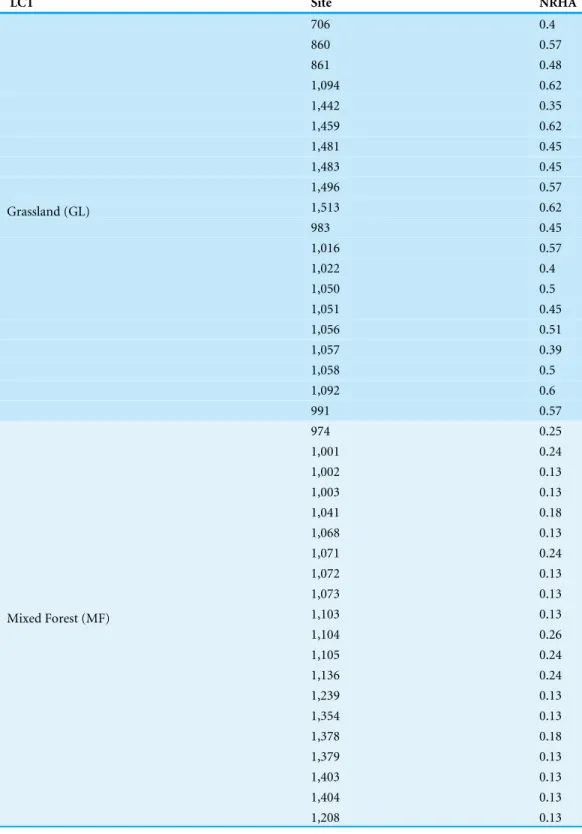
Table 1 Land conversion index.Normalized Rangeland Health Assessment (NRHA) score for each land cover site.
LCT Site NRHA
706 0.4
860 0.57
861 0.48
1,094 0.62
1,442 0.35
1,459 0.62
1,481 0.45
1,483 0.45
1,496 0.57
1,513 0.62
983 0.45
1,016 0.57
1,022 0.4
1,050 0.5
1,051 0.45
1,056 0.51
1,057 0.39
1,058 0.5
1,092 0.6
Grassland (GL)
991 0.57
974 0.25
1,001 0.24
1,002 0.13
1,003 0.13
1,041 0.18
1,068 0.13
1,071 0.24
1,072 0.13
1,073 0.13
1,103 0.13
1,104 0.26
1,105 0.24
1,136 0.24
1,239 0.13
1,354 0.13
1,378 0.18
1,379 0.13
1,403 0.13
1,404 0.13
Mixed Forest (MF)
approaches zero with low land conversion levels and approaches 1 when land conversion is at maximum.
RHAn=Nmax−n
Nmax .
Here,Nmax is the maximum RHA score (100), and n is the observed RHA per site.
Phylogenetic community structure and trait distribution
We generated a regional plant phylogeny using the online software Phylomatic (Webb & Donoghue, 2005) for all plant species in the dataset. The tree contains 896 species for which we have community occurrence data. To time-calibrate the branch lengths on the phylogeny, we applied ‘wikstrom’ ages to internal nodes (Wikstrom, Savolainen & Chase, 2001) with the BLADJ algorithm. Phylomatic provides only a rough approximation of the phylogeny, which could substantially affect our results, specifically in the estimation of phylogenetic signal (Davies et al., 2012). We use metrics that are robust to phylogenetic signal however (MPD and MNTD), such that estimates of branch lengths would not greatly change the qualitative results on phylogenetic structure (Cadotte, 2015).
For floral symmetry we hypothesized that the increasing land use reduces the presence of specialist (i.e., zygomorphic) plant species, selecting species with more generalist (i.e., actinomorphic) habits. The phylogenetic signal in zygomorphy was estimated within GL and MF with Blomberg’s K statistic (Blomberg, Garland & Ives, 2003), using the function Kcal in ‘picante’ version 1.6-2, R package (Kembel, 2009). K values close to zero indicate that a trait exhibits a random distribution on the phylogeny, whileK values greater than 1 indicate a strong phylogenetic signal. The significance level was assessed by comparing observed branch length distance between species with the trait to a null model of shuffling taxa labels across the tips of phylogeny (Blomberg, Garland & Ives, 2003).
The phylogenetic structure was calculated using Mean Pairwise Distance (MPD) and Mean Nearest Taxon Distance (MNTD) in the package vegan in R version 3.0.2 (Oksanen
et al., 2013;R Core Team, 2013). Standardized effect sizes were calculated for MPD and
MNTD by comparing the observed phylogenetic relatedness to a null model generated by using the option ‘phylogeny shuffle’ that randomizes phylogenetic relationships among species (Webb, 2000).
We used multiple linear regression to analyze the relationship between plant phylogenetic diversity, land conversion and climatic variables (temperature and precipitation) for all species, as well as for the group of zygomorphic present in each plant community. The land cover type was used as a factor to assess how phylogenetic diversity change across land conversion. To evaluate whether the land use conversion has different effects in the different land cover types, we compare the regression lines with an ANCOVA by testing the significance of the interaction Land Cover Type (LCT)×Land Use Conversion (LUC).
RESULTS
Species composition
Without taking phylogenetic relationships into account, the most protected sites (LUC 0–0.5) hosted higher average total species richness and more zygomorphic species (39.8 species and 6.9 zygomorphic species) than the most land converted sites (20.3 species and 3.7 zygomorphic species). These differences were significant in terms of the total species richness (t=5.407,df =10,p-value=0.0003) and the richness of zygomorphic species
(t=2.66,df =6,p-value=0.02) between plant communities with low and high LUC
index (Table 1). Likewise the proportion of zygomorphic species increased with land use conversion (χ2=0.08,df =1,P>0.05).
As predicted, the taxonomic and phylogenetic composition between the two land cover types was significantly different (Adonis analysis: F1, 38=10.099;r2=0.20997;p=0.001;
F1, 38=1.8302;r2=0.04595;p=0.001). Positive spatial autocorrelation was observed in
plant species composition (Monte-Carlo Mantel test; Observation: 0.16;p=0.00057).
Phylogenetic community structure and land conversion
Overall, we found strong phylogenetic signal for zygomorphy in our regional phylogeny (K=1.408p-value=0.006). Forest (MF) and grasslands (GL) had very different levels of
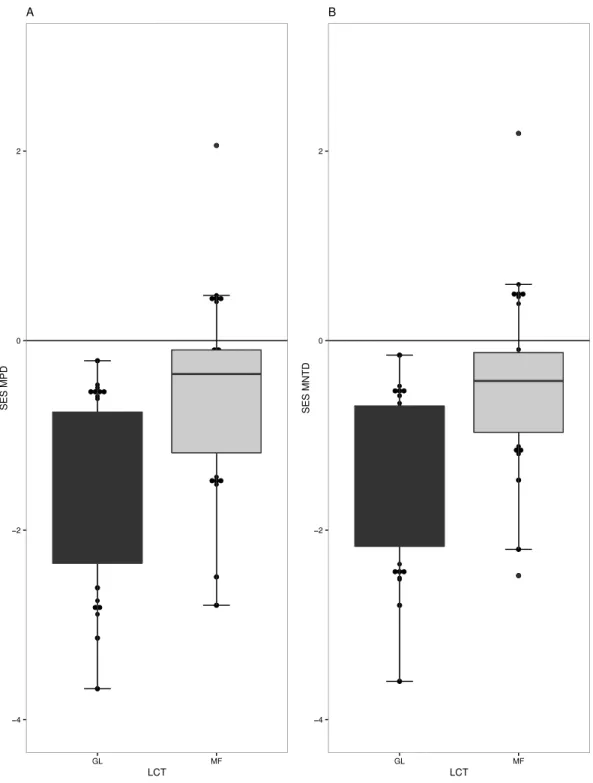
phylogenetic structure in their respective plant communities. GL communities generally have phylogenetic clustering in species (t= −6.5536,df =18,p-value=3.70−06) (Fig.
2A), especially when only the subset of zygomorphic species was examined (−2.44df =18,
p-value = 0.02). Similarly, when account on the terminal phylogenetic composition
of communities (mean nearest taxon diversity MNTD), GL and MF showed patterns of significant clustering (t = −6.80,df =18,p-value =2.26−06,t= −2.34,df =18,
p-value=0.03) (Fig. 2B).
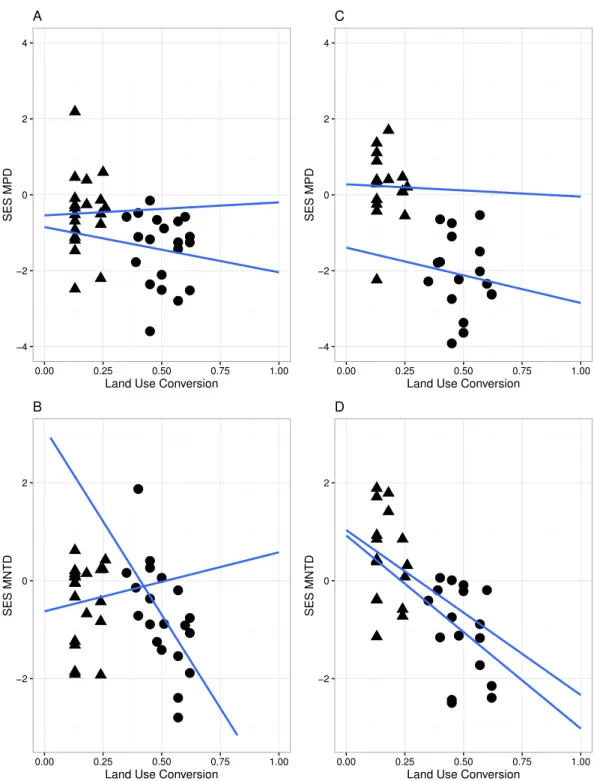
A significant relationship between the variables in the linear regression model (Fig. 3) indicated that land conversion has a strong negative effect on MPD for all species in the community (r= −4.565,P<0.05) as well as for zygomorphic assemblages (r= −6.279,
Figure 2 Measures of phylogenetic community structure for two land cover types (LCT), Grassland (GL) and Mixed Forest (MF).GL and MF communities have phylogenetic clustering in species when (A) phylogenetic diversity was compared to that expected from a null phylogeny, SES MPD (P<0.05), and
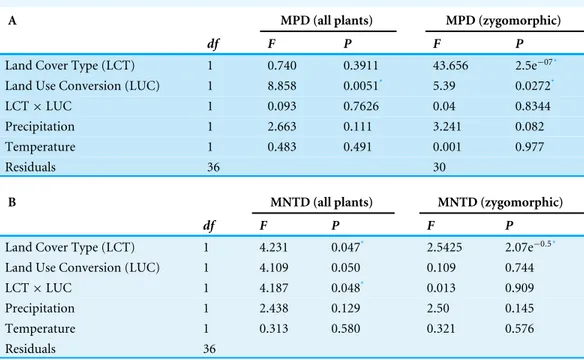
Table 2 Effect of climatic variables, land cover type, land use conversion and its interaction on phylo-genetic diversity (A) MPD (mean pairwise distance) and (B) MNTD (mean nearest taxon distance).
A MPD (all plants) MPD (zygomorphic)
df F P F P
Land Cover Type (LCT) 1 0.740 0.3911 43.656 2.5e−07*
Land Use Conversion (LUC) 1 8.858 0.0051* 5.39 0.0272*
LCT×LUC 1 0.093 0.7626 0.04 0.8344
Precipitation 1 2.663 0.111 3.241 0.082
Temperature 1 0.483 0.491 0.001 0.977
Residuals 36 30
B MNTD (all plants) MNTD (zygomorphic)
df F P F P
Land Cover Type (LCT) 1 4.231 0.047* 2.5425 2.07e−0.5*
Land Use Conversion (LUC) 1 4.109 0.050 0.109 0.744
LCT×LUC 1 4.187 0.048* 0.013 0.909
Precipitation 1 2.438 0.129 2.50 0.145
Temperature 1 0.313 0.580 0.321 0.576
Residuals 36
Notes.
*Significant valueP<0.05
(r= −5.197, p<0.05), while the non-significant LCT× LUC interaction (Table 2)
indicated that the rate of MPD and MNTD decline with land conversion did not depend on the different land cover types for all species and zygomorphic species. Likewise, the rate of MPD and MNTD decline were not explained by the variation in temperature and precipitation between the two vegetation types (Table 2).
Phylogenetic compositional changes
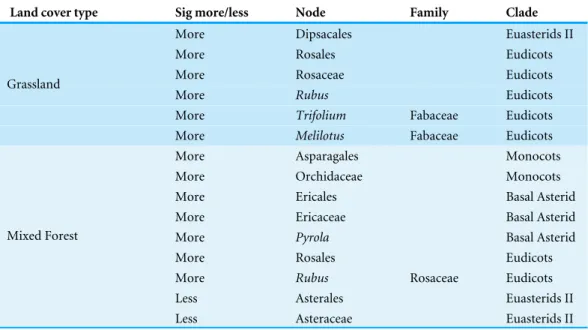
Thenodesig analysis indicated that disproportionately represented clades in GL plant communities were clades of predominantly ruderal species and those with berries (Trifolium,MelilotusandRubus) (Table 3 andFig. 4). Likewise, clades that significantly contribute to the phylogenetic structure in Mixed Forest are mostly clades of subalpine herbaceous wildflowers. Overrepresented clades correspond to ‘‘wintergreen’’ berries with shaded moist wood habit (Asparagales, Ochidaceae, Ericaceae) (Table 3). Asteraceae were significantly underrepresented in the MF plant community.
Table 3 Clades significantly contributing to the community structure in Grassland and Mixed Forest plant community (Phylocom procedurenodesig;Webb, Ackerly & Kembel, 2008).
Land cover type Sig more/less Node Family Clade
More Dipsacales Euasterids II
More Rosales Eudicots
More Rosaceae Eudicots
More Rubus Eudicots
More Trifolium Fabaceae Eudicots
Grassland
More Melilotus Fabaceae Eudicots
More Asparagales Monocots
More Orchidaceae Monocots
More Ericales Basal Asterid
More Ericaceae Basal Asterid
More Pyrola Basal Asterid
More Rosales Eudicots
More Rubus Rosaceae Eudicots
Less Asterales Euasterids II
Mixed Forest
Less Asteraceae Euasterids II
Table 4 Clades composition with low and high land use conversion (LUC) score (Phylocom procedure
nodesig;Webb, Ackerly & Kembel, 2008).
Land use conversion Sig more/less Node Family Clade
More Dipsacales Euasterids II
More Caprifoliaceae Asterids
More Ericales Basal Asterid
More Ericaceae Basal Asterid
More Malpighiales Rosid
More Hieracium Asteraceae Asterids
LUC score under 0.5
Less Monocots
More Medicago Fabaceae Eudicots
LUC Score above 0.51
More Trifolium Fabaceae Eudicots
DISCUSSION
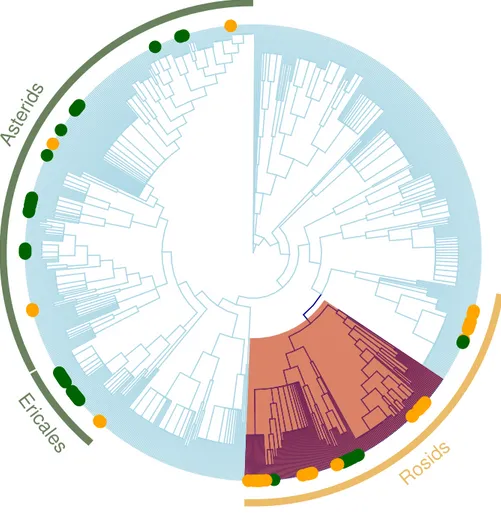
Figure 4 Regional plant phylogeny with 891 species.Green circles correspond to species of the impor-tant clades in less altered communities (LUC < 0.05) and yellow circles represents imporimpor-tant clades in highly altered communities (LUC > 0.05; seeTable 4). Red shading band indicates nitrogen-fixing clade within Rosids, which we speculate is an important factor contributing to why these clades are significantly more represented in the more disturbed areas. Green bands correspond to Ericales and Asterids clades that were more represented in the more protected zones.
(Perrings et al., 2011; Worm et al., 2015) as well as the phylogenetic underpinnings of these trait changes. Identification of the particular clades with non-random patterns of phylogenetic structure indicate that the changes in the prevalence of zygomorphy are possibly driven by habitat filtering for nitrogen-fixing species, where zygomorphic flowers happen to be prevalent (e.g., Fabaceae;Fig. 4). Land conversion can thus have unexpected impacts on trait distributions relevant for the functioning of the community in other capacities (e.g., maintaining healthy populations of pollinators).
by traits that are represented disproportionately in these clades due to their influence on survival, growth and reproduction under differing conditions (Kembel, 2009). Low MPD in the more converted zones may suggest that disturbance promotes the selection of close relatives with similar environmental requirements (Webb et al., 2002). In our system, the overrepresentation of members of the nitrogen-fixing clade in the rosids (Werner et al., 2014) in most disturbed sites is likely indicative of the important functional role of nitrogen-fixing in highly converted sites, with any associated traits that are predominant in this clade effectively hitchhiking to greater prevalence.
That we found parallel patterns of increased phylogenetic clustering with disturbance in our zygomorphic subset suggests that zygomorphy was not the key trait that habitat selection was acting upon, yet would potentially have consequences for downstream habitat selection of certain pollinator functional groups (e.g., flies cannot readily forage on zygomorphic flowers). Clearly, zygomorphy is not the only floral trait that restricts certain functional groups of pollinators. For example, many species of Caprifoliaceae have tubular actinomorphic flowers that also restrict short-tongued flies from visiting and species in this clade were restricted to low LUC sites (see Table 4). Thus, while an understanding of phylogeny and traits can allow us to better predict how communities will change with disturbance, future analyses will require more complete knowledge of how a number of traits change, as well as the downstream consequences of these changes.
Through an understanding of traits, we can begin to predict how these compositional changes might affect other aspects of ecosystem functioning. The decrease in phylogenetic diversity observed in disturbed GL and MF sites points out that, upon disturbance, flowering plant communities are offering pollinators increasingly similar suites of floral resources (Blomberg, Garland & Ives, 2003). We found this to be true even when only the subset of zygomorphic species were analysed. Hence, the ecological functions that functionally diverse communities perform, including those unmeasured traits for which the phylogeny account for (e.g., hosting diverse pollinator communities) (Cadotte, Cardinale & Oakley,
2008;Flynn et al., 2011), would not being provided by the narrow phylogenetic breadth of
the disturbed assemblages. In other words, like observed inAllan et al. (2014)andAllan et al. (2015), some specialist species thrive in disturbed environments. However, the potential consequence of these changes in composition is that, for these two particular types of plant communities, the reduction to a community of specialists at the plant trophic level, is that the combination of functional traits (i.e., functional redundancy) are likely reduced, which may cascade into a lower phylogenetic diversity of pollinators supported (Adderley & Vamosi, 2015).
often restricted from visiting zygomorphic flowers (Vamosi et al., 2014). Whether this individual trait can be used to capture the functioning of ecosystems in other aspects will require further experimental tests to determine the extent to which this specific trait represents an indicator of other ecosystem processes (e.g., contribution to the seed set production, total biomass). Floral morphological barriers that bear direct relationship with pollination and seed set production may enhance the diagnostic value of productivity if we quantify the flux of multiple services from the plant to the ecosystem (Garnier & Navas, 2011). Therefore, ecosystem processes could be estimated from this relevant (and readily identifiable) trait.
Our study uncovered no significant differences in the responses with land use between community types (MF vs. GL) suggesting that the effect of disturbance is not context dependent (although GL sites typically had higher levels of LUC than ML sites). Our findings in contrast with previous observational and experimental studies thus far, likely influenced by differences in sample size, historical land use record and taxonomic scales (Newbold et al., 2012;Egorov et al., 2014;Pellissier et al., 2014). For example, grasslands are host to extremely high local species richness, yet have lower betadiversity than forests (Wilson et al., 2012). Thus, conversion of forest to pasturelands is not necessarily correlated with declines in local plant species diversity (Egorov et al., 2014) yet our study indicates will experience greater changes in phylogenetic and functional composition. Future studies should examine more traits separately in order to establish which specific traits or combination of them may increase the diversity of the more eroded zones.
In summary, although it has been hypothesized that species poor communities may be composed of distantly related species (Helmus et al., 2010), we find more clustered assemblages in the more disturbed (and species-poor) sites. Dissecting the compositional changes involved with changes in species richness reveal that having closely related species could be a result of an increased representation of angiosperm clades that benefit in poor soils (the nitrogen fixing clade in Rosids in particular). This shift in community composition has downstream consequences in that this clade is represented by many zygomorphic species, that are largely floral resources for the bee functional group of pollinators and excludes many less versatile pollinators (Vamosi et al., 2014). While specialist plant species may be beneficial for bees, this composition shift may still result in an accelerated loss of species. Establishment of plant communities with high trait diversity in floral traits should be a consideration for rapid restoration of the converted landscapes.
CONCLUSIONS
2015), understanding the causes of changes to floral resource diversity will become a topic of increasing importance.
ACKNOWLEDGEMENTS
We thank Dylan Cole and Dan King for assistance in data processing as well as two anonymous reviewers for providing valuable commentary on a previous version of the manuscript.
ADDITIONAL INFORMATION AND DECLARATIONS
Funding
Funding for this project was provided through Natural Sciences and Engineering Research of Council of Canada grants to JCV. The funders had no role in study design, data collection and analysis, decision to publish, or preparation of the manuscript.
Grant Disclosures
The following grant information was disclosed by the authors: Natural Sciences and Engineering Research of Council of Canada.
Competing Interests
Jana C. Vamosi is an Academic Editor for PeerJ.
Author Contributions
• Soraya Villalobos conceived and designed the experiments, analyzed the data, contributed
reagents/materials/analysis tools, wrote the paper, prepared figures and/or tables, reviewed drafts of the paper.
• Jana C. Vamosi conceived and designed the experiments, analyzed the data, contributed
reagents/materials/analysis tools, wrote the paper, reviewed drafts of the paper.
Data Availability
The following information was supplied regarding data availability: Raw data are provided asSupplemental Information.
Supplemental Information
Supplemental information for this article can be found online athttp://dx.doi.org/10.7717/ peerj.1740#supplemental-information.
REFERENCES
Adderley LJ, Vamosi JC. 2015.Species and phylogenetic heterogeneity in visitation affects reproductive success in an Island system.International Journal of Plant Sciences176:186–196 DOI 10.1086/679617.
Alberta Monitoring Institute (ABMI). 2014.Scope and application of the ABMI’s data and information.Available athttp:// www.abmi.ca/ home/ data/
welcome-data-portal.html.
Allan E, Bossdorf O, Dormann CF, Prati D, Gossner MM, Tscharntke T. 2014.
Interannual variation in land-use intensity enhances grassland multidiversity. Proceedings of the National Academy of Sciences of the United States of America 308–313DOI 10.1073/pnas.1312213111.
Allan E, Manning P, Alt F, Binkenstein J, Blaser S, Blüthgen N, Böhm S, Grassein F, Hölzel N, Klaus VH, Kleinebecker T, Morris EK, Oelmann Y, Prati D, Renner SC, Rillig MC, Schaefer M, Schloter M, Schmitt B, Schöning I, Schrumpf M, Solly E, Sorkau E, Steckel J, Steffen-Dewenter I, Stempfhuber B, Tschapka M, Weiner CN, Weisser WW, Werner M, Westphal C, Wilcke W, Fischer M. 2015.Land use inten-sification alters ecosystem multifunctionality via loss of biodiversity and changes to functional composition.Ecology Letters18:834–843DOI 10.1111/ele.12469.
Bascompte J, Jordano P, Olesen JM. 2006.Asymmetric coevolutionary networks facilitate biodiversity maintenance.Science312:431–433.
Blomberg SP, Garland T, Ives AR. 2003.Testing for phylogenetic signal in comparative data: behavioral traits are more labile.Evolution57:717–745
DOI 10.1111/j.0014-3820.2003.tb00285.x.
Cadotte MW. 2015.Phylogenetic diversity ecosystem function relationships are insensi-tive to phylogenetic edgelengths.Functional Ecology29:718–723
DOI 10.1111/1365-2435.12429.
Cadotte MW, Arnillas CA, Livingstone SW, Yasui S-LE. 2015.Predicting communities from functional traits.Trends in Ecology & Evolution30:510–511
DOI 10.1016/j.tree.2015.07.001.
Cadotte MW, Cardinale BJ, Oakley TH. 2008.Evolutionary history and the effect of biodiversity on plant productivity.Proceedings of the National Academy of Sciences of the United States of America105:17012–17017.
Cadotte MW, Cavender-Bares J, Tilman D, Oakley TH. 2009.Using phylogenetic, func-tional and trait diversity to understand patterns of plant community productivity. PLoS ONE4:e5695DOI 10.1371/journal.pone.0005695.
Cardinale BJ, Duffy JE, Gonzalez A, Hooper DU, Perrings C, Venail P, Narwani A, Mace GM, Tilman D, Wardle DA, Kinzig AP, Daily GC, Loreau M, Grace JB, Larigauderie A, Srivastava DS, Naeem S. 2012.Biodiversity loss and its impact on humanity.Nature486:59–67DOI 10.1038/nature11148.
Colles A, Liow LH, Prinzing A. 2009.Are specialists at risk under environmental
change? Neoecological, paleoecological and phylogenetic approaches.Ecology Letters
12:849–863DOI 10.1111/j.1461-0248.2009.01336.x.
Costanza R, Mageau M. 1999.What is a healthy ecosystem?Aquatic Ecology33:105–115
DOI 10.1023/A:1009930313242.
Davies JT, Kraft NJB, Salamin N, Wolkovich EM. 2012.Incompletely resolved phylo-genetic trees inflate estimates of phylophylo-genetic conservatism.Ecology 93:242–247
DOI 10.1890/11-1360.1.
Davila YC, Elle E, Vamosi JC, Hermanutz L, Kerr JT, Lortie CJ, Westwood AR, Woodcock TS. 2012.Ecosystem services of pollinator diversity?: a review of the relationship with pollen limitation of plant reproduction.Botany90:535–543
DOI 10.1139/b2012-017.
Devictor V, Clavel J, Julliard R, Lavergne S, Mouillot D, Thuiller W, Venail P, Villéger S, Mouquet N. 2010.Defining and measuring ecological specialization.Journal of Applied Ecology 47:15–25DOI 10.1111/j.1365-2664.2009.01744.x.
Dorado J, Vázquez DP, Stevani EL, Chacoff NP, Vazquez P. 2015.Rareness and specialization in plant—pollinator networks.Ecological Society of America92:19–25
DOI 10.1890/10-0794.1.
Dulvy NK, Fowler SL, Musick JA, Cavanagh RD, Kyne PM, Harrison LR, Carlson JK, Davidson LN, Fordham SV, Francis MP, Pollock CM, Simpfendorfer CA, Burgess GH, Carpenter KE, Compagno LJ, Ebert DA, Gibson C, Heupel MR, Livingstone SR, Sanciangco JC, Stevens JD, Valenti S, White WT. 2014.Extinction risk and conservation of the world’s sharks and rays.eLife3:1–34DOI 10.7554/eLife.00590.
Egorov E, Prati D, Durka W, Michalski S, Fischer M, Schmitt B, Blaser S, Brändle M. 2014.Does land-use intensification decrease plant phylogenetic diversity in local grasslands?PLoS ONE 9:e103252DOI 10.1371/journal.pone.0103252.
Faith DP. 2015.Phylogenetic diversity, functional trait diversity and extinction: avoiding tipping points and worst case losses.Philosophical Transactions of the Royal Society B: Biological Sciences370:20140011DOI 10.1098/rstb.2014.0011.
Flynn D, Mirotchnick N, Jain M, Palmer MI, Naeem S. 2011.Functional and phyloge-netic diversity as predictors of biodiversity ecosystem function relationships.Ecology
92:1573–1581.
Garnier E, Navas M-L. 2011.A trait-based approach to comparative functional plant ecology: concepts, methods and applications for agroecology. A review.Agronomy for Sustainable Development 32:365–399.
Gong Y-B, Huang S-Q. 2009.Floral symmetry: pollinator-mediated stabilizing selection on flower size in bilateral species.Proceedings of the Royal Society B: Biologial Sciences
276:4013–4020DOI 10.1098/rspb.2009.1254.
Helmus MR, Keller W, Paterson MJ, Yan ND, Cannon CH, Rusak JA. 2010. Commu-nities contain closely related species during ecosystem disturbance.Ecology Letters
13:162–174DOI 10.1111/j.1461-0248.2009.01411.x.
Kembel SW. 2009.Disentangling niche and neutral influences on community assembly: assessing the performance of community phylogenetic structure tests.Ecology Letters
12:949–960DOI 10.1111/j.1461-0248.2009.01354.x.
Kerr JT, Pindar A, Galpern P, Packer L, Potts SG, Roberts SM, Rasmont P, Schweiger O, Colla SR, Richardson LL, Wagner DL, Gall LF. 2015.Climate change impacts on bumblebees converge across continents.Science349:177–180.
Letcher SG. 2010.Phylogenetic structure of angiosperm communities during tropical forest succession.Proceedings of the Royal Society B: Biologial Sciences277:97–104
DOI 10.1098/rspb.2009.0865.
Manning P, Gossner MM, Bossdorf O, Allan E, Zhang YY, Prati D, Blüthgen N, Boch S, Böhm S, Börschig C, Hölzel N, Jung K, Klaus VH, Klein AM, Kleinebecker T, Krauss J, Lange M, Müller J, Pˇasalíc E, Socher SA, Tschapka M, Türke M, Weiner C, Werner M, Gockel S, Hemp A, Renner SC, Wells K, Oisbuscot F, Kalko EKV, Linsenmair KE, Weisser WW, Fischer M. 2015.Grassland management intensification weakens the associations among the diversities of multiple plant and animal taxa.Ecological Society of America96:1492–1501.
Mi X, Swenson NG, Valencia R, Kress WJ, David L, Pérez ÁJ, Ren H, Su S, Gunatilleke N, Gunatilleke S, Hao Z, Ye W, Cao M, Suresh HS, Dattaraja HS, Sukumar R, Ma K, Mi X, Swenson NG, Valencia R, Kress WJ, Erickson DL, Pe J, Ren H, Su S, Gunatilleke N, Gunatilleke S. 2015.The Contribution of Rare Species to Community Phylogenetic Diversity across a Global Network of Forest Plots.The American Naturalist 180(1):E17–E30DOI 10.1086/665999.
Mouillot D, Bellwood DR, Baraloto C, Chave J, Galzin R, Harmelin-Vivien M, Kulbicki M, Lavergne S, Lavorel S, Mouquet N, Paine CET, Renaud J, Thuiller W. 2013.
Rare species support vulnerable functions in high-diversity ecosystems.PLoS Biology
11:e1001569DOI 10.1371/journal.pbio.1001569.
Newbold T, Butchart SH, M, Sekercioğlu CH, Purves DW, Scharlemann JPW. 2012.
Mapping functional traits: comparing abundance and presence-absence estimates at large spatial scales.PLoS ONE7:e44019DOI 10.1371/journal.pone.0044019.
Oksanen J, Blanchet FG, Kindt R, Legendre P, Minchin PR, O’Hara RB, Simpson GL, Solymos P, Stevens MHH, Wagner H. 2013.vegan: community ecology package. R package version 2.0-7.Available athttp:// CRAN.R-project.org/ package=vegan.
Olesen JM, Jordano P. 2002.Geographic patterns in plant–pollinator mutualistic networks.Ecology 83:2416–2424
DOI 10.1890/0012-9658(2002)083[2416:GPIPPM]2.0.CO;2.
Pellissier L, Wisz MS, Strandberg B, Damgaard C. 2014.Herbicide and fertilizers promote analogous phylogenetic responses but opposite functional responses in plant communities.Environmental Research Letters9:024016
Perrings C, Naeem S, Ahrestani FS, Bunker DE, Burkill P, Canziani G, Elmqvist T, Fuhrman JA, Jaksic FM, Kawabata Z, Kinzig A, Mace GM, Mooney H, Prieur-Richard A-H, Tschirhart J, Weisser W. 2011.Ecosystem services, targets, and indicators for the conservation and sustainable use of biodiversity.Frontiers in Ecology and the Environment9:512–520DOI 10.1890/100212.
R Core Team. 2013.R: a language and environment for statistical computing. Vienna: R Foundation for Statistical Computing.Available athttp:// www.R-project.org/.
Ricotta C, Bacaro G, Caccianiga M, Cerabolini BEL, Moretti M. 2015.A classical measure of phylogenetic dissimilarity and its relationship with beta diversity.Basic and Applied Ecology 16:10–18DOI 10.1016/j.baae.2014.10.003.
Scheffer M, Vergnon R, Van Nes EH, Cuppen JGM, Peeters ETHM, Leijs R, Nilsson AN. 2015.The evolution of functionally redundant species; evidence from beetles.PLoS ONE10:e0137974DOI 10.1371/journal.pone.0137974.
Smart SM, Thompson K, Marrs RH, Le Duc MG, Maskell LC, Firbank LG. 2006.
Biotic homogenization and changes in species diversity across human-modified ecosystems.Proceedings of the Royal Society B: Biologial Sciences273:2659–2665
DOI 10.1098/rspb.2006.3630.
Srivastava DS, Cadotte MW, MacDonald AAM, Marushia RG, Mirotchnick N. 2012.
Phylogenetic diversity and the functioning of ecosystems.Ecology Letters15:637–648
DOI 10.1111/j.1461-0248.2012.01795.x.
Valiente-Banuet A, Aizen MA, Alcántara JM, Arroyo J, Cocucci A, Galetti M, García MB, García D, Gómez JM, Jordano P, Medel R, Navarro L, Obeso JR, Oviedo R, Ramírez N, Rey PJ, Traveset A, Verdú M, Zamora R. 2014.Beyond species loss: the extinction of ecological interactions in a changing world.Functional Ecology
29:299–307DOI 10.1111/1365-2435.12356.
Vamosi JC, Moray CM, Garcha NK, Chamberlain SA, Mooers AØ. 2014.Pollinators visit related plant species across 29 plant–pollinator networks.Ecology and Evolution
4:2303–2315DOI 10.1002/ece3.1051.
Walker BH. 2015.Biodiversity and ecological redundancy.Conservation Biology6:18–23.
Watts S, Ovalle DH, Herrera MM, Ollerton J. 2012.Pollinator effectiveness of native and non-native flower visitors to an apparently generalist Andean shrub, Duranta mandonii (Verbenaceae).Plant Species Biology27:147–158
DOI 10.1111/j.1442-1984.2011.00337.x.
Webb CO. 2000.Exploring the phylogenetic structure of ecological communities: an example for rain forest trees.American Naturalist156:145–155.
Webb CO, Ackerly DD, Kembel S. 2008.Phylocom: software for the analysis of phylo-genetic community structure and trait evolution.Bioinformatics24(18):2098–2100
DOI 10.1093/bioinformatics/btn358.
Webb CO, Ackerly DD, McPeek MA, Donoghue MJ. 2002.Phylogenies and community ecology.Annual Review of Ecology and Systematics33:475–505
DOI 10.1146/annurev.ecolsys.33.010802.150448.
Webb CO, Donoghue MJ. 2005.Phylomatic: tree assembly for applied phylogenetics. Molecular Ecology Notes5:181–183.
Weiner CN, Werner M, Linsenmair KE, Blüthgen N. 2011.Land use intensity in grass-lands: changes in biodiversity, species composition and specialisation in flower visi-tor networks.Basic and Applied Ecology12:292–299 DOI 10.1016/j.baae.2010.08.006.
Werner GDA, Cornwell WK, Sprent JI, Kattge J, Kiers ET. 2014.A single evolutionary innovation drives the deep evolution of symbiotic N2-fixation in angiosperms. Nature Communications5:4087DOI 10.1038/ncomms5087.
Wikstrom N, Savolainen V, Chase MW. 2001.Evolution of angiosperms: calibrating the family tree.Proceedings of the Royal Society, Series B268:2211–2220.
Wilson JB, Peet RK, Dengler J, Pärtel M. 2012.Plant species richness: the world records. Journal of Vegetation Science23:796–802.
Wittmann F, Zorzi BT, Tizianel FAT, Urquiza MVS, Faria RR, e Sousa NM, Módena ÉDS, Gamarra RM, Rosa ALM. 2008.Tree species composition, structure, and aboveground wood biomass of a riparian forest of the lower Miranda River, South-ern Pantanal, Brazil.Folia Geobotanica43:397–411DOI 10.1007/s12224-008-9022-9.
Worm B, Barbier EB, Beaumont N, Duffy JE, Folke C, Halpern BS, Jackson JBC, Lotze HK, Micheli F, Stephen R, Sala E, Selkoe KA, Stachowicz JJ, Watson R, Worm B, Folke C, Watson R, Barbier B, Emmett J, Micheli F, Palumbi SR, Sala E, Selkoe KA. 2015.Impacts of biodiversity loss on ocean ecosystem services.Science314:787–790