UNIVERSIDADE FEDERAL DO RIO GRANDE DO NORTE
CENTRO DE BIOCIÊNCIAS
PROGRAMA DE PÓS-GRADUAÇÃO EM ECOLOGIA
TESE DE DOUTORADO
VARIABILIDADE ACÚSTICA E RESPOSTAS
EVOLUTIVAS A DIFERENTES PRESSÕES SELETIVAS
NO CANTO DE ANÚNCIO DE ANFÍBIOS
David Lucas Röhr
Natal-RN
David Lucas Röhr
VARIABILIDADE ACÚSTICA E RESPOSTAS
EVOLUTIVAS A DIFERENTES PRESSÕES SELETIVAS
NO CANTO DE ANÚNCIO DE ANFÍBIOS
Natal-RN
Maio/2015
Tese apresentada à Coordenação do Programa de Pós-Graduação em Ecologia, da Universidade Federal do Rio Grande do Norte, em cumprimento às exigências para obtenção do grau de Doutor.
Catalogação da Publicação na Fonte. UFRN / Biblioteca Setorial do Centro de Biociências
Röhr, David Lucas.
Variabilidade acústica e respostas evolutivas a diferentes pressões seletivas no canto de anúncio de anfíbios. / David Lucas Röhr. – Natal, RN, 2015.
158 f.: il.
Orientador: Prof. Dr. Adrian Antonio Garda.
Tese (Doutorado) – Universidade Federal do Rio Grande do Norte. Centro de Biociências. Programa de Pós-Graduação em Ecologia.
1. Anura. – Tese. 2. Comunicação acústica. – Tese. 3. Canto de anúncio. – Tese. I. Garda, Adrian Antonio. II. Universidade Federal do Rio Grande do Norte. III. Título.
BANCA EXAMINADORA
_____________________________________________
Dr. Adrian Antonio Garda – Universidade Federal do Rio Grande doNorte/Presidente – Orientador
_____________________________________________
Dr. Carlos Roberto Sorensen Dutra da Fonseca – Universidade Federal do Rio Grande do Norte/ Membro Interno
_____________________________________________
Dr. Márcio Zikán Cardoso – Universidade Federal do Rio Grande do Norte/ Membro Interno
_____________________________________________
Dr. Carlos Barros de Araújo - Universidade Federal da ParaíbaMembro Externo
_____________________________________________
Dr. Marcelo Felgueiras Napoli - Universidade Federal da BahiaAGRADECIMENTOS
Gostaria de começar agradecendo à minha família, devo tudo que sou a eles.
Meu pai, Ferdinand Röhr, que sempre foi meu maior exemplo, por todos os conselhos
muito sensatos (deveria ter seguido-os mais), por todo carinho e apoio em todas as fases
da minha vida, especialmente durante o doutorado. Minha mãe, Gunde Schneider, por
todo amor e cuidado que sempre teve por mim e o grande apoio, principalmente nos
momentos de dificuldade. Minha irmã, Lucia Röhr, por ser minha melhor amiga e uma
grande parceira na vida, juntamente com meu sobrinho, João Lucas, que tá pra nascer a
qualquer momento e já o amo muito. A David Lemos, meu cunhado e amigo.
Gostaria também de agradecer fortemente ao meu orientador, Adrian Garda, e à
minha co-orientadora, Flora Juncá, por todos os ensinamentos sobre bioacústica,
herpetologia e ciência em geral, além de todo o apoio e amizade.
Agradeço muito ao meu grande amigo Gustavo Paterno. A convivência com ele
durante esse doutorado foi fundamental para a elaboração desta tese. As muitas
discussões sobre ciência, estudos de xadrez e a ajuda direta na confecção da tese, além
de sua amizade e companheirismo, foram inestimáveis para minha vida em Natal.
Agradeço muito também ao Felipe Camurugi, sua amizade e sua disposição em
me ajudar foram muito especiais pra mim.
Agradeço ao Marcelo Gehara e ao Pablo Martinez, pela grande contribuição em
dois diferentes capítulos desta tese.
Agradeço a todos os bons amigos que fiz em Natal, especialmente todos com
quem morei na república Tanquetão, vocês todos fizeram minha estadia nesta cidade
muito feliz, me sentindo fazer parte de uma verdadeira família: Laura Fernandez,
Gustavo Paterno; Anna Santos, Natália Pires, Andree Kimber, Nicolas Sebastian, Lucas
Viegas e Marina Fagundes.
Agradeço a todos do Laboratório de Anfíbios e Repteis da UFRN, em especial,
Felipe Medeiros, Diego Santana, Sara Mângia, Emanuel Fonseca, Flávia Mól Lanna,
Adrian Garda, Marília Lion, Alan Felipe e Thiago Pereira, que se tornaram bons
amigos.
Agradeço a todos que foram a campo comigo, foram tantos que minha memória
ridícula não permite listar todos.
Aos meus amigos do C.R.A, especialmente Bruno Caxias, Fausto Luiz, Gustavo
Galvão, Mário Jarbas, Rodrigo Lapa, Cláudio Leandro, Leo Vidal, Rodrigo Almeida e
Ricardo Quirino.
Agradeço a diversas pessoas que passaram por minha vida em diferentes fases e
me tornaram uma pessoa melhor: Antônio Mattos, Washington Aarão, Alana Araújo,
Denise Bacelar, Bruno Pilatus, Gustavo Paterno, Arturo Escobar, Vinícius São Pedro,
Eliana Faria, Karol Marcal, Mario Jarbas, Juliana Fortes, Igor Alexandre, Welber Pina,
Thiago Nilo e Thiago Mallman.
Agradeço a CAPES pela bolsa, ao CNPq por financiamento das coletas do
segundo capítulo e ao projeto Sisbiota Herpeto-Helmintos por financiar as coletas no
Amapá do primeiro capítulo.
Por último, gostaria de fazer um agradecimento especial à Alana Araújo, que há
quatro anos topou o desafio de enfrentar esse doutorado junto comigo e, apesar da
distância física, na maior parte do tempo, foi minha maior companheira durante todos
SUMÁRIO
Introdução Geral ... 01
Referências Introdução Geral... 04
Capítulo 01 - Variability in Anuran Advertisement Call: a Multi-level Study with the Genus Phyllomedusa (Hylidae: Anura)……… 07
Introdução... 08
Material e Métodos... 10
Resultados... 12
Discussão... 14
Referências Bibliográficas... 17
Figuras... 21
Tabelas... 23
Material Suplementar... 27
Capítulo 02 - Habitat Depended Variation in the Advertisement Call of Phyllomedusa nordestina (HYLIDAE: ANURA)... 37
Introdução... 38
Material e Métodos... 41
Resultados... 44
Discussão... 45
Referências Bibliográficas... 48
Figuras... 52
Tabelas... 55
Material Suplementar... 57
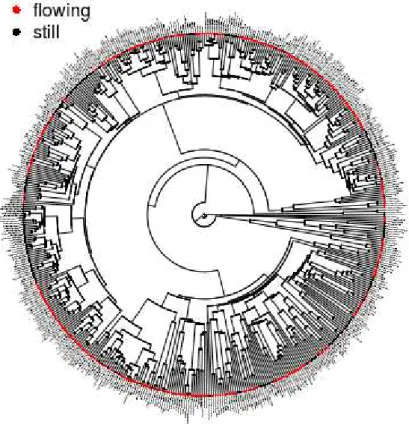
Capítulo 03 - Background Noise as a Selective Pressure: Stream-breeding Anurans Call at Higher Frequencies... 63
Introdução... 65
Material e Métodos... 66
Resultados... 67
Discussão... 68
Referências Bibliográficas... 72
Tabelas... 75
Figuras... 76
Material Suplementar... 77
1 Introdução Geral
Sinais reprodutivos podem ter um papel fundamental no processo de especiação,
uma vez que isolamento reprodutivo pode ocorrer mediante variações na estrutura
destes sinais e nas preferências dos possíveis parceiros sexuais (Turelli et al., 2001). A
evolução destes sinais pode ser influenciada por uma gama de forças evolutivas, como
seleção natural, seleção sexual e processos estocásticos (Erdtmann e Amézquita, 2009).
Sinais acústicos são o principal meio de comunicação da maioria das espécies de anuros
(Gerhardt e Huber, 2002). Dentre os diferentes tipos de vocalizações conhecidos para o
grupo, o canto de anúncio, cuja principal função é atrair as fêmeas, tem sido o mais
estudado (Gerhardt, 1994).
A evolução de vocalizações animais pode ser influenciada por processos
estocásticos ou adaptativos que atuam diretamente no processo de especiação. A
importância dos processos estocásticos em mudanças não-adaptativas nas vocalizações
é atribuída à deriva genética (Gerhardt e Huber, 2002; Erdtmann e Amézquita, 2009) e à
mudanças pleiotrópicas acompanhadas indiretamente por mudanças morfológicas
(Cocroft e Ryan, 1995; Podos, 2001; Seddon, 2005; Erdtmann e Amézquita, 2009).
Dentre os processos adaptativos, a importância do reconhecimento específico (Pfenning,
1998) e da seleção sexual (Ryan e Rand, 1993; Carson, 2003; Boul et al., 2007) têm
sido os mais estudados.
Por outro lado, diferentes pressões impostas pelo ambiente onde a comunicação
ocorre podem promover a evolução dos cantos, em distintas direções e intensidades
(Boughman, 2002). Por exemplo, a presença de predadores (Tuttle e Ryan, 1981) ou
parasitas (Bernal et al., 2006) no ambiente, os quais se utilizam dos sinais acústicos de
suas presas para sua detecção/localização, podem exercer uma forte pressão seletiva
sobre estes sinais.
Uma pressão seletiva pode favorecer sinais que minimizem a interferência do
ruído ambiente oriundo dos sinais acústicos de outros animais ou de fatores abióticos
(Wollerman e Wiley, 2002; Feng et al., 2006; Preininger et al., 2007). Na verdade, o
ruído ambiente é um dos principais limitantes da comunicação acústica (Brumm e
Slabberkoorn, 2005). Ambientes lóticos como riachos, que são utilizados por diversas
espécies de anuros para reprodução, produzem um ruído ambiente constante que muitas
2
espectros graves (Goutte et al., 2013) que se sobrepõe ao canto relativamente grave dos
anuros (Wells, 2007). Desta forma, pode se esperar que anuros que vocalizem perto
destes ambientes utilizem frequências mais altas com menor sobreposição espectral com
o barulho ambiente. De fato, estudos mostram que a estrutura de comunidade de anuros
próximos a riachos está associada à intensidade do barulho da água corrente (Goutte et
al., 2013) e que a utilização de cantos mais agudos aumenta a capacidade de detecção e
localização destes sinais nesses ambientes (Boonman e Kurniati, 2011). Além disso,
todas as espécies de anuros que utilizam de comunicação ultrassônica cantam perto de
corredeiras (Narins et al., 2004; Feng et al., 2006; Arch et al., 2008).
A eficiência da propagação do sinal acústico também está sob intensa pressão
seletiva. Machos com vocalizações de maior alcance aumentam sua chance de atrair
fêmeas. Desse modo, sinais acústicos que sofram o menor grau de atenuação (perda de
energia) e degradação (perda de fidelidade) (Kime et al.,2000; Castellano et al., 2003)
tendem a ser selecionados. A estrutura da vegetação pode ter um papel importante na
propagação do som, uma vez que ondas sonoras se propagam com eficiências distintas
em vegetações abertas ou fechadas. Assim, determinadas características acústicas dos
sinais podem ser mais propícias à propagação em tipos específicos de ambientes (Wiley
e Richards 1978; Kime et al., 2000).
Desta forma, é esperado que animais, especialmente naqueles grupos onde a
comunicação acústica é amplamente difundida (ex. aves, mamíferos e anuros),
modulem a estrutura de suas vocalizações para otimizar sua propagação, o que é conhecido como a ―Hipótese da Adaptação Acústica‖ (Morton, 1975; Rothstein e Fleischer, 1987; Ey e Fischer, 2009). Áreas de vegetação aberta apresentam
características acústicas muito diferentes de áreas com vegetação densa (Wiley e
Richards, 1978). Hábitats fechados tendem a impor maiores pressões seletivas sobre a
sinalização acústica (Ey e Fischer, 2009), uma vez que nestes ambientes a comunicação
visual é mais restrita, as condições acústicas são mais estáveis (Morton, 1975; Brown e
Handford, 2000) e a reverberação e absorção das ondas sonoras são mais intensas
(Wiley e Richards, 1978).
Existem várias predições sobre como as características dos sinais acústicos
devem se comportar em hábitats abertos versus fechados. Como áreas de vegetação
3
flutuações de vento e temperatura), acredita-se que nestes hábitats as vocalizações
devam apresentar um maior grau de estereotipia em relação aos hábitats abertos. Além
disto, há várias características sonoras, relacionadas a diversos parâmetros acústicos
temporais e espectrais, que favorecem uma propagação eficiente nestes dois ambientes.
Por exemplo, espera-se que vocalizações em ambientes fechados apresentem uma maior
duração, menor taxa de repetição de subelementos do canto, menor número de
elementos de frequência modulados, frequências máximas e mínimas mais baixas,
menores frequências média e dominante, além de bandas de frequências mais restritas.
Dos estudos feitos até hoje com anuros, mamíferos e aves, parte corroboram algumas
destas tendências (revisado em Ey e Fischer, 2009).
Existem basicamente duas metodologias para estudar a influência do ambiente
nos sinais acústicos de diferentes animais: uma abordagem comparativa e outra
experimental (Castellano et al., 2003). Em estudos de base comparativa, sinais acústicos
de diferentes espécies dentro de um grupo monofilético são comparados controlando-se
os possíveis efeitos da filogenia nas diferenças observadas (ver Ey e Fisher, 2009 e
Peters e Peters, 2010). Com isso, é possível determinar se as correlações observadas são
decorrentes da ancestralidade comum ou da evolução convergente em resposta a
pressões seletivas semelhantes (Cosens e Falls, 1984; Wiley, 1991; Badyaey e Leaf,
1997). Em estudos de base experimental, para testar o efeito das diferenças ambientas e
as variações nos sinais acústicos os pesquisadores podem testar de forma direta a
eficiência de propagações em diferentes hábitats e analisar a quantidade de atenuação
e/ou degradação com o aumento da distância (Ryan et al., 1990; Penna e Solis, 1998;
Kime et al., 2000; Röhr e Juncá, 2013).
Estudos realizados com aves e primatas demonstram que, para diferentes grupos,
uma propagação eficiente está sujeita a uma pressão seletiva significativa exercida pelo
meio de propagação (e.g. Wiley, 1991; Brown et al., 1995; Badyaey e Leaf, 1997;
Patten et al., 2004; Seddon, 2005; Kirschel et al., 2009; Ripmeester et al., 2010).
Existem menos estudos realizados com anuros e os resultados não são conclusivos
(Zimmerman, 1983; Ryan et al., 1990; Penna e Solis, 1998; Kime et al., 2000;
Castellano et al., 2003; Bosch e De la Riva, 2004). Isso ocorre especialmente pelo fato
de uma análise filogenética comparativa não ter sido conduzida para anfíbios, visto que
4
Nesta tese, tentamos avançar sobre o conhecimento dos processos evolutivos que
atuam sobre sinais acústicos, mais especificamente o canto de anúncio dos anuros. No
primeiro capítulo, fizemos uma análise descritiva da variabilidade do canto de anúncio
do gênero Phyllomedusa (Hylidae: Anura) em diferentes níveis: diferentes cantos de um
mesmo indivíduo; cantos de diferentes indivíduos de uma mesma população; cantos de
indivíduos de diferentes populações; cantos de diferentes espécies. Discutimos como a
variabilidade dos diferentes parâmetros acústicos nesses níveis podem evidenciar
processos evolutivos atuantes sobre essas vocalizações. Nos capítulos seguintes
testamos se diferentes pressões seletivas estão associadas à diversidade intra e
interespecífica nesta vocalização. No segundo capítulo, testamos a importância de
barreiras de propagação sobre o canto de anúncio de Phyllomedusa nordestina. Para isto
comparamos vocalizações de indivíduos de diferentes populações que ocorrem na Mata
Atlântica e na Caatinga, além de testar se os parâmetros acústicos estão correlacionados
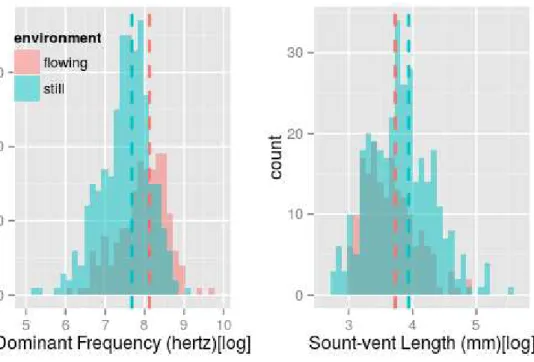
à quantidade de vegetações no entorno do indivíduo. Já no terceiro capítulo, avaliamos
se a frequência dominante do canto de anúncio das espécies que reproduzem em
ambientes lóticos é mais alta em relação às espécies de ambientes lênticos. Para isto,
utilizamos dados de literatura sobre espécies distribuídas por todo o globo.
Referências
Arch, V. S., Grafe, T. U., Gridi-Papp, U., & Narins, P. M. 2009. Pure ultrasonic communication in an
endemic Bornean frog. Plos One, 4, e5413.
Badyaev, A. V. & Leaf, E. S. 1997. Habitat associations of song characteristics in Phylloscopus and
HippolaisWarblers. The Auk, 114, 40-46.
Bernal, X. E., Rand, A. S. & Ryan, M. J. 2006. Acoustic preferences and localization performance of
blood-sucking flies (Corethrella Coquillett) to túngara frog calls. Behavioral Ecology, 17, 709-715.
Boonman, A. and Kurniati, H. 2011. Evolution of high-frequency communication in frogs. Evolutionary
Ecology Research, 13, 197-207.
Bosch, J. & De la Riva, I. 2004. Are frogs calls modulated by the environment? An analysis with anuran
species from Bolivia. Canadian Journal of Zoology, 82, 1051-1059.
Boughman, J. W. 2002. How sensory drive can promote speciation. Trends in Ecology & Evolution, 17,
571-577.
Boul, K. E., Funk, W. C., Darst, C. R., Cannatella, D. C. & Ryan, M. J. 2007.Sexual selection drives
speciation in an Amazonian frog. Proceedings of the Royal Society B: Biological Sciences, 274, 399-406.
Brown, T. J. & Handford, P. 2000. Sound design for vocalizations: quality in the woods, consistency in the
fields. The Condor, 102, 81-92.
Brown, C. H., Gomez, R. & Waser, P. M. 1995. Old World monkey vocalizations: adaptation to the local
habitat? Animal Behaviour, 50, 954-961.
Brumm, H.& Slabbekoorn, H.. 2005. Acoustic communication in noise. Advances in the Study of Behavior 35,
151-209.
5
Castellano, S., Giacoma, C. & Ryan, M. J. 2003. Call degradation in diploid and tetraploid toads. Biological
Journal of the Linnean Society, 78, 11-26.
Cocroft, R. B. & Ryan, M. J. 1995. Patterns of advertisement call evolution in toads and chorus frogs. Animal
Behaviour, 49, 283-303.
Cosens, S. E. & Falls, J. B. 1984. A comparison of sound propagation and song frequency in temperate marsh
and grassland habitats.Behavioral Ecology and Sociobiology, 3, 161-170.
Erdtmann, L. & Amézquita, A. 2009. Differential evolution of advertisement call traits in dart-poison frogs
(Anura: Dendrobatidae). Ethology, 115, 801-811.
Ey, E. & Fischer, J. 2009. The ―Acoustic Adaptation Hypothesis‖ – a review of the evidence from birds, anurans and mammals. Bioacoustics, 19, 21-48.
Feng, A. S., Narins, P. M., Xu, C., Lin., W., Yu, Z., Qiu, Q., Xu, Z. & Shen, J. 2006. Ultrasonic
communication in frogs. Nature, 404, 333-336.
Gerhardt, H. C. 1994. The evolution of vocalization in frogs and toads. Annual Review of Ecology and
Systematics, 25, 293-324.
Gerhardt, H. C. & Huber, F. 2002. Acoustic communication in insects and anurans. Chicago: University of
Chicago Press.
Goutte, S., Dubois, A. & Legendre, F. 2013. The importance of ambient sound level to characterise anuran
habitat. Plos One, 8, e78020.
Kime, N. M., Turner, W. R. & Ryan, M. J. 2000. The transmission of advertisement calls in Central American
frogs. Behavioral Ecology,11, 71-83.
Kirschel, N. G., Blumstein, D. T., Cohen, R. E., Buemann, W. Smith, T. B. & Slabbekoorn, H. 2009.
Birdsong tuned to the environment: green hylia song varies with elevation, tree cover, and noise. Behavioral ecology, 20, 1089-1095.
Morton, E. S. 1975. Ecological sources of selection on avian sounds. The American Naturalist, 109, 13-17. Narins, P. M., Feng, A. S., Lin, W. Y., Schnitzler, H. U., Denzinger, A., Suthers, R. A., & Xu, C. H. 2004.
Old World frog and bird, vocalizations contain prominent ultrasonic harmonics. Journal of the Acoustical Society of America, 115, 910-913.
Patten, M. A., Rotenberry, J. T. & Zuk, M. 2004. Habitat selection, acoustic adaptation, and the evolution of
reproductive isolation. Evolution, 58, 2144-2155.
Penna, M. & Solís, R. 1998. Frog call intensities and sound propagation in the South American temperate forest
region. Behavioral Ecology and Sociobiology, 42, 371-381.
Peters, G. & Peters, M. K. 2010. Long-distance call evolution in the Felidae: effects of body weight, habitat,
and phylogeny. Biological Journal of the Linnean Society, 101, 487-500.
Pfenning, K. S. 1998. The evolution of mate choice and the potential for conflict between species and
mate-quality recognition. Proceedings of the Royal Society B: Biological Sciences, 265, 1743-1748.
Podos, J. 2001. Correlated evolution of morphology and vocal signal structure in Darwin´s Finches. Nature, 409, 185-188.
Preininger, D., Markus, B. & Hödl. 2007. Comparison of anuran acoustic communities of two habitat types in
the Danum Valley Conservation Area, Sabah, Malaysia. Salamandra, 43, 129-138.
Ripmeester, E. A. P., Mulder, A. & Slabbekoorn, H. 2010. Habitat-dependent acoustic divergence affects
playbacks in urban and forest populations of the European blackbird. Behavioral Ecology, 21, 876-883.
Röhr, D. L. & Juncá, F. A. 2013. Micro-habitat influence on the advertisement call structure and sound
propagation efficiency of Hypsiboas crepitans (Anura: Hylidae). Journal of Herpetology, 47, 549-554.
Rothstein, S. I. & Fleischer, R. C. 1987. Vocal dialects and the possible relation to honest status signaling in
the Brown-Headed Cowbird. The Condor, 89, 1-23.
Ryan, M. J. & Rand, A. S. 1993. Sexual selection and signal evolution: the ghost of biases past. Philosophical
Transactions: Biological Sciences, 340, 187-195.
Ryan, M. J., Cocroft, R. B. & Wilczynski, W. 1990. The role of environmental selection in intraspecific
divergence of mate recognition signals in the cricket frog, Acris crepitans. Evolution, 44, 1869-1872.
Seddon, N. 2005. Ecological adaptation and species recognition drives vocal evolution in neotropical suboscine
birds. Evolution, 59, 200-215.
Turelli, M., Barton, N. H. & Coyne, J. A. 2001. Theory and speciation. Trends in Ecology & Evolution, 16,
330-343.
Tuttle, M. D. & Ryan, M. J. 1981. Bat predation and the evolution of frog vocalizations in the neotropics.
Science, 214, 677-678.
Wells, K. D. 2010. The ecology and behavior of amphibians. University of Chicago Press, Chicago.
Wiley, R. H. 1991.Associations of song properties with habitats for territorial oscine birds of Eastern North
America. The American Naturalist, 138, 973-993.
Wiley, R. H. & Richards, D. G. 1978. Physical constraints on acoustic communication in the atmosphere:
6
Wollerman, L. & Wiley, R. H. 2002. Background noise from natural chorus alters female discrimination of
male calls in a Neotropical frog. Animal Behaviour, 63, 15-22.
Zimmerman, B. L. 1983. A comparison of structural features of calls of open and forest habitat frog species in
7 CAPÍTULO 01
Variability in Anuran Advertisement Call: a Multi-level Study with the Genus Phyllomedusa (Hylidae: Anura).
David Lucas Röhr, Gustavo Brant Paterno, Marcelo Gehara, Felipe Camurugi; Flora
Acuña Juncá, Guilherme Fajardo R. Álvares, Reuber Albuquerque Brandão, Adrian
Antonio Garda
Abstract
Understanding variability of acoustic signals is a first important step for the
comprehension of the evolutionary processes that led to present diversity. Herein, we
evaluate the variability of the advertisement of the anuran genus Phyllomedusa at
different levels: intra-individual; intra-population; inter-population; inter-specific.
Analysis of coefficients of variation showed a continuum of variability between the
acoustic parameters analyzed, from static to highly dynamic. Most of the variation was
attributed to the inter-specific level, while the intra-individual varied the less, however,
the variability at each level differed between parameters. While most temporal acoustic
parameters were affected by environmental temperature, the spectral parameter was
strongly influenced by body size. Only one acoustic parameter was correlated to the
geographic distance between populations, while all presented a significant phylogenetic
signal. Furthermore, the advertisement call for this genus showed a low potential for
individual recognition. Based on these results, we discuss the possible importance of
different evolutionary forces and the usage of this vocalization for taxonomy.
8 Introduction
Understanding variability is fundamental for the comprehension of evolution
(Hallgrímsson and Hall, 2011). Darwin´s observations on phenotypic variation were the
basis for the development of the concept of natural selection (Darwin, 1859), and intra
and inter-specific variation were central for the modern evolutionary synthesis (Mayr,
1963; Wright, 1968).
Acoustic signals are important for a large proportion of current fauna, and for
most groups it has a predominant reproductive function (Gerhardt, 1994). Because these
signals are involved in conspecific recognition, they may have a key role in
diversification, and their importance as evolutionary forces has been the focus of many
studies (Wilkins et al., 2013).
Acoustic signals are the predominant form of communication for the vast
majority of anuran species. Although many species present more than one type of call,
the advertisement call emitted by males with main function of attracting females can be
considered the most important acoustic signal for this clade (Wells, 1977). Since the
first bioacoustic studies with frogs, authors noticed that each species has a distinct
advertisement call (Blair, 1958, 1964; Duellman and Pyles, 1983). Furthermore, it has
been shown that females demonstrate strong preference for conspecific advertisement
calls, even when considering sister taxa with relatively similar calls (Backwell and
Jennions, 1993; Gerhardt, 1974). Thus, this vocalization is considered an important
pre-zygotic reproductive barrier (Gerhardt and Huber, 2002) and has been used as an
important taxonomic tool, helping overcome the lack of useful external morphological
traits in frogs (Padial and De La Riva, 2009).
The anuran advertisement call is considered stereotyped, especially in
comparison to other vertebrates such as birds and mammals. Still, there is considerable
amount of intra-specific variation at the individual level (Howard and Young, 1998), at
the population level (Sullivan, 1982), and among population of the same species
(Sullivan, 1989). Although several studies clearly demonstrate this variation in each
level separately, few studies have quantified how different acoustic parameters vary at
different levels within a specific clade (Bee et al., 2010; Castellano et al., 2002).
Different acoustic parameters from the same call are semi-independent and might
9
and Huber, 2002). Therefore, a broad comprehension of variability at different levels
enables the proposition of various hypotheses about the evolutionary mechanisms that
led to the present acoustic diversity.
In general, variation in acoustic signals can be related to pleiotropic effects
(Podos, 2001), stochastic processes (Goicoechea et al., 2010), natural selection (Ryan et
al., 1990), and sexual selection (Gerhardt, 2005). For anurans, pleiotropic effects of
morphology and physiology are exemplified by the well-known influence of body size
and temperature on acoustic parameters. The size of the vocal apparatus usually affects
spectral parameters, while temperature often influences temporal characteristics of the
calls (Gerhardt, 1994). Such relationships can affect the variability of different acoustic
parameters at different levels. For example, acoustic parameters that are more
dependent on temperature should vary more, especially intra-individually and in a
shorter time scale. At the same time, parameters that are highly dependent on
morphology should be more stereotyped, with most of the variation occurring at levels
above individuals or ontogenetically. Therefore, it is important to carefully consider the
influence of temperature and body size in any bioacoustic study.
Stochastic processes affect the evolution and variability of acoustic signals. For
anurans, these effects are tested evaluating the geographic variation of acoustic
parameters (Pröhl et al., 2007) or the effect of phylogeny on inter-specific variation
(Goicoechea et al., 2010). While some acoustic parameters vary mostly in response to
stochastic processes, others are not correlated with phylogeny or biogeography, possibly
because they are under strong selective forces (Erdtmann and Amézquita, 2009). These
different evolutionary pathways should also influence the amount of variation detected
at different levels.
Selection may affect the variability of acoustic parameters in different ways
(Wilkins et al., 2013). For example, acoustic parameters important for conspecific
recognition are under selective pressure not to overlap with calls from sympatric
species, possibly leading to more stereotypy and hence reducing the likelihood of
hybridization (Lemmom, 2009). Beyond this, in diverse acoustic communities, calls
might also be more stereotyped in order to use silent windows and reduce masking
interference (Bee, 2008; Chek et al., 2003). At the same time, a higher stereotypy might
10
propagation scenario is more stable compared to open areas, which are more susceptible
to wind and temperature shifts (Wiley and Richards, 1978; Ey and Fischer, 2009).
Nevertheless, most studies on the variability of anuran advertisement call discuss
sexual selection (Gerhardt and Huber, 2002). One key measurement of acoustic
variation in frogs has been the individual coefficient of variation. Based on this
measure, extensive literature has shown that variability of different acoustic parameters
follows a continuum from static to dynamic (Bee et al., 2010; Castellano et al., 2002;
Gerhardt, 1991). Static parameters should be under stabilizing or weakly directional
sexual selection (Gerhardt, 1991; Gerhardt and Huber, 2002). Indeed, most studies
confirm that females tend to prefer advertisement calls with values close to the
species/population mean for such acoustic parameters (Castellano et al., 1998; Rosso et
al., 2006), and these parameters should be important for specific recognition and are
more reliable taxonomic tools (Gerhardt and Huber, 2002). In contrast, acoustic
parameters with high individual variability should be under directional selection, and
females should prefer calls with more extreme values from the species distribution for
these parameters (Bosch and Márquez, 2005; Castellano and Giacoma, 1998). These parameters can indicate male’s quality or facilitate localization (Gerhardt and Huber, 2002).
Herein, we evaluate the variability of different acoustic parameters of the
advertisement call of 15 species of the anuran genus Phyllomedusa at different levels:
intra-individual; intra-population; inter-population; intra-specific; inter-specific. We
also estimated what percentage of the total variation detected can be explained by each
levels. Furthermore, we tested: 1) the effect of environmental temperature and body size
on the acoustic parameters, 2) if they present significant phylogenetic signal and 3) if
they are correlated to geographic distance between populations. Finally, we evaluated
the possibility of individual, population, and specific recognition considering the
variation found in the acoustic parameters analyzed.
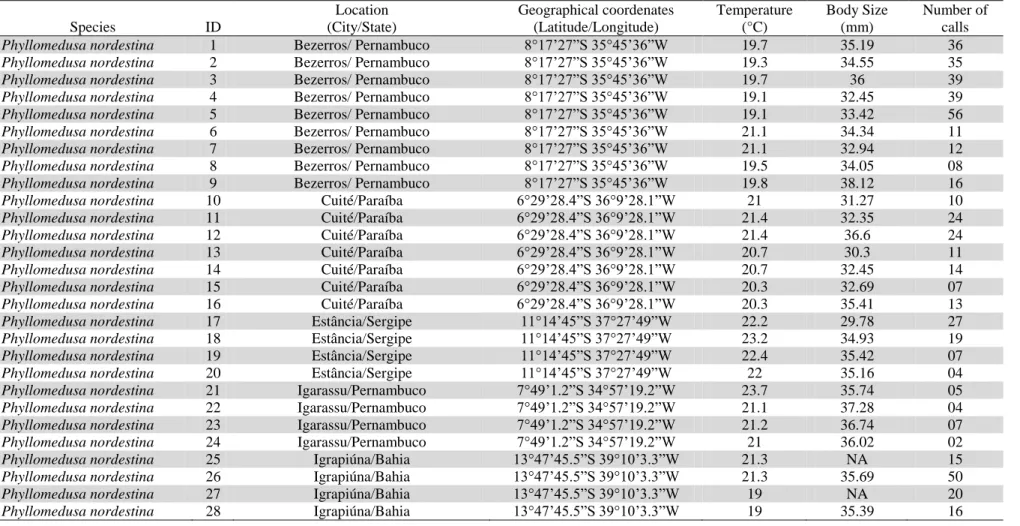
Material & Methods
The genus Phyllomedusa is composed of approximately 30 species, which are
hylid frogs commonly known as monkey frogs and belong to the Subfamily
Phyllomedusinae. We recorded the advertisement of species from the genus
11
digital recorder with a sampling rate of 48 kHz and 16 bit resolution, connected to a
Sennheiser ME66 directional microphone. After each recording for the large majority of
the individual we measured the environmental temperature and snout-vent length (See
Table S1 for data on each recording: species; location; coordinates; recording
equipment; temperature; body size; total number of calls analyzed). Acoustic
parameters were measured in Raven Pro 1.4 and spectrograms produced as follows:
FFT window width = 256; Frame = 100; Overlap = 50%.
We analyzed a total of five acoustic parameters for all calls recorded, which we
believe are comparable at all levels, even between different species of this genus:
dominant frequency (DF); total number of pulses in the call (PN); average pulse length
considering all pulses from the call (PL); pulse rate (PR); total duration of the call (DU);
interval between calls (CI).
To estimate the variability of the acoustic parameters we calculated the
coefficient of variation (CV), which is a standardized measure of dispersion calculated
through the ratio of the standard deviation to the mean, for all acoustic parameters at
five different levels: 1) intra-individual (different calls from a single individual); 2)
intra-population (calls from different individuals from a single population); 3)
inter-population (calls from individuals from different inter-populations); 4) intra-specific (calls
from different individuals from the same species, independent from which population);
5) inter-specific (calls from individuals from different species).
To deal with different sample sizes at each level, we created a stratified
hierarchical subsampling method in which we repeatedly drew from our data pool five
different calls that were used to calculate the CV. We ensured that the calls were drawn
from different entities forming the respective level of interest. For instance, before
drawing five calls at the intra-individual level, we drew a species, than a population,
than an individual, than five different calls. For the intra-population level we first drew
a species, than a population, than five calls from different individuals and so on (see
Table 1 for a stepwise description of all steps used to obtain the calls used for each
level). We repeated each subsampling 1,000 times for each level to create five
distributions of variation for each acoustic parameter. The CV for intra and
inter-population was only calculated for Phyllomedusa nordestina due to the lack of
12
Additionally, we performed a hierarchical ANOVA to calculate the amount of
variation that can be attributed to each level. For this analysis we used only four levels
in order to access the variability repartition for the entire genus: call; individual;
population; species. To test the influence of body size and environmental temperature
on acoustic parameters of Phyllomedusa we performed a regression model using the
mean value from all calls from each individual and including the species as a block. To
evaluate the geographic variation for the different populations of P. nordestina we
applied a Mantel test for each acoustic parameter. In the correlation matrix we included
the geographical coordinates of each locality and the mean acoustic parameters for each
individual.
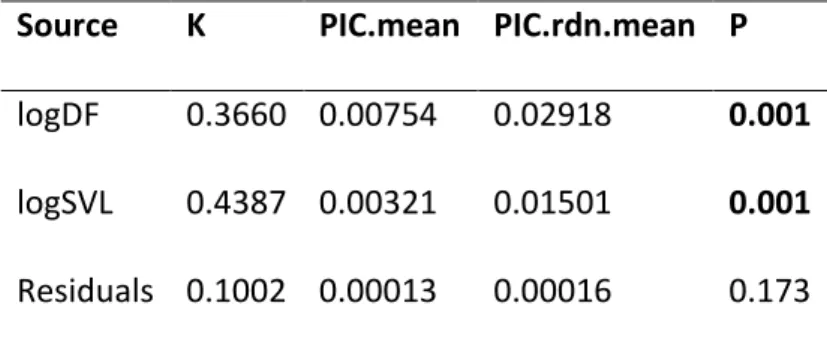
To quantify the phylogenetic signal strength for each acoustic parameter
between the species of Phyllomedusa we recorded, we used Blomberg's K, which metric
is based on Brownian motion model of evolution, where its significance is tested by
permuting traits across a phylogenetic tree. When K is larger than one, related species
present trait values more similar than expected from a Brownian motion and when it is
smaller than one, relatives are less similar than expected (Blomberg et al., 2003).
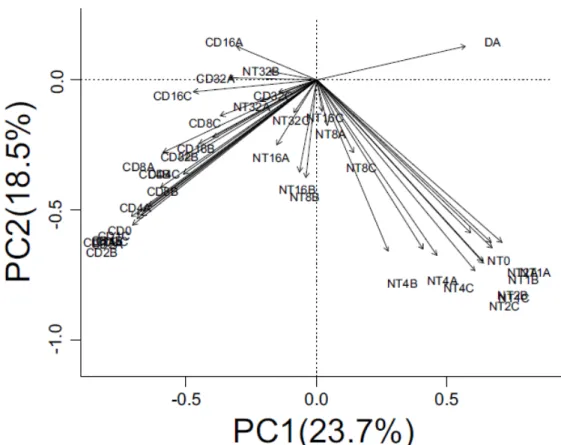
Finally, we used a discriminant function analysis with all acoustic parameters to
examine the extent to which calls can be assigned to the correct individual, population
and species, and a cross-validation procedure was used to measure classification
success.
All analyses were done on the R 3.1.2. environment using the following
packages: ggplot2; reshape2; dplyr; gridExtra; ape; picante; caper; diversitree.
Results
We analyzed a total of 3,994 advertisement calls from 188 individuals of 15
different species of Phyllomedusa (see Table S1 for details on each individual
recorded). Although we sampled calls from more than one locality for various species,
we only obtained enough samples from different populations for P. nordestina, for
which we recorded various individuals from 14 populations from different localities
distributed throughout most of the species geographical distribution (Table S1). The
13
several similar pulses that can be grouped in different notes (See Table 2 for the mean
values of the acoustic parameters for the specie recorded and Figure S1 and S2 for
spectrograms of one call from each species).
The multiple-level analyses of variability using CV showed that all acoustic
parameters presented the lowest variation intra-individually, but the intensity of this
trend varied between parameters. Dominant frequency, pulse length, and pulse rate are
the most static parameters, especially intra-individually. Pulse number and call duration
present intermediate values, while call interval is highly dynamic and shows less
difference between the intra-specific levels and the inter-specific level (Figure 1).
Call parameters also vary considerably below the interespecific level. In general,
the variability is smallest at the intra-individual level for all parameters and a tendency
for the intra-population level to show less variability than the inter-population, with the
intra-specific intermediate. Furthermore, the three most static parameters (dominant
frequency, pulse length, and call rate) show the largest difference inter-specifically
compared to other levels (Figure 1).
The ANOVA confirmed the results from our multi-level CV evaluation, where
most of the advertisement call variability for the 15 species of Phyllomedusa is
explained by inter-specific differences. However, this trend also varies a lot between
parameters, where there is a clear tendency for static acoustic parameters have a larger
percentage of their variability credited to the inter-specific level, with intermediate
parameters having a little less of their variability explained by this level (however more
than 75%) and the dynamic parameter less than 50%. Below the inter-specific level,
pulse rate had a considerable part of its variation attributed to the population level
(Figure 2).
The correlation analyses showed that most of the acoustic parameters are
significantly affected by body size and/or environmental temperature. While
temperature affects mostly the temporal acoustic parameters measured (Table 3), most
parameters where influenced by individuals body size, with a strong effect on the
spectral parameter (dominant frequency) (Table 4). Only pulse rate and call duration
were significantly correlated to the geographical distance between the populations of P.
nordestina (Table 5). Conversely, all acoustic parameters tested presented a significant
14
acoustic parameters attributed 30.7% of the calls to the correct individual, 37.8% to the
population, and more than 81.2% to the correct species.
Discussion
Our results corroborate most studies on acoustic variability for anuran
advertisement calls, where the acoustic parameters present a continuum of variation
(Bee et al., 2010; Castellano et al., 2002). The parameters that presented the lowest CV
were mainly those that are considered important for frog specific recognition, especially
dominant frequency and pulse rate (Gerhardt, 1994). Tests on female preference
demonstrate that females generally prefer calls with medium values for those
parameters, exerting a stabilizing sexual selection over the population (Castellano and
Giacoma, 1998). Furthermore, studies on reproductive character displacement show that
when populations occur in sympatry with sister taxa with similar advertisement calls
these preferences are stronger, confirming the importance of these parameters for
specific recognition and as reproductive barrier, diminishing hybridization (Lemmom,
2009). However, for some frog species females prefer calls with slightly lower
dominant frequencies, exerting weak directional sexual selection, possibly choosing for
larger males (Poole and Murphy, 2007; Ryan, 1980).
Considering the more variable parameters, call duration generally presents
intermediate values of CV, while call interval/call rate are highly dynamic (Bee et al.,
2010; Castellano et al., 2002; Gerhardt, 1991). Accordingly, females show directional
preferences for these parameters, which are behaviorally controlled to some extent and
are directly involved in the energetic expenditure of call production (Sullivan, 1992;
Bosch and Márquez, 2005). These more extreme values from the population/species
distribution could indicate higher fitness males or maybe just enhance probability of
signal detection and facilitate localization, with this preference simply representing less
energy cost and lower predation risk (Gerhardt, 1994).
As expected, the inter-specific level was the most variable and most of the
advertisement call variability for Phyllomedusa is attributed to this level, while the
lowest CV was detected intra-individually, except for call interval, which has a high
variability at all levels (Figures 1 & 2). Furthermore, variability in levels that compare
calls from different individuals of the same species also changed as predicted,
inter-15
population, with intermediate values for intra-specific, probably because it includes
calls from individuals which may or not be from the same population.
Most studies on geographical variation of anuran advertisement call detected
significant differences between calls from individuals from distinct populations (Snyder
and Jameson, 1965; Hasegawa et al., 1999; Castellano and Giacoma, 2000). This
variation may be associated to stochastic processes and be directly related to gene flow
or selection (Smith et al., 2003; Bernal et al., 2005, Pröhl et al., 2007; Ohmer et al.,
2009), which may act directly on call characteristics or through pleiotropic effects
(Castellano et al., 1999). When selective pressures are weak, call variation is expected
to be correlated with geographical distance between populations or associated to an
important dispersal barrier (Pröhl et al., 2006).
From all acoustic parameters evaluated for P. nordestina only pulse rate and call
duration are related to geographical distance between populations, and pulse rate had a
higher percentage of its variation explained by the population level when compared to
the other static parameters. Possibly, less parameters were correlated to geographic
distance because there is little variation between populations, both comparing with the
inter-specific variation we detected for the species of Phyllomedusa and with other
studies on geographical variation in anuran advertisement call (Snyder and Jameson,
1965; Hasegawa et al., 1999; Castellano and Giacoma, 2002; Bernal et al., 2005; Pröhl
et al., 2007). This low variability between different populations may be related to
conservative selective pressures acting upon all or most populations, to a large amount
of gene flow, or because of recent population expansions. Other studies on geographic
variation of anuran advertisement calls found contrasting results on the relationship
between call variation and geographic distances (Snyder and Jameson, 1965; Hasegawa
et al., 1999; Castellano and Giacoma, 2000; Smith et al 2003; Bernal et al., 2005; Pröhl
et al., 2005; Ohmer et al., 2009).
Conversely, when considering the variation between the calls from the different
species studied, all acoustic parameters presented a significant phylogenetic signal.
These results corroborate most studies on phylogenetic signals for anurans (Cocroft and
Ryan, 1995; Wollenberg et al., 2007; Erdtmann and Amézquita, 2009; Goicoechea et
al., 2010). Although the anuran advertisement call traditionally is seen as a rapidly
16
1994), recent studies have found surprisingly strong phylogenetic signals for most
acoustic parameters tested, calling attention to the importance of stochastic processes,
such as genetic drift, in the evolution of these vocalizations (Cocroft and Ryan, 1995;
Wollenberg et al., 2007; Erdtmann and Amézquita, 2009; Goicoechea et al., 2010).
Analyzing acoustic signal variability in different parameters also enables
evaluating the possibility of individual recognition (Bee, 2004; Bee et al., 2010; Bee
and Gerhardt, 2001a; Bee et al., 2001; Feng et al., 2009a; Gasser et al., 2009). Besides
attracting mates, the anuran advertisement call also presents a territorial function
(Wells, 1977), and studies on individual recognition have focused on the dear enemy effect, because recognizing constant neighbors might reduce male’s aggressiveness (Bee, 2003, 2004; Bee and Gerhardt, 2001b). For at least some species it has been
shown that males are capable of recognizing neighbor calls (Bee and Gerhardt, 2002;
Davis, 1987; Feng et al., 2009b), and studies of variability using discriminant function
analyses generally assign more than 70% of the calls to the correct individual (Bee,
2004; Bee et al., 2010; Bee and Gerhardt, 2001a; Bee et al., 2001; Feng et al., 2009b;
Feng et al., 2009a; Gasser et al., 2009). For Phyllomedusa, probably individual
recognition is not important (only about 30% of the calls were assigned to the correct
individual). Furthermore, discriminant analyses confirms the relative low variability
between populations (less than 40% of the calls were assigned to the correct
population). Finally, only slightly more than 80% of the calls were assigned to the
correct species, which could account for the apparent large amount of hybridization in
this genus (Haddad et al., 1994).
Our results confirm that the advertisement call of the species studied from the
genus Phyllomedusa may be used as a reliable taxonomic tool, because all acoustic
parameters analyzed, except call interval, presented a much higher inter-specific
variation in comparison to all intra-specific levels. However, considering the variation
detected for the different intra-specific levels, it is important to have adequate replicates
from different localities. Furthermore, it is recomended to consider temperature and
body size, because most of the acoustic parameters were influenced by one or both
variables. It is important to emphasize the influence of body size on the dominant
frequency, considering that it was the only strong correlation recovered. CV at different
levels shows that, between the analyzed acoustic parameters, dominant frequency could
inter-17
specific variation is related to differences in body size, with a pleiotropic effect on the
advertisement call.
Acknowledgements
AAG and FAJ thank CNPq for financial support (Universal # 473503/2012-3 and
#305704/2013-3, respectively). DLR also thanks Sisbiota Herpeto-Helmintos project for financial support.
References
Backwell, P.R.Y., and Jennions, M.D. (1993). Mate choice in the Neotropical frog, Hyla
ebraccata: sexual selection, mate recognition and signal selection Animal Behaviour 45, 1248–
1250.
Bee, M.A. (2003). A test of the "dear enemy effect" in the strawberry dart-poison frog
(Dendrobates pumilio). Behavioral Ecology and Sociobiology 54, 601–610.
Bee, M.A. (2004). Within-individual variation in bullfrog vocalizations: Implications for a
vocally mediated social recognition system. The Journal of the Acoustical Society of America
116, 3770–3781.
Bee, M.A. (2008). Finding a mate at a cocktail party: spatial release from masking improves
acoustic mate recognition in grey treefrogs. Animal Behaviour 75, 1781–1791.
Bee, M.A., Cook, J.M., Love, E.K., O’Bryan, L.R., Pettitt, B.A., Schrode, K., and Vélez, A.
(2010). Assessing acoustic signal variability and the potential for sexual selection and social
recognition in boreal chorus frogs (Pseudacris maculata). Ethology 116, 564–576.
Bee, M.A., and Gerhardt, H.C. (2001a). Neighbour–stranger discrimination by territorial male
bullfrogs (Rana catesbeiana): II. Perceptual basis. Animal Behaviour 62, 1141–1150.
Bee, M.A., and Gerhardt, H.C. (2001b). Neighbour–stranger discrimination by territorial male
bullfrogs (Rana catesbeiana): I. Acoustic basis. Animal Behaviour 62, 1129–1140.
Bee, M.A., and Gerhardt, H.C. (2002). Individual voice recognition in a territorial frog (Rana
catesbeiana). Proceedings of the Royal Society of London B: Biological Sciences 269, 1443–
1448.
Bee, M.A., Kozich, C.E., Blackwell, K.J., and Gerhardt, H.C. (2001). Individual variation in
advertisement calls of territorial male green frogs, Rana clamitans: implications for individual
18 Bernal, X. E., Guarnizo, C. and Lüddecke, H. (2005). Geographic variation in advertisement
call and genetic structure of Colostethus palmatus (Anura, Dendrobatidae) from the Colombian
Andes. Herpetologica 61, 395-408.
Blair, W.F. (1958). Mating call in the speciation of anuran amphibians. The American
Naturalist 92, 27–51.
Blair, W.F. (1964). Isolating mechanisms and interspecies interactions in anuran amphibians.
The Quarterly Review of Biology 39, 334–344.
Blomberg, S.P., Garland Jr., T., and Ives, A.R. (2003). Testing for phylogenetic signal in
comparative data: behavioral traits are more labile. Evolution 57, 717-745.
Bosch, J., and Márquez, R. (2005). Female preference intensities on different call characteristics
and symmetry of preference above and below the mean in the iberian midwife toad Alytes
cisternasii. Ethology 111, 323—333.
Castellano, S. and Giacoma, C. (2000). Morphometric and advertisement call geographic
variation in polyploid green toads. Biological Journal of the Linnean Society 70, 341-360.
Castellano, S., Cuatto, B., Rinella, R., Rosso, A., and Giacoma, C. (2002). The advertisement
call of the European treefrogs (Hyla arborea): a multilevel study of variation. Ethology 108,
75–89.
Castellano, S., and Giacoma, C. (1998). Stabilizing and directional female choice for male calls
in the European green toad. Animal Behaviour 56, 275–287.
Castellano, S., Rosso, A., Doglio, S., and Giacoma, C. (1999). Body size and calling variation in
the green toad (Bufo viridis). Journal of Zoology 248, 83–90.
Chek, A.A., Bogart, J.P., and Lougheed, S.C. (2003). Mating signal partitioning in multi-species
assemblages: a null model test using frogs. Ecology Letters 6, 235–247.
Cocroft, R. B. and Ryan, M. J. (1995). Patterns of advertisement call evolution in toads and
chorus frogs. Animal Behaviour 49, 283-303.
Darwin, C.R. (1859). On the origin of species by means of natural selection, or the preservation
of favoured races in the struggle for life.
Davis, M.S. (1987). Acoustically mediated neighbor recognition in the North American
bullfrog, Rana catesbeiana. Behavioral Ecology and Sociobiology 21, 185–190.
Duellman, W.E., and Pyles, R.A. (1983). Acoustic resource partitioning in anuran communities.
Copeia 1983, 639–649.
Erdtmann, L., and Amézquita, A. (2009). Differential evolution of advertisement call traits in
dart-poison frogs (Anura: Dendrobatidae). Ethology 115, 801–811.
Ey, E. and Fischer, J. (2009). The ―acoustic adaptation hypothesis‖ - a review of the evidence
from birds, anurans and mammals. Bioacoustics 19, 21-48.
Feng, A.S., Arch, V.S., Yu, Z., Yu, X.J., Xu, Z.M., and Shen, J.X. (2009b). Neighbor–stranger
19 Feng, A.S., Riede, T., Arch, V.S., Yu, Z., Xu, Z.M., Yu, X.J., and Shen, J.X. (2009a). Diversity
of the vocal signals of concave-eared torrent frogs (Odorrana tormota): evidence for individual
signatures. Ethology 115, 1015–1028.
Gasser, H., Ameézquita, A., and Hödl, W. (2009). Who is calling? Intraspecific call variation in
the aromobatid frog Allobates femoralis. Ethology 115, 596–607.
Gerhardt, H.C. (1974). Behavioral isolation of the tree frogs, Hyla cinerea and Hyla andersonii.
American Midland Naturalist 91, 424–433.
Gerhardt, H.C. (1991). Female mate choice in treefrogs: static and dynamic acoustic criteria.
Animal Behaviour 42, 615–635.
Gerhardt, H.C. (1994). The evolution of vocalization in frogs and toads. Annual Review of
Ecology and Systematics 25, 293–324.
Gerhardt, H.C. (2005). Advertisement-call preferences in diploid-tetraploid treefrogs (Hyla
chrysoscelis and Hyla versicolor): implications for Mate choice and the evolution of
communication systems. Evolution 59, 395–408.
Gerhardt, H.C., and Huber, F. (2002). Acoustic communication in insects and anurans: common
problems and diverse solutions (University of Chicago Press).
Goicoechea, N., De La Riva, I., and Padial, J.M. (2010). Recovering phylogenetic signal from
frog mating calls. Zoologica Scripta 39, 141–154.
Haddad, C.F.B., Pombal, J., J.P., and Batistic, R.F. (1994). Natural hybridization between
diploid and tetraploid species of leaf-frogs, genus Phyllomedusa (Amphibia). Journal of
Herpetology 28, 425–430.
Hallgrímsson, B., and Hall, B.K. (2011). Variation: a central concept in biology (Academic
Press).
Hasegawa, H., Ueda, H. and Sumida, M. 1999. Clinal geographic variation in the advertisement
call of the Wrinkled Frog, Rana rugosa. Herpetologica 55, 318-324.
Howard, R.D., and Young, J.R. (1998). Individual variation in male vocal traits and female
mating preferences in Bufo americanus. Animal Behaviour 55, 1165–1179.
Lemmom, E.M. (2009). Diversification of conspecific signals in sympatry: geographic overlap
drives multidimensional reproductive character displacement in frogs Evolution 63, 1155–1170.
Mayr, E. (1963). Animal Species and Evolution (Cambridge, Massachusets: Belknap Press).
Ohmer, M. E., Robertson, J. M. and Zamudio, K. R. 2009. Discordance in body size, colour
pattern, and advertisement call across genetically distinct populations in a Neotropical anuran
(Dendropsophus ebraccatus). Biological Journal of the Linnean Society 97, 298-313.
Padial, J.M., and De La Riva, I. (2009). Integrative taxonomy reveals cryptic Amazonian
species of Pristimantis (Anura: Strabomantidae). Zoological Journal of the Linnean Society
20 Podos, J. (2001). Correlated evolution of morphology and vocal signal structure in Darwin's
finches. Nature 409, 185-188.
Poole, K.G., and Murphy, C.G. (2007). Preferences of female barking treefrogs, Hyla gratiosa,
for larger males: univariate and composite tests. Animal Behaviour 73, 513-524.
Pröhl, H., Hagemann, S., Karsch, J., and Höbel, G. (2007). Geographic variation in male sexual
signals in strawberry poison frogs (Dendrobates pumilio). Ethology 113, 825-837.
Pröhl, H., Koshy, R.A., Mueller, U., Rand, A.S., and Ryan, M.J. (2006). Geographic variation
of genetic and behavioral traits in Northern and Southern Túngara frogs. Evolution 60, 2006.
Rosso, A., Castellano, S.and Giacoma, C. (2006). Preferences for call spectral properties in
Hyla intermedia. Ethology 112, 599-607.
Ryan, M.J. (1980). Female mate choice in a Neotropical frog. Science 209, 523-525.
Ryan, M.J., Cocroft, R.B., and Wilczynski, W. (1990). The role of environmental selection in
intraspecific divergence of mate recognition signals in the cricket frog, Acris crepitans.
Evolution 44, 1869-1872.
Smith, M. J., Roberts, J. D., Hammond, T.J. and Davis, R. A. (2003). Intraspecific variation in
the advertisement call of the Sunset Frog Spicospina flammocaerulea (Anura: Myobatrachidae):
A frog with a limited geographic distribution. Journal of Herpetology 37, 285-291.
Snyder, W. F. and Jameson, D. L. (1965). Multivariate geographic variation of mating call in
populations of the Pacific Tree Frog (Hyla regilla). Copeia 1965, 129-142.
Sullivan, B.K. (1982). Significance of size, temperature and call attributes to sexual selection in
Bufo woodhousei australis. Journal of Herpetology 16, 103-106.
Sullivan, B.K. (1989). Interpopulational variation in vocalizations of Bufo woodhousii. Journal
of Herpetology 23, 368-373.
Sullivan, B. K. (1992). Sexual selection and calling behavior in the American Toad (Bufo
americanus). Copeia 1992, 1-7.
Wells, K.D. (1977). The social behaviour of anuran amphibians. Animal Behaviour 25,
666-693.
Wiley, R. H. and Richards D. G. (1978). Physical constraints on acoustic communication in the
atmosphere: implications for the evolution of animal vocalizations. Behavioral Ecology and
Sociobiology 3, 69-94.
Wilkins, M.R., Seddon, N., and Safran, R.J. (2013). Evolutionary divergence in acoustic
signals: causes and consequences. Trends in Ecology & Evolution 28, 156-155.
Wollenberg, K. C., Glaw, F. Meyer, A. and Vences, M. (2007). Molecular phylogeny of
Malagasy reed frogs, Heterixalus, and the relative performance of bioacoustics and
color-patterns for resolving their systematics. Molecular Phylogenetics and Evolution 45, 14-22.
Wright, S. (1968). Evolution and the Genetics of Populations: A Treatise, Vol 4 (Chicago:
21 Figure 1: Variability of six acoustic parameters from the advertisement call of 15
species of Phyllomedusa at different levels. Coeficient of variation was calculated based
on a stratified hierarchical subsampling method in which we repeatedly drew from our
data pool five different calls. This procedure was repeated 1,000 times for each
22 Figure 2: Results of the hierarchical ANOVA showing what percentage of the
variability of the advertisement call of 15 species of Phyllomedusa is attributed to each
level for all acoustic parameters: dominant frequency (df); number of pulses (pn); pulse
23 Table 1: Detailed step by step procedure used to draw calls from our data pool in the
stratified hierarchical subsampling method used to calculate the coefficient of variation
of the advertisement call of Phyllomedusa at different levels for each acoustic
parameter.
Level Step 1 Step 2 Step 3 Step 4 Step 5
Intra-individual Draw one specie Draw one individual Draw five different calls from this individual
Calculate CV Repeat 1,000 x
Intra-population Draw one population of P. nordestina Draw five different individuals from this population
Draw one call from each individual
Calculate CV Repeat 1,000 x
Inter-population Draw five different populations of P. nordestina Draw one individual from each population
Draw one call from each individual
Calculate CV Repeat 1,000 x
Intra-specific Draw one species
Draw five different individuals
Draw one call from each individual
Calculate CV Repeat 1,000 x
Inter-specific Draw five different species
Draw one individual from each specie
Draw one call from each individual
24 Table 02: Advertisement call description for all species of Phyllomedusa recorded. Mean, standard deviation, maximum and minimum values
for each acoustic parameter.
Specie Number of individuals Number of calls Call duration (s) Dominant frequency (Hz) Call interval (s)
Number of pulses Pulse rate (pulse/s)
Pulse lenght (s)
Phyllomedusa nordestina 100 2227
0.039 ± 0.017 (0.01-0.089)
2079.086 ± 193.94 (1500-2625)
9.085 ± 26.595 (0.015-290.299)
3.814 ± 0.913 (2-8)
109.906 ± 32.993 (40-230.769)
0.005 ± 0.001 (0.0005-0.01)
Phyllomedusa azurea 4 45
0.029 ± 0.0014 (0.026-0.034)
2291.151 ± 59.219 (2153.3-2411.7)
21.599 ± 20.662 (1.432-88.384)
4 ± 0 (4-4)
135.705 ± 7.606 (111.111-150)
0.005 ± 0.0005 (0.004-0.006)
Phyllomedusa bahiana 10 115
0.311 ± 0.171 (0.134-0.992)
1141.304 ± 148.107 (937.5-1312.5)
18.408 ± 14.256 (0.986-74.14)
14.495 ± 4.170 (7-26)
43.085 ± 9.245 (20.618-63.492)
0.014 ± 0.004 (0.006-0.021)
Phyllomedusa camba 5 260
0.039 ± 0.008 (0.024-0.074)
668.509 ± 105.429 (562.5-1125)
5.812 ± 15.196 (0.087-121.42)
4.711 ± 1.117 (3-9)
112.587 ± 8.558 (88.888-142.857)
0.005 ± 0.0005 (0.003-0.006)
Phyllomedusa distincta 9 113
0.230 ± 0.051 (0.134-0.35)
1299.226 ± 99.332 (1125-1875)
22.976 ± 12.378 (9.2-82.562)
6.832 ± 1.059 (5-10)
27.883 ± 3.640 (15.244-35.714)
0.017 ± 0.001 (0.013-0.024)
Phyllomedusa hypocondrialis 11 354
0.027 ± 0.005 (0.017-0.048)
1970.339 ± 98.021 (1687.5-2250)
8.157 ± 19.462 (0.203-195.219)
4.070 ± 0.747 (3-7)
141.152 ± 14.440 (103.448-200)
0.005 ± 0.0009 (0.003-0.008)
Phyllomedusa iheringii 7 164
0.318 ± 0.065 (0.19-0.494)
1240.473 ± 132.010 (937.5-1500)
17.350 ± 12.203 (1.011-109.484)
9.310 ± 1.798 (6-14)
27.735 ± 3.038 (20.746-36.363)
0.017 ± 0.003 (0.012-0.025)
Phyllomedusa rohdei 7 47
0.150 ± 0.072 (0.078-0.415)
2014.628 ± 189.398 (1687.5-2250)
37.132 ± 43.132 (2.773-183.164)
5.234 ± 2.397 (3-11)
33.164 ± 4.555 (25.157-46.391)
0.018 ± 0.003 (0.011-0.024)
Phyllomedusa tetraploidea 7 121
0.033 ± 0.090 (0.194-0.645)
1182.335 ± 107.827 (937.5-1312.5)
18.038 ± 13.749 (2.24-77.324)
9.280 ± 2 (5-15)
29.389 ± 3.812 (20.634-38.095)
0.015 ± 0.001 (0.010-0.022)
Phyllomedusa vaillantii 4 12
0.043 ± 0.007 (0.03-0.053)
1609.375 ± 148.680 (1312.5-1875)
64.123 ± 65.685 (11.986-180.149)
7.916 ± 1.311 (5-10)
178.123 ± 15.675 (155.555-212.121)
0.004 ± 0.0006 (0.002-0.005)
Phyllomedusa burmeisteri 1 5
0.118 ± 0.010 (0.1-0.126)
1102.5 ± 154.0.65 (1033.6-1378.1)
8.396 ± 4.860 (3.724-15.224)
6.8 ± 0.447 (6-7)
51.450 ± 0.778 (50.420-52.173)
0.004 ± 0.0002 (0.004-0.004)
Phyllomedusa megacephala 2 20
0.321 ± 0.085 (0.25-0.566)
1809.375 ± 139.717 (1687.5-2062.5)
42.742 ± 34.665 (7.033-137.449)
13.4 ± 3.589 (8-22)
39.782 ± 7.990 (23.381-54.140)
0.005 ± 0.0006 (0.004-0.006)
Phyllomedusa ayeaye 5 96
0.093 ± 0.039 (0.025-0.16)
1471.444 ± 167.530 (1205.9-1722.7)
7.3 ± 12.846 (0.253-60.04)
5.625 ± 1.135 (3-10)
71.520 ± 40.508 (30.303-208.33)
0.008 ± 0.002 (0.003-0.015)
Phyllomedusa oreades 7 200
0.025 ± 0.005 (0.018-0.068)
1679.589 ± 153.0.89 (1125-2067.2)
15.362 ± 42.189 (0.192-352.912)
3.925 ± 0.641 (3-7)
1140.519 ± 23.248 (79.365-285.714)
0.004 ± 0.001 (0.002-0.007)
Phyllomedusa centralis 9 215
0.037 ± 0.014 (0.019-0.099)
1271.514 ± 174.469 (937.5-1550.4)
7.552 ± 12.433 (0.2-79.318)
4.423 ± 0.838 (3-7)
115.818 ± 28.474 (45.977-166.666)
25 Table 3: Influence of the environmental temperature on the acoustic parameters of the
advertisement call of 15 species of Phyllomedusa. Regression models included the
mean value of the acoustic parameter for each individual and the species was included
as a block.
Source n F p
Call Interval 172 3.035 0.0833
Dominant Frequency 172 4.612 0.0332
Call Duration 172 19.329 <0.001
Pulse Length 172 9.499 0.002
Number of Pulses 172 2.393 0.123
Pulse Rate 172 21.142 <0.001
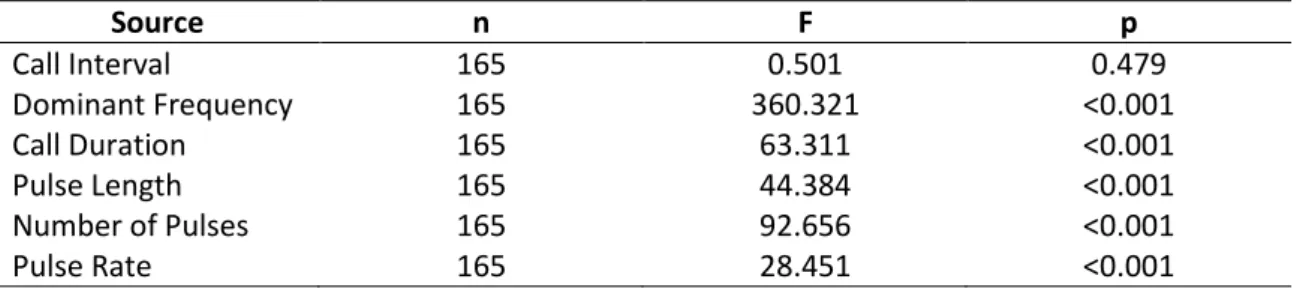
Table 4: Influence of body size on the acoustic parameters of the advertisement call of
15 species of Phyllomedusa. Regression models included the mean value of the acoustic
parameter for each individual and the species was included as a block.
Source n F p
Call Interval 165 0.501 0.479
Dominant Frequency 165 360.321 <0.001
Call Duration 165 63.311 <0.001
Pulse Length 165 44.384 <0.001
Number of Pulses 165 92.656 <0.001
Pulse Rate 165 28.451 <0.001
Table 5: Results of Mantel test evaluating which acoustic parameters of the
advertisement call of Phyllomedusa nordestina are correlated to the geographic distance
between populations.
Source r p
Call Duration 0.064 0.0492
Dominant Frequency 0.0346 0.1896
Number of Pulses 0.0177 0.3174
Pulse Length -0.0169 0.6096
Pulse Rate 0.1099 0.0039
Call Interval -0.0038 0.4668
26 Table 6: Phylogenetic signal for acoustic parameters and body size of Phyllomedusa calculated through Blomberg’s K (Blomberg et al., 2003)
Source Blomberg´s K PIC.mean PIC.rdn.mean P
Call Duration 0.735 0.0011 0.0043 0.009
Dominant Freuency 0.6418 16689.364 56643.053 0.007
Call Interval 0.691 23.480 74.192 0.016
Number of Pulses 0.535 0.964 2.696 0.023
Pulse Rate 0.794 198.234 729.991 0.004
Pulse Length 0.566 <0.001 <0.001 0.027