UNIVERSIDADE FEDERAL DO RIO GRANDE DO NORTE PROGRAMA PÓS-GRADUAÇÃO EM ECOLOGIA
STRUCTURE OF MUTUALISTIC NETWORKS BETWEEN BATS AND PLANTS AND OTHER
FEEDING STRATEGIES IN A SEMIARID CAATINGA FOREST OF RIO GRANDE DO
NORTE,BRAZIL
EUGENIA CORDERO SCHMIDT
Structure of mutualistic networks between bats and plants and other feeding
strategies in a semiarid Caatinga forest of Rio Grande do Norte, Brazil
Eugenia Cordero Schmidt
Orientador: Eduardo Martins Venticinque, Universidade Federal do Rio Grande do Norte
Co-orientador: Bernal Rodríguez Herrera, Universidad de Costa Rica
Dissertação apresentada ao Programa de Pós Graduação em Ecologia da Universidade Federal do Rio Grande do Norte, como parte do requerimento para obtenção do título de Mestre em Ecologia.
Catalogação da Publicação na Fonte. UFRN / Biblioteca Setorial do Centro de Biociências
Schmidt, Eugenia Cordero.
Structure of mutualistic networks between bats and plants and other feeding strategies in a semiarid caatinga forest of Rio Grande do Norte, Brazil / Eugenia Cordero Schmidt. – Natal, RN, 2016.
92 f.: il.
Orientador: Prof. Dr. Eduardo Martins Venticinque. Coorientador: Prof. Dr. Bernal Rodríguez Herrera.
Dissertação (Mestrado) – Universidade Federal do Rio Grande do Norte. Centro de Biociências. Programa de Pós-Graduação em Ecologia.
1. Chiroptera. – Dissertação. 2. Morcego. – Dissertação. 3. Caatinga. – Dissertação. 4. Rede de interações. – Dissertação. 5. Hábitos alimentares. – Dissertação. I. Venticinque, Eduardo Martins. II. Herrera, Bernal Rodríguez. III. Universidade Federal do Rio Grande do Norte. IV. Título.
Structure of mutualistic networks between bats and plants and other feeding
strategies in a semiarid Caatinga forest of Rio Grande do Norte, Brazil
Eugenia Cordero Schmidt
Orientador: Eduardo Martins Venticinque, Universidade Federal do Rio Grande do Norte
Co-orientador: Bernal Rodríguez Herrera, Universidad de Costa Rica
Dissertação apresentada ao Programa de Pós Graduação em Ecologia da Universidade Federal do Rio Grande do Norte, como parte do requerimento para obtenção do título de Mestre em Ecologia.
APROVADA em 19 de fevereiro de 2016
Dr. ISABEL CRISTINA SOBREIRA MACHADO, UFPE Examinador Externo à Instituição
Dr. CARLOS ROBERTO SORENSEN DUTRA DA FONSECA, UFRN Examinador Interno
D
EDICADA À MARAVILHOSA E ÚNICAA
GRADECIMENTOSOs agradecimentos vêm do coração, e ali é onde eu guardo uma parte de todas estas pessoas que fizeram tudo isto possível e que de uma forma ou outra me fizeram apreciar e desfrutar
este processo:
A JUANK. A minha familia, que a distância me deram um apoio inestimável: PA, MA, GABY. A meus orientadores de tese e de vida, duas pessoas com um conhecimento e um coração enormes: DADAO e BERNAL. A pessoas fundamentais: SEU JOAO E FAMILIA, BRUNA, RAGDE,
MARINA, PICHI e LORENZO. A minha primeira família brasileira: MARÍN, POCAS, HADA, LAURA e GUSTAV. A toda a família brasileira ampliada: TIDA, CLARINHA, LAURINHA, MARÍA,
LUCAO E ALANA (por ser meus pais substitutos na Bahia), PHILLIP, LICA, DUKIN, HELO, ANGELICA, RAFA, JUANPI, RODRIGO, PATY, MARIA CLARA, ANDRE, GUIGA (Obrigada pela boa disposição e ajuda com as análises), DRI, JULIA, JB, FELIPE, CAROL, HELDER, MARILIA, MARIA CLARA e PUALO. A meus colaboradores e amigos: ANA, TONNY e BRUNA (de novo porque foi
muita a ajuda, as risadas, e o companheirismo). A os professors que se tornaram amigos: RODRIGO, CARLINHOS, GIS, MARCIO, ADRIAN e REGINA. A meus amigos da vida...distantes, mas sempre perto: CHRISTINA (minha editora favorita, MUCHAS gracias), SOL (Clup), KATE,
MARCE, ELENA, MAGGIE, JOSELO, MAU, ADRI, TATÍ, MILI, ANDREA, ADRIANA e BALA. E claro, instituições e organizações que fizeram possível esta pesquisa: CAPES, CNPq, WCS,
TFCA, LIMVE, LAMIV, LER e Herbário UFRN.
Eu coloquei ele em primeiro lugar e eu coloco ele no último, pois do começo ao fim ele esteve ao meu lado como um complemento perfeito: JUANK
Um agradecimento especial e fundamental para a natureza, a Caatinga seus morcegos e plantas, por ter me acolhido tão excepcionalmente. E a quem me deu paz e iluminação sempre que eu pedi,
gratidão.
C
ONTENTSGENERAL INTRODUCTION 11
REFERENCES 13
CHAPTER I 15
STRUCTURE OF MUTUALISTIC NETWORKS BETWEEN BATS AND PLANTS IN A SEMIARID
CAATINGA FOREST OF RIO GRANDE DO NORTE, BRAZIL. 15
INTRODUCTION 17
MATERIALS AND METHODS 19
RESULTS 26
DISCUSSION 39
CONCLUSIONS 44
ACKNOWLEDGEMENTS 45
REFERENCES 45
CHAPTER II 51
ARE LEAVES A GOOD OPTION IN CAATINGA’S MENU? FIRST RECORD OF FOLIVORY IN
ARTIBEUS PLANIROSTRIS (PHYLLOSTOMIDAE) IN THE SEMIARID FOREST, BRAZIL 51
INTRODUCTION 51
MATERIALS AND METHODS 52
RESULTS 56
ACKNOWLEDGMENTS 60
CHAPTER III 66
FIRST INSIGHT TO THE BIOLOGICAL ASPECTS AND RANGE EXTENSION OF THE BRAZILIAN ENDEMIC VIEIRA’S FLOWER BAT (XERONYCTERIS VIEIRAI GREGORIN AND DITCHFIELD,
2005). 67
INTRODUCTION 68
MATERIALS AND METHODS 69
RESULTS 71
DISCUSSION 78
ACKNOWLEDGEMENTS 82
REFERENCES 83
SUPPLEMENTARY MATERIAL 1 89
RESUMO: A Caatinga é uma formação florestal esclerófila, decídua e espinhosa.
Situa-se em uma região Situa-semi-árida, com cerca de 730 000 km2, exclusiva do território brasileiro. Este ambiente apresenta grande variação de tipos de vegetação que foram atribuídas à variações em larga escala no clima, padrões de geomorfologia e diferenças de pequena escala em relevo e solos. A precipitação escassa e flutuante das regiões áridas e semi-áridas, exercem um forte controle sobre: histórias de vida, características fisiológicas e composição de espécies de sua biota. Pelo menos 77 espécies de
morcegos das 178 espécies presentes no Brasil são encontrados na Caatinga, dos quais 13 são frugívoros e cinco nectarivorous incluindo o endémica Xeronycteris vieirai. Os morcegos são conhecidos por desempenharem papéis importantes no controle de pragas, polinização e dispersão de sementes. No entanto, pouca informação foi gerada sobre o papel ecológico dessas espécies em um ambiente como Caatinga. Em geral, esse habitat é o ecossistema brasileiro mais negligenciado em termos de pesquisa e conservação da sua biodiversidade. Especificamente no caso dos morcegos, o Rio Grande do Norte possui uma das maiores lacunas de conhecimento no Brasil. Os dados aqui
ABSTRACT: Caatinga is a deciduous thorny woodland and sclerophyllous vegetation,
encountered in a semi-arid region of around 730 000 km2 entirely within the Brazilian territory . This environment presents high variation of vegetation types that have been attributed to large-scale variations in the climate, geomorphology patterns, and small-scale differences in topography and soils. The sparse and fluctuation precipitation of arid and semiarid regions is believed to exert strong control over life histories, physiological characteristics, and species composition of their biotas.
At least 77 bat species of the 178 species present in Brazil are found in Caatinga, of
which 13 are frugivorous and five nectarivorous including the endemic Xeronycteris
vieirai. Bats are known play important roles in pest control, pollination and seed dispersal, nonetheless little information has been generated regarding the ecological role these species play in an environment like Caatinga. In general, this habitat is the most neglected Brazilian ecosystem in terms of investigation and conservation of its biodiversity. Specifically in the case of bats, Rio Grande do Norte is one of the biggest knowledge gaps in Brazil. The data presented here represent one of the first formal investigations with bats in the Caatinga in Rio Grande do Norte. Information on the nested and asymmetric structure of the mutualistc network between
GENERAL INTRODUCTION
Caatinga is a deciduous thorny woodland and sclerophyllous vegetation, encountered in a semi-arid region of around 730 000 km2 entirely within the Brazilian territory (Leal et al., 2003). This environment presents high variation of vegetation types that have been attributed to large-scale variations in the climate, geomorphology patterns, and small-scale variations in topography and soils (da Costa et al., 2007).
Meteorological parameters are extreme here, with high solar radiation, low cloudiness, high annual average temperature, low rates of relative humidity, high evapotranspiration, and especially, the low and very irregular precipitations, limited, in most of the area, in a short period in the year (Bullock et al., 1995; Leal et al.,
2003). The sparse and variable precipitation of arid and semiarid regions is believed to exert strong control over life histories, physiological characteristics, and species composition of their biotas (Chesson et al., 2004). Floral resources and rewards in the Caatinga’s vegetation are very diversified as well as the pollination syndromes despite all climatic restrictions (Machado and Lopes, 2004).
The Caatinga ecosystem plays an important role in maintaining regional macro-ecological processes and indirectly supports regions with greater diversity and endemism in Brazil and the world (Leal et al., 2003). At least 77 bat species of the 178 species present in Brazil are found in Caatinga, representing 44.7% of the mammal species in this habitat (Oliveira et al., 2003; dos Reis et al., 2007; Bernard
et al., 2012; Nogueira et al., 2014). Bat pollination in Caatinga accounts for at least 13.1% of plants species belonging to 9 families (Machado and Lopes, 2004).
The most diverse family of bats in the Neotropics is Phyllostomidae with160 species distributed in tropical and subtropical areas of the Americas (Simmons, 2005). It is also the most diverse family in Brazil with 92 species (Nogueira et al., 2014), of which 39 are present in Caatinga (Paglia et al., 2012). This family stands out due to its unique diversity in high feeding specializations. Phyllostomid bats feed on insects, blood, small vertebrates, fruits, nectar and pollen (Datzmann et al., 2010). These variety of diets are reflected in the environmental services they provide. They play important roles in pest control, pollination and seed dispersal (Fleming 1993; Kunz et al., 2011). Nectarivorous and frugivorous bats are responsible for gene flow within and between plant populations, through pollination and seed dispersal (Horner et al.,
Among the Phyllostomid bat species present in Caatinga, there are 13 frugivorous
species and 5 nectarivorous, of which two are endemic to this biome, one
frugivoruous (Chiroderma vizottoi) and other nectarivorous (Xeronycteris vieirai)
(Paglia et al., 2012). Little information has been generated regarding the ecological role these species play in an environment like Caatinga. In general, this habitat is the most neglected Brazilian ecosystem in terms of investigation and conservation of its biodiversity (Zanella and Martins, 2008). According to Bernard et al., (2010) only a very low percentage of Catinga’s total area has been minimally sampled regarding bats, the authors emphasized that Rio Grande do Norte as a whole is one of the biggest knowledge gaps in Brazil.
The data presented here represent one of the first formal investigations with bats for the Caatinga in Rio Grande do Norte. This dissertation is divided into three chapters focusing mainly on the interactions between plants and Phyllostomid bats from a feeding perspective as well as a chapter focused on the Caatinga’s endemic species,
Xeronycteris vieirai.
The first chapter “Structure of mutualistic networks between nectar-feeding bats and plants in a semiarid Caatinga forest of Rio Grande do Norte, Brazil”, discusses the structure of the interactions network between nectarivorous bats and the plants they feed on. The aim was to understand how these relationships are structured and their stability. Besides an inquiry into the possible existence of differences in the use of plants within different species of nectar-feeding bats and differences in their diet over a period of six months was performed.
The second chapter “Are leaves a good option in Caatinga’s menu? First record of folivory in Artibeus planirostris (Phyllostomidae) in the semiarid forest, Brazil”, here data of the first evidence of folivory by the fuit-eating bat Artibeus planirostris is presented. This is also the first record of this feeding strategy for a semi arid environment like Caatinga. These findings were submitted to the Journal Acta Chiropterologica in partnership with the MSc. Maricélio Medeiros Guimarães who during his fieldwork in the Caatinga of Bahia also found evidence of folivory in A. planirostris, making possible to characterize this feeding strategy in a more complete way.
vieiriai are presented. This species is cataloged as Data Deficient by the IUCN. The information about its reproduction, roost, diet and range extension presented here depict a step closer in the understanding of the species basic requirements in this poorly studied and highly impacted habitat.
REFERENCES
Bernard E., L. Aguiar and R. B. Machado. 2011. Discovering the Brazilian bat fauna: A task for two centuries?. Mammal Review, 41(1), 23-39.
Bernard E., L.M Aguiar, D. Brito, A. P. Cruz-Neto, R. Gregorin, R. B Machado, M. Oprea, A. P. Paglia and V.C. Tavares. 2012. Uma análise de horizontes sobre a conservação de morcegos no Brasil. Mamíferos do Brasil: Genética,
Sistemática, Ecologia e Conservação 2: 19-35.
Bullock S. H., H. A. Mooney and E. Medina. 1995. Seasonally dry tropical forests. Cambridge University Press.
Chesson P., R. L. Gebauer, S. Schwinning, N. Huntly, K. Wiegand, M. S. Ernest, A. Sher, A. Novoplansky and J. F. Weltzin. 2004. Resource pulses, species interactions, and diversity maintenance in arid and semi-arid environments. Oecologia 141(2): 236-253.
da Costa R. C., F. S. de Araújo and L. W. Lima-Verde. 2007. Flora and life-form spectrum in an area of deciduous thorn woodland (caatinga) in northeastern, Brazil. Journal of Arid Environments, 68(2), 237-247.
Datzmann T., O. von Helversen and F. Mayer. 2010. Evolution of nectarivory in phyllostomid bats (Phyllostomidae Gray, 1825, Chiroptera: Mammalia). BMC Evolutionary Biology, 10(1), 165.
dos Reis N. R., M. N. Fregonezi, A. L. Peracchi and O. A. Shibatta. 2013. Morcegos do brasil. Guia de Campo. Technical Books Editora, Rio Janeiro.
Fleming T. H. 1993. Plant-visiting bats. American Scientist 81: 460-467.
Horner M. A., Fleming, T. H., and Sahey, C. T. (1998). Foraging behaviour and energetics of a nectar-feeding bat, Leptonycteris curasoae (Chiroptera: Phyllostomidae). Journal of Zoology, 244(4), 575-586.
Kunz T. H., E. Braun de Torrez, D. Bauer, T. Lobova and T. H. Fleming. 2011. Ecosystem services provided by bats. Annals of the New York Academy of Sciences 1223(1): 1-38.
Leal I. R., M. Tabarelli and J. M. Cardoso. 2003. Ecologia e Conservação da Caatinga. Editora Universitária UFPE, Recife.
Leal I. R., J. D. Silva, M. A. Tabarelli and T. E. Lacher Jr. 2005. Mudando o curso da conservação da biodiversidade na Caatinga do Nordeste do Brasil.
Lobova T. A., C. K. Geiselman and A. S. Mori. 2009. Seed Dispersal by Bats in the Neotropics. Memoirs of The New York Botanical Garden 101.The New York Botanical Garden Press, New York.
Nogueira M. R., I. P. Lima, R. Moratelli, V. da Cunha Tavares, R. Gregorin and A. L. Peracchi. 2014. Checklist of Brazilian bats, with comments on original records. Check List 10(4): 808-821.
Oliveira J. A., P. R. Gonçalves and C. R. Bonvicino. 2003. Mamíferos da Caatinga. Pp. 275-337, In: Ecologia e conservação da Caatinga (IR Leal, M Tabarelli y JMC Silva). Editora Universitária UFPE, Recife.
Paglia A, G.A.B. Fonseca, A.B. Rylands, G. Herrmann, L.M.S. Aguiar, A.G.
Chiarello, Y.L.R. Leite, L.P. Costa, S. Siciliano, M.C.M. Kierulff, S.L. Mendes, V.C. Tavares, R.A. Mittermeier and J.L. Patton. 2012. Lista anotada dos
mamíferos do Brasil. 2a edição. Occasional Papers in Conservation Biology 6:1–76
Simmons N. 2005. Order Chiroptera. In: D. E. Wilson, D. M. Reeder. Mammalian Species of the World: A Taxonomic and Geographic Reference. Eds. Johns Hopkins Univ. Press, Baltimore.
C
HAPTER
I
S
TRUCTURE OF
MUTUALISTIC
NETWORKS BETWEEN
BATS
AND PLANTS
IN A SEMIARID
C
AATINGA
FOREST
OF
R
IO
G
RANDE DO
N
ORTE
,
B
RAZIL
.
Structure of mutualistic networks between nectar-feeding bats and plants in a semiarid Caatinga forest of Rio Grande do Norte, Brazil.
Eugenia Cordero-Schmidt1, Juan Carlos Vargas-Mena1, Bruna Carvalho1, Paulino Oliveira2, Francisco de Assis R. Santos2, Rodrigo A. Medellín3, Bernal Rodriguez-Herrera4 and Eduardo M. Venticinque1
1
Departamento de Ecologia, Universidade Federal do Rio Grande do Norte, 59078900 Lagoa Nova Natal, RN, Brazil; E-mail: [email protected]
2
Laboratório de Micromorfologia Vegetal, Universidade Estadual de Feira de Santana, 44036-900, Novo Horizonte, BA, Brazil
3
Instituto de Ecología, Universidad Nacional Autónoma de México, 70-275, 04510 México D. F., México
4
Escuela de Biología, Universidad de Costa Rica, 2060 Montes de Oca, San José, Costa Rica
ABSTRACT
Biodiversity encloses not just different species but also the interactions among them. Ecological networks seek for patterns with a strong representation of the interactions between species highlighting their global interdependence. The study of these
networks represents a conceptual and methodological challenge in highly diversified communities with several interactions. Bats exhibit high degrees of functional, compositional and structural diversity. Sixteen of the total 178 bat species occurring in Brazil are nectar-feeding bats and at least five of these species co-occur in the semi arid Caatinga ecosystem. Mutualistic networks between nectar-feeding bats and plants in semi arid environments have not been broadly studied. Our main objective was to describe the network of mutualistic interactions between nectar-feeding bats and plants in a semi arid forest in Caatinga of Rio Grande do Norte, to understand how these interactions varied according to resource use between bat species and resources availabilities temporally. As expected this network presented a pattern of nestedness and asymmetry. Showing this is a cohesive and resilient system where differences between the plants species used by bats varied among the bat species and among the sampled months.
INTRODUCTION
Biodiversity encloses not just different species but also the interactions among them. However, the study of biodiversity has typically been focused on species diversity and genetic diversity, leaving aside the ecological interactions (Magurran, 2004; McCann 2007; Bascompte, 2009). Ecological networks look for patterns with a strong representation of the interactions between species (nodes) highlighting their global interdependence (Bascompte, 2009; Guimarães et al., 2011). From a more applied, conservation-minded perspective, an understanding of the ecological networks can be used to measure the stability (resilience and resistance) of the ecosystems and to explore and predict functional responses of ecosystems to structural changes such as the biodiversity loss due to different human activities (Dunne et al., 2002; Bascompte et al., 2006a; Ives and Carpenter 2007; Okuyama and Holland 2008).
These network patterns seem to be common regardless the species
composition, geographic location and other factors (Bascompte et al. 2003, 2006b; Memmott et al. 2004, 2007; Okuyama and Holland 2008, Tylianakis et al., 2008). Nonetheless, it is a conceptual and methodological challenging to address this type of research in highly diversified communities with several interactions (Olesen et al.,
2007). Bats represent an example of this type of situation because they exhibit high degrees of functional, compositional and structural diversity. Bats account for at least 1200 species around the world, representing 22% of the total number of mammal
species of the world (Simmons, 2005) and are found throughout the globe in a broad geographic distribution (Kunz and Parsons, 2009). Bats play an important role in pollination, seed dispersal and pest control (Fleming 1993; Kunz et al., 2011). Nectar-feeding bats are known to pollinate ecologically and economically important group of plants classified in 28 orders, 67 families and about 528 species of angiosperms in the Neotropics (Flemming et al., 2009). Nectar-feeding bats are mainly attracted to large inflorescences or large single flowers with wide opening, long and numerous stamens, high nectar and pollen production and light colored corollas with unpleasant odors (Muchhala and Jarrin 2002) this pollination syndrome is called chiropterophily. Non-the less, it has also been demonstrated that bats also visit flowers that do not present this specific chiropterophily characteristics (Vogel et al., 2004).
One of the main characteristics of arid and semi arid environments is that resources are supplied in pulses due to the limited and variability in precipitation, exerting adaptation challenges to both, plants and animals (Chesson et al., 2004). The seasonal pattern of resource availability seems to be a key factor controlling species composition and therefore it also influences the niche dynamics and coexisting patterns of consumer populations (Kneitel and Chase, 2004). Up to six species of nectar-feeding bats, can be found coexisting in a tropical dry forest (Santos and Arita, 2002). Neotropical semi arid and arid lands are especially rich in bat-pollinated species and previous research in arid and semi arid regions of Mexico and South America indicates that certain species of columnar cacti depend heavily on pollination by one or more species of phyllostomid bats (Meffe, 1998). Sixteen of the total 178 bat species occurring in Brazil are nectar-feeding bats (Nogueira et al., 2014; Moratelli and Dias, 2015), and at least five of these nectarivorous bat species are distributed in the Caatinga
vegetation covering a Semiarid region of around 730 000 km2 in northeastern Brazil (Leal et al., 2003).
Mutualistic networks between nectar-feeding bats and plants in semi arid environments have not been broadly studied. Ecological attributes, such as the specific resource dependence of glossophagines suggest that this group of bats might be more susceptible to extinction than other neotropical bats (Meffe, 1998). Making them an interesting and important group for the study of their interaction network from the standpoint of stability and resilience of the communities of bats and plants. Our main objective was to (1) describe the network of mutualistic interactions
between nectar-feeding bats and plants in a semi arid forest in Caatinga of Rio Grande do Norte by first characterizing the assembly of nectarivous bats and the plants they feed on, to understand how these interactions varied according to resource use (2) between bat species and resources availabilities (3) temporally.
We expect to find (1) a network pattern characterized by nestedness and asymmetry in the mutualistic network of interactions between nectarivorous bats and the plants from which they feed, in this semiarid ecosystem. On the other hand, we expect (2) differences between the plant species used by the different nectar-feeding bat species, and (3) we expect a temporal variation related to the use and resource availability by months. For both (2) and (3), we expect to find central plant species characterized to be very abundant and used by all species of bats in a high frequency, there will also be species of plant less abundant but used by most of the bat species and finally there will be species that regardless of their abundance and availability wont be used by bats.
MATERIALS AND METHODS
Study site
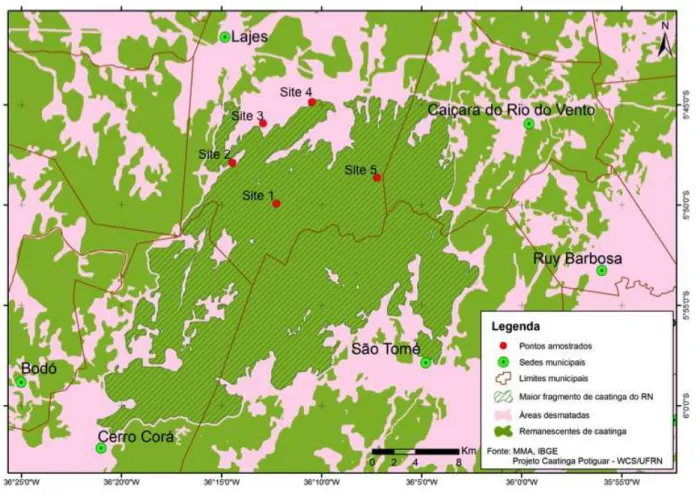
Five sampling sites, with at least 4.5 km between each other, were selected (Fig. 1). They are located either inside or in the border of the largest fragment of Caatinga of RN, with an approximate area of 53,500 hectares.
Site 1. Sitio Santa Rosa (S 05º49'56.2"- W36º12'16.0").- Located at 310 meters of altitude. On the site there a depression of the basin of a river (which has been dry for around 5 years) that ends in an artificial "açude" of around 20 by 20 meters, it is filled with water only during the rainy season. About 10 years ago the place was used to remove wood to make charcoal and there was also livestock.
Site 2. Fazenda Santo Antonio (S05º47'53.7"-W36º14'28").- Located at 332 m of altitude. It is a private property where the forest is intact; it is only crossed by a road used to transport limestones. There is a small cave that is been used as roosts for at least three species bats. People visit this cave occasionally. Site 3. Sitio Joazeiro (S05º45'55.7"-W36º12'55.7").- Located at 230 meters of
altitude. It lies at the foot of the "Serra do Feiticeiro". It is a place that has the characteristic "caatinga baixa". Occasionally there are cattle present. In the past, part of the forest was cut to grow cotton. It is crossed by a river basin that has been dry for more than five years.
Site 4. Serra do Feiticeiro (S05º44'52.0"-W36º10'29.3").- Located at 350 meters of altitude. It is near the top of the "Serra do Feiticeiro". Thirty years ago mining was practiced in this place, about 15 years ago this activity stopped leaving around six different sizes abandoned mines. These abandoned mines are being used by at least 5 species of bats as roosts. This is the place where the wind power parks will be installed.
Site 5. Sitio Bonfim (S05º48'37.9"-W36º07'14.0").- Located at 270 meters of altitude. Site crossed by a river that has been dry more than five years. A mining company, currently active, is located at 4 kilometers from our sampling site. There is a street crossing our site that is used as one option to as one of the options to access the mining company.
Fig. 1 Map showing the five sampling sites in the largest fragment of Caatinga of RN, Lajes.
Bat assembly
Sampled bats were identified in the field using several systematic keys and species diagnosis (Gregorin and Taddei, 2002, Gardner, 2007; dos Reis et al., 2007; Miranda et al., 2011; Araújo and Langguth, 2012; dos Reis et al., 2013).
Bats were sexed, weighed with 100 g Pesola and forearm length measured. In addition, the reproductive phase was determined through the observation of secondary sexual characteristics. The abdomens of the females were palpated to detect
pregnancy and lactating females (hardened nipples, hairless around and / or secreting milk) were indentified according to the criteria of Fleming et al. (1972). In the case of males, the presence of obvious exposed scrotums was considered as reproductively active.
Those individuals impossible to identify in the field or that represented a new report for the area, were collected for later catalog and they were preserved in the mammal collection of the Museum of the Universidade do Rio Grande do Norte. The survey and collection of specimens were allowed by the Brazilian environmental agency (SISBIO license number 48325-2 MMA e IBAMA and ICMBIO).
Plant assembly and phenology
In each of the five sampling sites, a 200 meters long and 10 meters wide transects were established. During the first month, the species of trees, shrubs, cacti and bromeliads were identified and individuals of each species were counted for abundance estimation in each transect.
The main characteristics of the flowers that attract bats (chiropterophily) are large inflorescences or single flowers, the flower opening is wide, the stamens are numerous and long, possess lots of nectar and pollen, the corollas are light colored with unpleasant odors (Quiroz et al., 1986; Altringham, et al., 1996; Tschapka and Dressler 2002; Muchhala and Jarrıín 2002).
Phenological data was taken in each of these transects once a month, during five months (June to October). For the phenological data, up to 10 individualsof each species (when possible) in each transect were tagged with fluorescent flagging tape with the number of each individual and the common name noted. Data collected for each individual is: % of new leaves, % leaves droped, number of flower buds, number of open flowers, anthesis, flower color, inmature fruits, ripe fruits and color of ripe fruit.
Botanical samplesofeach of thespecies were collected for proper
Grande do Norte. Pollen samples were collected directly from the flowers available during the sampling period with jelly-glycerin cubes in order to make a pollen collection for reference.
Structure of the mutualistic interaction networks
Pollen samples
For each captured bat, inspection for pollen was done all over its body. Pollen was collected with a sticky jelly cube (3-4 mm) prepared with glycerin, phenol and safranine for preservation and coloring respectively (Voigt et al., 2009). Each cube of glycerine jelly was deposited in a microtube in a cooler to prevent them from melting. For pollen analysis were considered only identification of pollen grains present in microscope slides. The microscope slide were prepared by melting each glycrine jelly cube per bat sample and analysed under a light microscope (Leica DM500).
Pollen types were identified by comparison with a reference collection from the Palynotheca of the LAMIV/UEFS (Plant Micromorphology Laboratory/Feira de Santana State University), which is a representative collection of the pollen flora of the Caatinga vegetation from north-eastern Brazil. Relevant pollen catalogues were used for auxiliary identification, published by Chávez et al. (1991), Roubik and Moreno (1991), Santos et al. (1997), Carreira and Barth (2003), and Melhem et al. (2003). Photos of the pollen grains were taken using an Olympus BX51 microscope with contrast prisms of differential interference (DIC), coupled with a DP25 camera and the program Imaging software cellSens.
Pollen grains were identified to the lowest possible taxonomic level. Pollen was scored on a presence/absence scale for each bat this information obtained for several individuals may provide an estimate of the relative use of that particular plant species within a nectar-feeding bat population. When identifying the pollen types were taken into account situations where small amounts of pollen could have
contaminated the samples meaning that the specific bat species really did not feed on that plant, these pollen grains could have been deposited in the chiropterophillic flowers by other means such as air and/or insects. Criteria were established to discard some accidental pollen types: If the pollen types belonged to plant families that presented anemofilia (Poaceae for example) and if a pollen type only appeared in a single sample of one bat species.
establish whether the diet sampling of nectar-feeding-bats was completed, or otherwise, to know it’s representativeness of the total estimated pollen species (Moreno and Halffter, 2001; Nielsen and Bascompte, 2007).
Network analysis
Data was organized on bat resource use of plants as an adjacency matrix, with plant species listed as rows (lower level) and bat species listed as columns (higher level). Each cell was filled with the percentage of samples of bats that presented pollen of each species of plant (the number of individuals that had the specific pollen divided by the total number of the specific bat species individuals caught, times 100) and thus the matrix was weighted with standardized use of plants by bats.
Metrics were calculated in the “bipartite” (version 2.05) package of R (Dormann et al., 2009). Null models were created using the method “swap.web” (N=1000).
Nestedness values of the observed data and of the null matrices were calculated using the method "weighted NODF" which incorporates the weights of each link.
The function “plotweb” was used to draw a bipartite graph, in which rectangles represent species, and the width is proportional to the sum of interactions involving this species. Interacting species are linked by lines, whose width is again proportional to the number of interactions. The function “visweb” was used to draw a plot of the data matrix with shading representing number of interactions per link; the darker squares are the ones with more links. The number inside the plot refers to the percentage of interactions (as explained above).
Using the “bipartite” (version 2.05) package of R (Dormann et al., 2009), with “networllevel” function the robutness coefficient was calculated following the method by Burgos et al. (2007). “R” value is defined as the area under the extinction curve. This analysis provides two values of R, one for the higher level (bats) and another for the lower level (plants).
Similarities between the nectar-feeding bat species and temporal similarities
rich and under sampled communities (Brehm and Fiedler 2004). Analysis was performed with Analysis was performed with PAST 3.0
To test if the differences in the diet variations: 1) among species of nectar-feeding bats considering the different sampling months and 2) among the months considering the different nectar-feeding bat species an analysis of similarity
(ANOSIM) was performed, which is a non parametric permutation procedure to test for significant differences among differently grouped sampling units (Clarke, 1993). To measure the similarity we used the Bray Curtis dissimilarity index. Significance levels were adjusted by a Bonferroni sequential correction. Analysis were performed with PAST 3.0
To help with the interpretation of the results obtained with the ANOSIM, a Similarity Percentages (SIMPER) analysis was done using the Bray-Curtis method. This analysis breaks down the contribution of each species of plant to the observed dissimilarity between 1) nectar-feeding bat species diets and between 2) sampling months. It allows identifying the species that are most important in creating the observed pattern of dissimilarity. Analysis was performed with PAST 3.0 The general pattern of bat community consumption and general plant availability composition in the time (months) was tested with Mantel test between the Bray Curtis dissimilarity index of bat community consumption and available plant species.
Analysis was performed in PAST 3.0. Availability and use ofresources
First a “pre-selection of plant species” was done to prepare the data properly for further analysis. At the beginning there were 120 records of which 57 were eliminated following three criteria. First criteria: Plants that during the sampling period never had flowers available and were never used by nectar-feeding bats. Second criteria: Even though the plants had available flowers they were not used by any nectar-feeding bat species. Third criteria: Only one individual of one species of bat presented the pollen type in one pollen sample (the specific case of Prosopis juliflora) assuming that it may have been an accidental event. With these three criteria nine species of plants were removed: Calotropis procera, Croton sonderianus,
Jatropha mollissima, Pithecellobium diversifolium, Poincianella pyramidalis,
Prosopis juliflora, Ruellia asperula, Tabebuia aurea and Tacinga inamoena. With the 63 remaining records a fourth criteria was applied: Plants that have never been
during the sampling period. With this fourth criteria, two plant species were removed form the analysis Cynophallahastata and Cereus jamacaru.
Regression analyzes were performed for each one of four nectarivorous bat species in two ways. First with 27 records from seven plant species (Bauhinia cheilantha, Cleome spinosa, Coursetia rostrata, Encholirium spectabile,
Melocactus zehntneri, Pilosocereus pachycladus, Pilosocereus gounellei). These 27 records are all plant species used by one of the four bat species analyzed. Second, for each bat specie, only the plant species used by himself were selected. In this analisys the number of samples was 12, but was different for Lonchophylla sp. (N=14). After the regression we analyzed the residual pattern to identify outliers species (outside of confidence intervals 95%). Before the analysis the number of plants with available flowers by species/months were transformed in LN+1.
RESULTS
Bat assembly
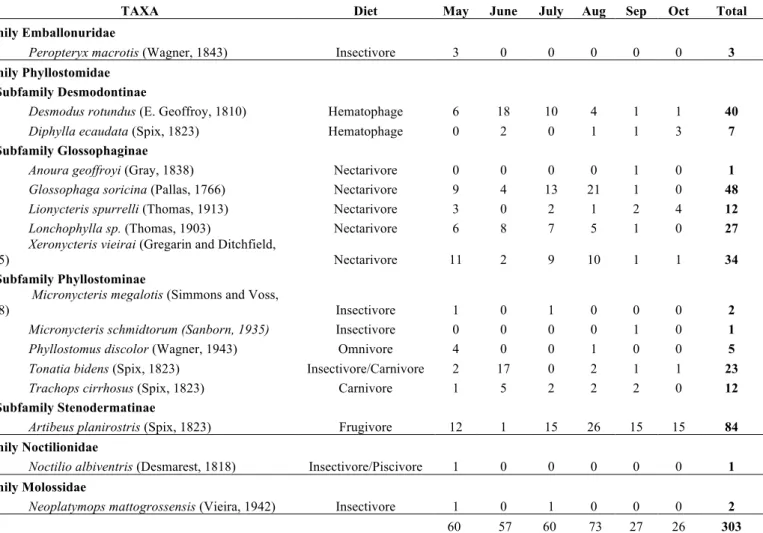
With a sampling effort of 45456.9 m2h, a total of 303 individuals belonging to 16 species, 15 genera, 4 families and 4 subfamilies, representing different types of diets have been captured (Table 1). Of which only Peropteryx macrotis, Desmodus rotundus, Diphylla ecaudata, Trachops cirrhosus, Glossophaga soricina and Artibeus planirostris have been reported for Caatinga in the state of Rio Grande do Norte (Ferreira et al., 2010; Garcia et al., 2014), the other species are new records for the Caatinga of Rio Grande do Norte.
For purposes of this study only 4 species of nectar-feeding bats were
considered, due to the low rate of capture of fruit eating bats. The nectarivorous bat
Table 1. Number of bats captured per month from May to October (Sampling effort of 45456.9 m2h) in Lajes, Rio Grande do Norte. Nomenclature according to Gardner (2007)
Fig. 2 Nectar-feeding bats considered for all the analysis. a)Glossophaga soricina, b)
Lionycteris spurrelli, c) Lonchophylla sp., d) Xeronycteris vieirai. Photos: Juan Carlos Vargas Mena.
TAXA Diet May June July Aug Sep Oct Total
Family Emballonuridae
Peropteryx macrotis (Wagner, 1843) Insectivore 3 0 0 0 0 0 3
Family Phyllostomidae
Subfamily Desmodontinae
Desmodus rotundus (E. Geoffroy, 1810) Hematophage 6 18 10 4 1 1 40 Diphylla ecaudata (Spix, 1823) Hematophage 0 2 0 1 1 3 7
Subfamily Glossophaginae
Anoura geoffroyi (Gray, 1838) Nectarivore 0 0 0 0 1 0 1 Glossophaga soricina (Pallas, 1766) Nectarivore 9 4 13 21 1 0 48 Lionycteris spurrelli (Thomas, 1913) Nectarivore 3 0 2 1 2 4 12 Lonchophylla sp. (Thomas, 1903) Nectarivore 6 8 7 5 1 0 27 Xeronycteris vieirai (Gregarin and Ditchfield,
2005) Nectarivore 11 2 9 10 1 1 34
Subfamily Phyllostominae
Micronycteris megalotis (Simmons and Voss,
1998) Insectivore 1 0 1 0 0 0 2
Micronycteris schmidtorum (Sanborn, 1935) Insectivore 0 0 0 0 1 0 1 Phyllostomus discolor (Wagner, 1943) Omnivore 4 0 0 1 0 0 5 Tonatia bidens (Spix, 1823) Insectivore/Carnivore 2 17 0 2 1 1 23 Trachops cirrhosus (Spix, 1823) Carnivore 1 5 2 2 2 0 12
Subfamily Stenodermatinae
Artibeus planirostris (Spix, 1823) Frugivore 12 1 15 26 15 15 84
Family Noctilionidae
Noctilio albiventris (Desmarest, 1818) Insectivore/Piscivore 1 0 0 0 0 0 1
Family Molossidae
Plant assembly and phenology
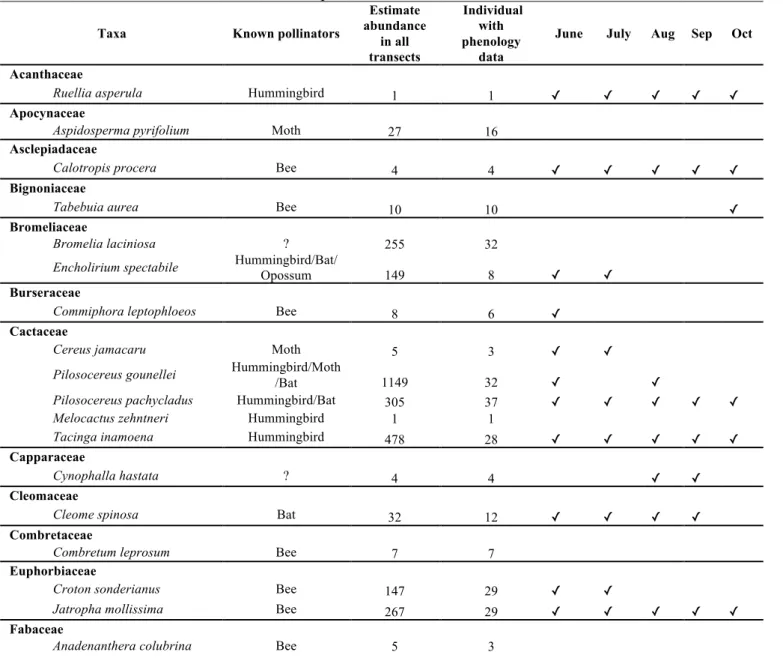
Phenological data from 25 species of plants belonging to 12 families of angiosperms were taken (Table 2). Most species belong to the family Fabaceae (8 species) followed by Cactaceae (5 species). In all transects, cacti were the most abundant plants, showing different growth types such as globose (Melocactus. zehntneri ), flattened-padded (Tacinga. inamoena), shrubby (Pilosocereus gounellei) and columnar (Cereus jamacaru and Pilosocereus pachycladus ). Of the sampled plant species only five have bats as recognized as pollinators (Table 2) and nine species presented chiropterophily features in their flowers (Fig. 3). Most sampled plants had flowers throughout the study period. (Table 2).
Table 2. Plant species sampled in five transects Lajes, RN for a period of May to October with known data on their pollinators. ✓ = Presented flowers.
Taxa Known pollinators
Estimate abundance in all transects Individual with phenology data
June July Aug Sep Oct
Acanthaceae
Ruellia asperula Hummingbird 1 1 ✓ ✓ ✓ ✓ ✓
Apocynaceae
Aspidosperma pyrifolium Moth 27 16
Asclepiadaceae
Calotropis procera Bee 4 4 ✓ ✓ ✓ ✓ ✓
Bignoniaceae
Tabebuia aurea Bee 10 10 ✓
Bromeliaceae
Bromelia laciniosa ? 255 32
Encholirium spectabile Hummingbird/Bat/
Opossum 149 8 ✓ ✓
Burseraceae
Commiphora leptophloeos Bee 8 6 ✓
Cactaceae
Cereus jamacaru Moth 5 3 ✓ ✓
Pilosocereus gounellei Hummingbird/Moth
/Bat 1149 32 ✓ ✓
Pilosocereus pachycladus Hummingbird/Bat 305 37 ✓ ✓ ✓ ✓ ✓
Melocactus zehntneri Hummingbird 1 1
Tacinga inamoena Hummingbird 478 28 ✓ ✓ ✓ ✓ ✓
Capparaceae
Cynophalla hastata ? 4 4 ✓ ✓
Cleomaceae
Cleome spinosa Bat 32 12 ✓ ✓ ✓ ✓
Combretaceae
Combretum leprosum Bee 7 7
Euphorbiaceae
Croton sonderianus Bee 147 29 ✓ ✓
Jatropha mollissima Bee 267 29 ✓ ✓ ✓ ✓ ✓
Fabaceae
Bauhinia cheilantha Hummingbird/Bat 3 1 ✓
Coursetia rostrata ? 51 11 ✓ ✓ ✓ ✓ ✓
Mimosa tenuiflora Bee 119 29 ✓ ✓
Poincianella pyramidalis Bee 315 31 ✓ ✓
Piptadenia stipulacea Bee 10 4
Pithecellobium diversifolium ? 2 2 ✓
Prosopis juliflora Insects 299 26 ✓ ✓ ✓
Fig. 3 Plants with chiropterophily features included in the sampled transects a) E. spectabile, b) C. jamacaru (Photo: E. Duarte), c) P. gounellei, d) P. pachycladus
(Photo: A. Taemi), e) P. diversifolium, f) C. hastata (Photo: R. Soares Neto), g) C. spinosa and h) C. rostrata (Photo: D. Cardoso).
Structure of the mutualistic interaction network
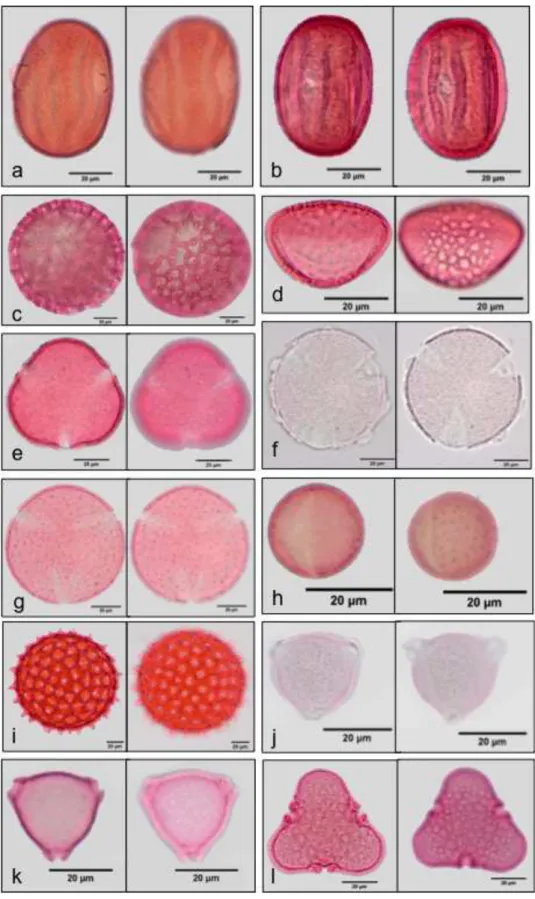
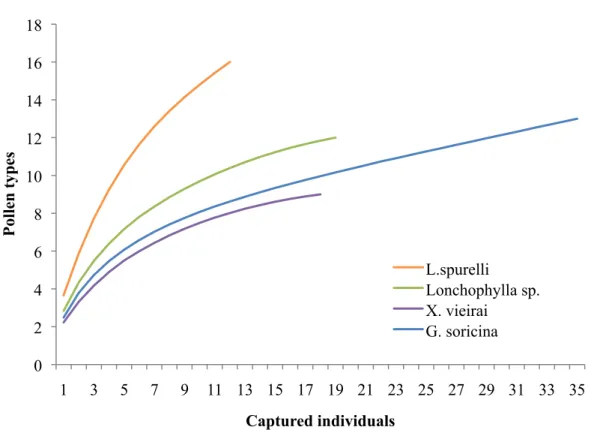
Twenty-one pollen types from seven families of angiosperms were identified (Fig. 4) in 91 samples of pollen taken from the fur of the four species of nectarivorous bats. G. soricina (38 samples) L. spurrelli (12), Lonchophylla sp. (21) and X. vieirai
(20). The accumulation curve of pollen types and bat species (Fig. 6) showed that none bat species reaches asymptote, there still is a growing trend indicating that sampling of pollen types for different species of bats was incomplete, specially for L. spurrelli .
The families Acanthaceae and Cactaceae presented more pollen types in the samples, each represented by three pollen types. P. pachycladus (Cactaceae) type appeared in 91% of the samples being the most abundant in samples of the four nectar-feeding bats, followed by E. spectabile (Bromeliaceae) in 30% of samples and
Fig 5. Fig. 4 Pollen types from seven families of angiosperms that appeared most frequently in the fur of four species of nectarivorous bats in Lajes, Rio Grande do Norte. Acanthaceae a) Thyrsacanthus sp,. b)Acanthaceae type 1 and c)Dicliptera sericea . Bromeliaceae d) Encholirium spectabile. Cactaceae e) Pilosocereus
pachycladus, f) Melocactuszehntneri and g) Pilosocereus gounellei. Cleomaceae h)
Malvaceae k) Helicteres sp. and l) Pseudobombax sp. All photos were taken with 40x lens, scale bar 20 µm.
Fig 6. Accumulation curve of pollen types for each nectarivorous bat species.
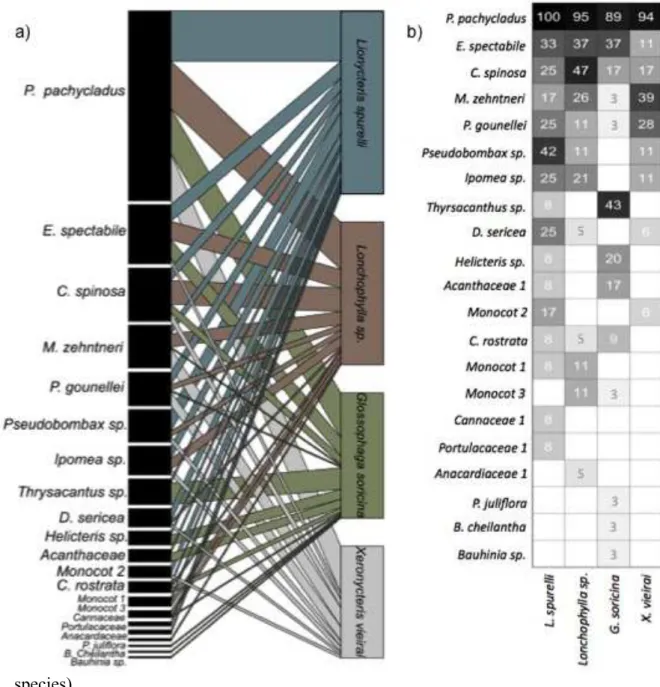
The nestedness analysis of the interaction network between nectarivorous bats and plants in this Caatinga region is highly nested when compared to the null
expectation (NODF= 59,04, Z =4,00, P < 0.001). The results show that the nectar-feeding bats and the plants they feed on, form a highly cohesive network, where all species are attached to the network and non-isolated compartments are presented (Figure 7a). These nested interactions can be visualized as well in a double entry qualitative and quantitative matrix describing the percentage of the interactions between the four species of nectar-feeding bats and the 21 species of plants they use as feeding resources. The different rows and columns are organized from the most generalists to the most specialists (Figure 7b). The species that stands out as core food resource is the columnar cacti P. pachycladus, not only because it is used by the four species of nectarivorous bats, but also because it is used much more frequently than any other plant.
The robustness coefficient for the higher level (bats) was R= 0,944 and R=0,744 for the lower level (plants). Both robustness coefficients are close to the
0 2 4 6 8 10 12 14 16 18
1 3 5 7 9 11 13 15 17 19 21 23 25 27 29 31 33 35
P
ol
le
n
typ
es
Captured individuals
L.spurelli
Lonchophylla sp. X. vieirai
value R=1, which corresponds to a curve that decreases very mildly until the point at which almost all bat species are eliminated. This is consistent with a very robust system in which most of the plant species survive even if a large fraction of bat species is eliminated and vice versa.
The species that interacted with more plant species was L. spurrelli (16 species) on the other hand; the one that had fewer interactions was X. vieirai (9
species).
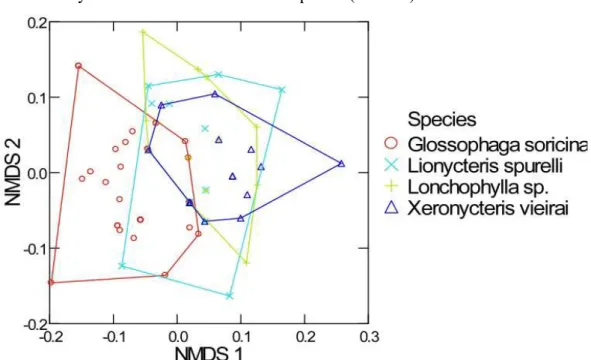
Similarities between the nectar-feeding bat species
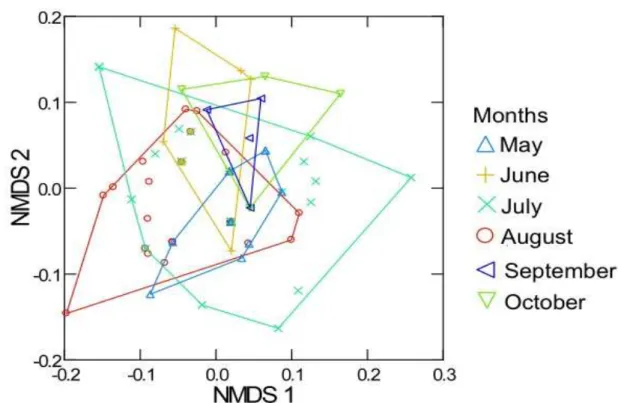
The sizes of the minimum convex polygon in the NMDS indicate how the diet of each nectar-feeding bat species varied in time (Fig. 8). Along the first axis, which accounted for 36% of total variation, it is possible to observe differences between G. soricina and X. vieirai. Along the second axis (32% of total variation) the species that varied it’s diet the less was X. vieirai. The results of NMDS ordination have
significant distortion to represent the original Bray Curtis dissimilarity index in two dimensions (Stress 0.28).
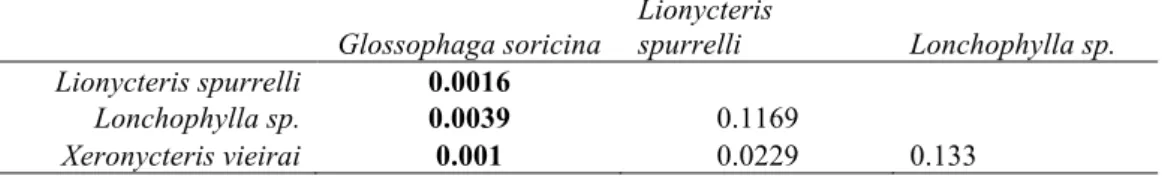
The ANOSIM (Table 3) revealed significant differences between the four species of nectar-feeding bats (R = 0.1568, p = 0.0003). G. soricina is different from the other species. The average dissimilarity between the bat species was 55.87% (Table 4). E. spectable, C. spinosa, M. zehntneri , P. gounellei and Thrysacanthus sp. were the main species to explain the dissimilarities. They contributed over 57.2%
(accumulated) of the to dissimilarities between the diets of the bat species. G. soricina
was the specie that fed the most of C. spinosa and Thyrsacanthus sp. and he fed the less of M. zehntneri and P. gounellei compared with the other species of bats. It is also worth mentioning that P. pachycladus is the species of plant that is most commonly used by all bats and this is why this plant explains only 7.7% of the dissimilarity between the diets of the bat species (Table 4).
Table 3. ANOSIM for significant differences in diet composition among the different nectar-feeding bat species.
Table 4. Plant species consumed by the nectar-feeding bats and its relative
contribution to the Bray-Curtis dissimilarity index; values calculated by the SIMPER method. Values for each species are mean abundances.
Taxon Av.
dissim Contrib. % Cumulative % Glossophaga soricina Lionycteris spurrelli Lonchophylla sp. Xeronycteris vieirai
Encholirium spectable 8.275 14.81 14.81 0.382 0.333 0.368 0.111
Cleome spinosa 7.443 13.32 28.13 0.176 0.25 0.474 0.167
Melocactus zehntneri 6.05 10.83 38.96 0.0294 0.167 0.263 0.389
Thyrsacanthus sp. 5.834 10.44 49.4 0.441 0.0833 0 0
Pilosocereus gounellei 4.356 7.795 57.2 0.0294 0.25 0.105 0.278
Pseudobombax sp. 4.02 7.194 64.39 0 0.417 0.105 0.111
Ipomea sp. 3.345 5.987 70.38 0 0.25 0.211 0.111
Pilosocereus
pachycladus 2.963 5.303 75.68 0.912 1 0.947 0.944
Helicteres sp. 2.615 4.681 80.36 0.206 0.0833 0 0
Acanthaceae 1 2.156 3.858 84.22 0.176 0.0833 0 0
Dicliptera sericea 1.989 3.559 87.78 0 0.25 0.0526 0.0556
Coursetia rostrata 1.457 2.607 90.39 0.0588 0.0833 0.0526 0
Monocot 3 1.333 2.387 92.77 0.0294 0 0.105 0
Monocot 2 1.128 2.019 94.79 0 0.167 0 0.0556
Monocot 1 0.9357 1.675 96.47 0 0.0833 0.105 0
Anacardiaceae 1 0.4107 0.7351 97.2 0 0 0.0526 0
Prosopis juliflora 0.3689 0.6603 97.86 0.0294 0 0 0
Cannaceae 1 0.3477 0.6223 98.48 0 0.0833 0 0
Portulacaceae 1 0.3477 0.6223 99.11 0 0.0833 0 0
Bauhinia sp. 0.266 0.4761 99.58 0.0294 0 0 0
Bauhinia cheilantha 0.2339 0.4186 100 0.0294 0 0 0
Overall average dissimilarity = 55.87
Temporal similarities
Considering the diet of the four nectar-feeding bats in the six sampled months, the NDMS ordination showed differences between their diets in some of the months (Fig. 9). Apparently all nectar-feeding bats species are eating what it is available
R values
Glossophaga soricina
Lionycteris
spurrelli Lonchophylla sp.
Lionycteris spurrelli 0.2543
Lonchophylla sp. 0.1521 0.07236
Xeronycteris vieirai 0.1998 0.1388 0.04025
Values in bold p<0.05
Prob, sequential Bonferroni significance
Glossophaga soricina
Lionycteris
spurrelli Lonchophylla sp.
Lionycteris spurrelli 0.0016
Lonchophylla sp. 0.0039 0.1169
monthly, presenting overlapping in their diets. July and August are the months where the nectarivorous bats varied their diet the most in both Axis (Axis1 36.6%, Axis2 34.8%).
The ANOSIM (Table 5) revealed significant differences between months (R=0.1055 p=0.0053). Bonferroni sequential significance showed differences between August and October, May and October and between June and May. The plant species used by nectar-feeding bats were similar in June, August and September.
The similarity of percentages (SIMPER) presented an average dissimilarity between months of 55.3% (Table 6). The plants that explained most of the dissimilarity percentages between the months of August and October were C. spinosa and
Thrysacanthus sp., because they were not consumed at all in October. Between May and October the main plant species explaining the dissimilarity was E. spectable
which was not consumed at all in May. Finally between June and May, Thrysacanthus sp. was not consumed in June and C. spinosa was consumed twice the amount in June than in May. Once again it is demonstrated that P. pachycladus is essential for the nectarivorous bat community, been consumed monthly. The general pattern of bat community consumption is highly correlated to general plant availability composition (rMantel= 0.66; p= 0.017).
Table 5. ANOSIM for significant differences in diet composition among the different nectar-feeding bat species for six months (May-October).
Table 6. Plant species consumed by the nectar-feeding bats and its relative contribution to the Bray-Curtis dissimilarity index in six months (May-October); values calculated by the SIMPER method. Values in months are mean abundances.
R values
October September August July June September 0.151
August 0.4708 0.2447
July 0.1811 0.09996 0.07497
June 0.3936 0.1799 0.1731 0.03689
May 0.6598 0.3507 0.02755 -0.05589 0.2717
Values in bold p <0.05
Prob, sequential Bonferroni significance
October September August July June September 0.2344
August 0.0006 0.0263
July 0.1273 0.2489 0.0117
June 0.006 0.1282 0.0188 0.2988
Mayo 0.0003 0.0199 0.2741 0.7763 0.0017
Taxon Av.
dissim
Contrib. %
Cumulative
% October September August July June May
Encholirium spectable 8.497 15.36 15.36 0.5 0.25 0.32 0.296 0.7 0
Cleome spinosa 7.681 13.89 29.25 0 0.75 0.24 0.0741 0.6 0.308
Thyrsacanthus sp. 6.141 11.1 40.35 0 0 0.48 0.0741 0 0.154
Melocactus zehntneri 5.351 9.674 50.03 0.5 0 0.08 0.222 0.2 0.231
Pseudobombax sp. 3.957 7.155 57.18 0.75 0.75 0.04 0.0741 0 0
Pilosocereus gounellei 3.732 6.748 63.93 0 0 0.16 0.148 0.1 0.154
Ipomea sp. 3.05 5.514 69.44 0.5 0.25 0.04 0.111 0.2 0
Pilosocereus pachycladus 2.972 5.373 74.82 1 1 0.96 0.889 0.9 1
Helicteres sp. 2.619 4.736 79.55 0 0 0.16 0.148 0 0
Acanthaceae 1 2.359 4.265 83.82 0 0 0.24 0 0 0.0769
Dicliptera sericea 2.137 3.864 87.68 0.75 0.25 0 0 0.1 0
Coursetia rostrata 1.743 3.151 90.83 0 0 0 0.037 0.3 0
Monocot 3 1.298 2.348 93.18 0 0 0 0.0741 0 0.0769
Monocot 2 0.9142 1.653 94.83 0 0 0.04 0.037 0 0.0769
Monocot 1 0.8611 1.557 96.39 0 0 0 0.037 0.2 0
Prosopis juliflora 0.3874 0.7005 97.09 0 0 0 0.037 0 0
Cannaceae 1 0.36 0.6508 97.74 0.25 0 0 0 0 0
Portulacaceae 1 0.36 0.6508 98.39 0.25 0 0 0 0 0
Anacardiaceae 1 0.3255 0.5886 98.98 0 0 0 0.037 0 0
Bauhinia sp. 0.3007 0.5436 99.52 0 0 0.04 0 0 0
Bauhinia cheilantha 0.2639 0.4771 100 0 0 0.04 0 0 0
Availability and use of resources
The linear regressions for each nectar-feeding bat species considering the available resources and the used resources (Table 7) was done first with the pre selected plants available (See Methodology) and second only with the plants bats used. The regression with the pre-selected plants was not significant for L. spurrelli, even without the outlier (P. gounellei). When performing regressions only for plants that were used by the nectar-feeding bats, the regressions were significant for G. soricina, L. spurrelli and X. vieirai; for Lonchophylla sp. the regression was significant only after removing the outlier value.
Table 7. Linear regressions of the used available resources by nectar-feeding bats. N = plant species used for analysis in different months.
After plotting the standardized residuals from the regressions for the values in bold in Table 7 we can see positive and negative residuals based on the expected utilization of each plant species by bats. In a Fig. 10 we can observe that G. soricina
used more than expected the plants C. spinosa and P. pachycladus, the other species that was used within the expected intervals was E. spectabile. On the other hand C. rostrata was used less than expected by chance by G. soricina. Lonchophylla sp.
presented a very similar pattern to that of G. soricina where the main plants in its diet were C. spinosa and P. pachycladus. X. vieirai had two species that were very
representative in its diet, P. pachycladus, and E. spectabile. C. spinosa during a specific time of the sampling period was used more than expected by chance, but in another time that species was used much less than expected. Another species that is
Pre-selected plant species All used plants by bats Species
R2 Std. coeff N p-value R2 Std. coeff N p-value
Glossophaga soricina 0.108 0.328 27 0.095 0.341 0.584 12 0.046
Glossophaga soricina (no outlier) 0.169 0.411 26 0.037
Lionycteris spurrelli 0.004 -0.065 27 0.746 0.343 0.585 12 0.046
Lionycteris spurrelli (no outlier) 0 -0.002 26 0.991
Lonchophylla sp. 0.14 0.375 27 0.054 0.202 0.449 14 0.107
Lonchophylla sp.(no outlier) 0.195 0.441 26 0.024 0.514 0.717 13 0.006
Xeronycteris vieirai 0.126 0.355 27 0.069 0.465 0.682 12 0.015
worth highlighting for X. vieirai is M. zehntneri which was not expected to be widely used by the species, yet we can see that at one time of the sampling period this species was used much more than expected by chance. Finally for L. spurrelli the species used more than expected were P. pachycladus and E. spectabile, and C. rostrata was used less than expected by chance.
Fig 10. Standardized residuals from the regressions based on the expected utilization of each plant species by bats. The dotted line indicates the 95% confidence intervals. Pp= Pilosocereus pachycladus, Pg= Pilosocereus gounellei, Mz=Melocactus
zehntneri, Es= Encholirium spectabile, Cs= Cleome spinosa, Cr=Coursetia rostrata
DISCUSSION
Structure of the mutualistic interaction network
The analysis of interactions between the four species of nectar bats and the twenty-one species of plants proved to be significantly nested when compared to the null model, the interactions between nectar bats and plants in this Caatinga area are not random. A cohesive network and asymmetry is observed. There is a core of more generalist species of bats (L. spurrelli and Lonchophylla sp.) that feed on generalist plants (P. pachycladus, E. spectabile and C. spinosa), forming a dense nucleus where more specialist species adheres (Fig. 7).
In a nested network, specialization is asymmetric. Specialist species of one of the assemblies (bats in this case) tend to interact only with other generalist species from the other assembly (plants). This phenomenon provides greater opportunity of specialist species to persist, because the generalists species from which they depend often are more abundant and less fluctuating, since they have many different
resources (Bascompte and Jordano 2008).
Another way to understand this type of network is viewing it as a robust core of bat species and plants in a resilient system that when some of their interactions are lost due to extinction of some of its species, alternative routes are found to keep the system working. The network here exposed high robustness values at both plants level (R = 0.744) and at bats level (R = 0.944). If the extinction of species was given
randomly in a robust network the system would remain stable, even if a large fraction of species were eliminated; since, randomly, the more likely species to be removed are the specialists and the less likely to be eliminated are the generalists species.
characterization of the network for nectar-feeding bat species, mainly for L. spurrelli. Nevertheless, from a biological perspective there is valuable data to be discussed here.
Bat assembly
The local nectar-feeding bat assembly at our study site consisted of five species (Table 1). G. soricina was the most abundant in our study, as expected, due to its wide distribution and general abundance in different environments (Reid, 2009). The next most abundant species was X. vieirai, followed by Lonchophylla sp. and finally L. spurrelli. Something observed for all species, except for L. spurrelli, is that the number of captures decreased in the last two sampling months despite having kept the sampling effort equal throughout field data collection. This variation in abundance of nectar-feeding bats has been shown to be common in environments that are
subjects to variation in precipitation during annual cycles because of the fact that flowering is tightly synchronized with the seasonal water availability (Sperr et al.,
2011). To be able to confirm if the observed trend in the abundances of nectar-feeding bats species is a real patter where G. soricina, Lonchophylla sp. and X. vieirai
decrease in abundance when the peak of the dry season begins (October to November) and instead L. spurrelli and A. geoffroyi increase their abundance, it would be
necessary to sample for at least one full year to be able to depict a complete cycle. It has been documented that in some regions the community of nectar-feeding bats are divided into resident species (present all year) and non-residents (presents only part of the year) (Tschapka, 2004), this could be happening in this region.
Plant assembly and phenology
Based on phenological data obtained in this study it would be impetuous to characterize a pattern of resource availability determined by water availability. However, a decrease in the availability of flowering species can be seen during the last two months. In the same way as discussed for sampling bats, phenological data should be taken for at least one year.
(Ribeiro et al., 2015). The utilization of feeding resources in the study area will be discussed later.
Similarities between the nectar-feeding bat species
As to the difference in diet between the four species of nectar-feeding bats based on the analyzes of NMDS and ANOSIM, it was detected that G. soricina is the species with significantly different diet. Compared with the other three species, it is the best studied regarding its diet (Bredt et al., 2012). Among nectar-feeding bats, this species is cataloged as typical generalists showing great feeding plasticity, using not only nectar and pollen but also fruits and insects to supplement their diet in situations of resource scarcity (Alvares et al., 1991; Reid, 2009; Gonzalez et al., 2012). By using other feeding resources in our study area we could explain the fact that this species did not present the highest number of interactions with flowering plants (Fig. 7). During the study period feces samples were collected to identified if the species were using other feeding resources in addition to nectar (see Supplementary material 1), only G. soricina and Lonchophylla sp. presented insects remains. Previous studies in another Caatinga area, demonstrated that, morphologically, these two species are very similar and their strategy to reduce competition was by G. soricina feeding almost exclusively on fruit (Willig, 1986). In this study no differences were observed in the content of their feces samples, but there were differences between some of the plant species they used. For example, G. soricina was the only species who used
Thrysacanthus sp. and that used less frequently C. spinosa, M. zehntneri, P. gounellei
and that did not used at all Pseudobombax sp. and Ipomea sp. which were important for Lonchophylla sp. Now, the low frequency use of P. gounellei by G. soricina is an interesting situation to discuss based on the morphological differences between bat species. There was a differentiated use of this resource in our study, the species that most commonly used this plant was X. vieirai and the species that used it the least was
G. soricina. The most obvious morphological character in nectar-feeding bats is the elongated rostrum, which varies from moderate elongation in the generalist
Glossophaga species to extreme elongation in specialists (Tschapka et al., 2008). Despite the fact that no morphological measurements were taken systematically in this study, the rostrums of few individuals of both species were measured. X. vieirai
flowers of P. gounellei have been characterized by the production of less pronounced odor, lower nectar production and a narrower and more elongated floral tube in comparison to other species of Pilosocereus (Roncha et al., 2007). Possibly because of the size of its snout, X. vieirai was the species that most frequently used this floral resource.
M. zehntneri is a small globose cactus that is found almost at ground level; so far the only pollinator species recognized are hummingbirds (Machado and Lopes, 2004, Rocha et al., 2007). Although hummingbirds seem to be the most important pollinators of Melocactus, other taxa including small bees and butterflies have been proposed as alternative pollen vectors (Nassar and Ramirez, 2004). Its ornithophilous characteristics and small globular size and hence its low height is what took us by surprise when finding this pollen type in 39% of samples of X. vieirai followed by 26 % in the samples of Lonchophylla sp. due to the fact that another limitation
represented by the morphology in bats is their ability to fly at different heights, their agility and maneuverability (Norberg, 1987). These species are probably likely to have greater agility and maneuverability to fly at such low altitudes (about 20-30 cm from the ground) than G. soricina.
Temporal similarities
The general pattern of bat community consumption is highly correlated to the general plant availability. This suggests synchronic variation between consumption and resource availability in the analyzed months.
Precipitation rates varied very little throughout the sampling period, so this data was not included in the analyzes (Supplementary material 2). But observing the precipitation data in a finer scale (rain per day) may help understand changes in diet that took place during the months of July and August. The capture rate of nectar-feeding bats during these two months was the highest (Table 1). In July it rained before, during and after the sampling nights. There are plant species in semiarid regions that respond quickly to sporadic rainfalls, making resources available in some cases (Schwinning and Sala, 2004). We assumed that the rain that fell sporadically during the month of July had an effect on the availability of floral resources in some plant species during July and August. Based on this assumption, the bigger size of the minimum convex polygon in Fig. 8 observed for July and August reflects a higher availability of different resources in comparison to the other months.
Based on the expected utilization of each plant species by bats, four species of plants stood out. Pilosocereus pachycladus is a columnar cactus with documented vulnerability due to small populations in some areas of Caatinga and widespread in other areas (Ribeiro et al., 2015). In our study site it was the second most abundant species (Table 2). It is a species that produces 1288-1997µm nectar (accumulated volume in 14 hours) with a sugar concentration of 11-17% (Rocha et al., 2007). This value is within the range reported for bats, which is of around 17%; in comparison to other pollination systems this is considered a dilute nectar as a strategy that obligates bats to consume more nectar per night, thus the plant ensures that the individual will visit more flowers (Tschapka and Dressler, 2002). Its flowering and fruiting period is asynchronous intraspecifically, which may represent a consequence of the
competition for dispersers and/or pollinators in the same area (Rocha et al., 2007). The high specialization to bat pollination observed in most of the tropical columnar cacti in Mexico and Venezuela (Valiente-Banuet et al, 1996; Nasar et al., 1997) might be a response of long and stable coexistence in arid and semi arid environments (Rojas-Martínez et al., 1999). Under these characteristics and by data generated in this study we can safely point out that the columnar cacti P. pachycladus is a keystone species for the support of the community of nectar-feeding bats in this region of Caatinga. Other studies have also demonstrated the importance of this species for the maintenance of local wildlife such as birds, bees, moths, ants and beetles (Rocha et al., 2007).
The second species with the highest importance to the community of nectar-feeding bats was the bromeliad E. spectabile as it was the second species with the highest frequency of use. Recently it was reported that this species has a system of mixed pollination by hummingbirds, bats and a marsupial (Queiroz et al., 2016). The flowers of this species were used as food resource primarily by G. soricina,