Seed dispersal is a vital component of ecosystem func-tioning in tropical forests, where most plants depend on ani-mals for the successful completion of their reproductive cycle (FLEMING & KRESS 2011). Although considerable knowledge has been accumulated on seed dispersal at the organism and popu-lation levels, relatively few studies have focused on the commu-nity level (MELLOet al. 2011a) – a pattern of research repeated for mutualisms in general (BRONSTEIN 1994). More recently, network theory has helped to fill this gap (BASCOMPTE & JORDANO 2007).
A network approach can be used to identify common properties of different kinds of mutualisms at the community level, such as nestedness (i.e., species with fewer interactions are connected to a subset of the mutualistic partners of species with more interactions, BASCOMPTE et al. 2003) and power law degree distribution (i.e., only a few species have a large num-ber of interactions, JORDANOet al. 2003), and to identify under-lying mechanisms (KRISHNA et al. 2008). Despite the assumed
universality of nestedness, it has been recently discovered that seed dispersal networks may also be highly modular (i.e., these networks are composed of subsets of densely connected spe-cies, usually phylogenetically close to each other, MELLO et al. 2011a), and that modularity and nestedness are not mutually exclusive (FORTUNAet al. 2010).
In seed-dispersal networks, the balance between modu-larity and nestedness may largely depend on the diversity of frugivores available in the local community (MELLO et al. 2011a), as different frugivore groups focus on different plants (VAN DER PIJL 1972), but also on connectance (i.e., the proportion of re-alized interactions in the network, FORTUNAet al. 2010). Fur-thermore, different frugivore species contribute differently to the structure of the whole network, varying from peripherals with few interactions, to hubs with several interactions, and to connectors that bind different guilds (MELLOet al. 2011b). Unfortunately, most of the accumulated knowledge on seed
Partitioning of seed dispersal services between birds and bats in a
fragment of the Brazilian Atlantic Forest
Raissa Sarmento
1,4, Cecília P. Alves-Costa
2, Adriana Ayub
2& Marco A.R. Mello
31 Laboratório de Bioecologia e Conservação de Aves Neotropicais, Setor de Biodiversidade e Ecologia, Universidade Federal de Alagoas. Avenida Lourival Melo Mota, Tabuleiro do Martins, 57072-900 Maceió, AL, Brazil.
2 Laboratório de Ecologia e Restauração da Biodiversidade (LERBIO), Departamento de Botânica, Universidade Federal de
Pernambuco. Avenida Prof. Moraes Rego 1235, Cidade Universitária, 50670-901 Recife, PE, Brazil.
3 Departamento de Biologia Geral, Instituto de Ciências Biológicas, Universidade Federal de Minas Gerais. Avenida Antônio
Carlos 6627, Pampulha, Caixa Postal 486, 31270-910 Belo Horizonte, MG, Brazil. 4 Corresponding author. E-mail: [email protected]
ABSTRACT. Community-level network studies suggest that seed dispersal networks may share some universal properties with other complex systems. However, most of the datasets used so far in those studies have been strongly biased towards temperate birds, including not only dispersers, but also seed predators. Recent evidence from multi-taxon networks suggests that seed dispersal networks are not all alike and may be more complex than previously thought. Here, we used network theory to evaluate seed dispersal in a strongly impacted Atlantic Forest fragment in northeastern Brazil, where bats and birds are the only extant dispersers. We hypothesized that the seed dispersal network should be more modular then nested, and that the dispersers should segregate their services according to dispersal syndromes. Furthermore, we predicted that bat and bird species that are more specialized in frugivory would be more important for maintaining the network structure. The mixed network contained 56 plant species, 12 bat species, and eight bird species, and its structure was more modular (M = 0.58) then nested (NODF = 0.21) compared with another multi-taxon network and 21 single-taxon networks (with either bats or birds). All dispersed fruits had seeds smaller than 9 mm. Bats dispersed mainly green fruits, whereas birds dispersed fruits of various colors. The network contained eight modules: five with birds only, two with bats only, and one mixed. Most dispersers were peripheral, and only specialized frugivores acted as hubs or connectors. Our results strongly support recent studies, suggesting that seed dispersal networks are complex mosaics, where different taxa form separate modules with different properties, which in turn play complemen-tary roles in the maintenance of the associated ecosystem functions and services.
dispersal networks came from studies based on datasets that contained only birds, mainly temperate or subtemperate spe-cies, and they included even several seed predators, which causes a strong bias in the biological interpretation and weak-ens the inferences (MELLO et al. 2011a). Due to differences in dietary preferences (MUSCARELLA & FLEMING 2007), frugivorous bats and birds, the main seed dispersers in the Neotropics (GALINDO-GONZÁLESet al. 2000), may form separated modules with different structure within multi-taxon seed dispersal net-works (MELLO et al. 2011a). In our study site, a fragment of the northeastern Brazilian Atlantic Forest (see below), the impor-tance of the remaining bats and birds is even greater, as other large frugivores (including some large-bodied birds) have be-come locally extinct or are so rare that they no longer make an significant ecological contribution to the dispersal system (PON-TES et al. 2006, RODA 2006). Many of these locally extinct frugivores, such as medium- and large-bodied mammals, birds and reptiles, are generalists that dispersed the fruit of several species (TERBORGH et al. 2002, ALVES-COSTA & ETEROVICK 2007).
In the absence of other dispersers, it is important to un-derstand how the remaining fauna maintains the seed dispersal function. Thus, in our study we used network theory to evalu-ate how bats and birds share the local seed dispersal service. Our main hypothesis was that bats and birds should form separate guilds in the community, reflected as modules within the seed dispersal network, as they have different diets (MUSCARELLA & FLEMING 2007) and other frugivores which might have had over-lapping niches with bats and birds are locally extinct. Based on the theory of seed dispersal syndromes (VAN DER PIJL 1972) and on more recent studies (e.g., KORINE & KALKO 2005), we expected that bats would disperse mainly seeds of green fruits, while birds would disperse mainly seeds of other colors, and also that bats would disperse smaller seeds on average. Finally, we would ex-pect bat and bird species that are more specialized for frugivory to be more important to the whole network structure (as in MELLO et al. 2011b), i.e., to be hubs or connectors, as they depend on fruits and thus probably participate more actively in frugivory interactions than occasional frugivores, regardless of abundance.
MATERIAL AND METHODS
Study area
The Atlantic Forest of the northern reach of São Fran-cisco River, northeastern Brazil, is one of the most threatened ecosystems in the world, with less than five percent of its origi-nal forest cover remaining (TABARELLI & RODA 2005). In this re-gion, known as the Pernambuco Center of Endemism (PCE), about one third of all tree species may be endangered due to the loss of their seed dispersers (SILVA & TABARELLI 2000). Our study was carried out in the Coimbra Forest, on land owned by Usina Serra Grande (a sugar mill). The site is located in Ibateguara, state of Alagoas (8°58’S, 36°3’W), at medium alti-tude of 500-600 m. The area covers 24,000 ha, and its
land-scape comprises fragments of Atlantic Forest (a total of 8,000 ha), embedded in a matrix of sugar-cane plantations. Coimbra Forest has an area of 3,500 ha and is the largest primary forest fragment in PCE (GRILLO et al. 2006). A detailed description of its vegetation is given by OLIVEIRA (2005).
Field data
Mist nets (12 x 2 m, 36 mm mesh) were set up to capture birds and bats in the forest understory (0-2 m above ground). Mist nets were distributed along trails inside the fragment and its edges, at three sampling stations, and were kept open for at least one day in each station every month. Stations were lo-cated at least 2 km from each other. As bats and birds were captured at the same sites and dates, differences between the diets of both taxa are unlikely to be related to spatial and tem-poral differences in fruit availability.
Bird captures were made from July 2007 to December 2008. Nets remained open from 05:30 a.m. to 05:00 p.m., totaling a capture effort of 4.4 x 10⁴ h.m2 (the area of one mist net
multi-plied by the total number of nets and the total number of hours worked, sensu STRAUBE & BIANCONI 2002). Birds were kept inside cloth bags in order to obtain fecal samples, which were stored in individual plastic vials. Birds were identified using a field guide (SIGRIST 2006), with identities confirmed by Sônia Roda (CEPAN). Birds were photographed and then released at their capture sites. Bats were captured from August 2007 to July 2008. Nets remained open from 6:00 a.m. to 0:00 a.m., totaling an effort to capture of 1.8 x 10⁴ h.m2. Bats were also kept inside cloth bags
to defecate, and feces were stored in plastic vials. The bats were released after being examined. A combination of keys was used to identify bats (VIZOTTO & TADDEI 1973, EMMONS & FEER 1997, GARDNER 2008) and taxonomy followed GARDNER (2008). The bats that could not be identified in the field were deposited in the Mammal Collection of Universidade Federal de Pernambuco in order to confirm identification (Table I). For the network analy-sis, we considered only data from August 2007 to July 2008, in order to ensure that bird and bat data were comparable.
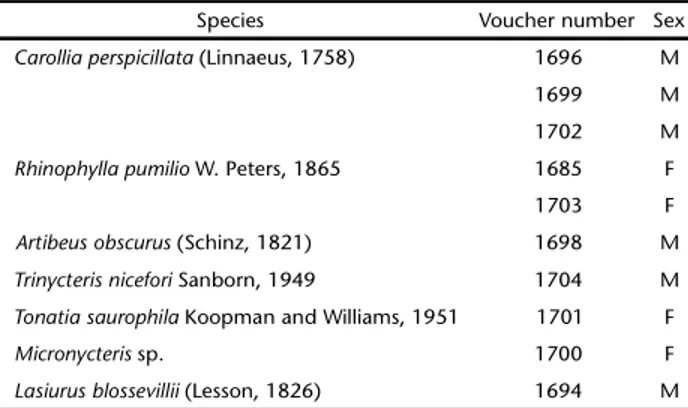
Table I. Bat species and voucher number of individuals deposited in the Mammal Collection of the Universidade Federal de Pernambuco.
Species Voucher number Sex
Carolliaperspicillata (Linnaeus, 1758) 1696 M 1699 M 1702 M
Rhinophyllapumilio W. Peters, 1865 1685 F 1703 F
Artibeusobscurus (Schinz, 1821) 1698 M
Trinycterisnicefori Sanborn, 1949 1704 M
Tonatiasaurophila Koopman and Williams, 1951 1701 F
Micronycteris sp. 1700 F
Guild structure of the network
In order to describe the structure of the seed dispersal network, we built a binary (presence/absence) adjacency matrix with animals (bats and birds) as i rows and plants as j columns. Cells were filled with value 1 when seeds of a j plant were found in the feces of an i animal, and with value 0 when there was no record of interactions. We focused on binary metrics of network structure, as this approach is very useful to search for general patterns (JORDANOet al. 2003) and the literature is richer for this approach, providing a better benchmark for comparison. As the sampling period was longer for birds than for bats, we discarded bird data from August 2008 and built the total matrix only with simultaneously collected bat and bird data. We also analyzed the bat-fruit and bird-fruit sub-networks separately, in order to evaluate the combined topology of the whole network.
To analyze the overlap between seed-dispersal services by bats and birds we used a simulated annealing analysis (GUIMERÀ & AMARAL 2005), based on the concept of modularity. Here, a module is defined as a subgroup of species that are more densely connected to each other than to other species in the same network. The degree of modularity in the network was measured with the index M, in the Netcarto software (GUIMERÀ & AMARAL 2005), which varies from 0 (no subgroups) to 1 (totally separated subgroups). As the Monte Carlo analy-sis in Netcarto was designed for unipartite networks, we used a custom-made Monte Carlo procedure (first used by MELLO et al. 2011a): 1) we generated 1,000 randomized networks from the original network, using the null model 2 with marginal totals fixed (as in BASCOMPTEet al. 2003) and a MatLab script written by Paulo R. Guimarães Jr; 2) we measured M for each of these networks with a version of Netcarto that was modified by Flavia M. D. Marquitti, which allows analyzing multiple networks at a time and annotating M-values in a text file; 3) we carried out a Z-test to estimate the significance of M. This analysis allowed an estimate of the number of modules in the network and the distribution of bats, birds, and plants into different modules.
We estimated the degree of nestedness in the studied net-work with the index NODF (ALMEIDA-NETOet al. 2008), which varies from 0 (no nestedness) to 1 (perfect nestedness); values were normalized. The significance of NODF was estimated with a Monte Carlo procedure (1,000 randomizations) in the soft-ware Aninhado 3.0 (GUIMARÃES & GUIMARÃES 2006), using the null model Ce, in which marginal totals are fixed (null model 2 of BASCOMPTEet al. 2003). The index NODF measures nestedness better than the widely used index N (derived from T, ATMAR & PATTERSON 1993) because it considers the pairwise nesting of rows and columns, and more closely reflects the original con-cept of nestedness (ULRICH et al. 2009).
We used Z tests to test whether the values of NODF and M observed in the overall network differed from the values measured for other 21 networks (compiled by MELLO et al. 2011a)
that contained either birds (N = 10) or bats (N = 11), and from another mixed network with both disperser groups from a pro-tected rainforest in Peru (the GORCHOVet al. 1995 dataset ana-lyzed by MELLO et al. 2011b) (Appendix S1*).
Seed size and fruit color
Fecal samples from bats and birds were taken to the labora-tory, washed in water, passed through a 1-mm sieve, sun-dried, measured, photographed, enumerated, and separated into morphospecies (according to color, size and texture). We also re-corded whether seeds were damaged or intact. Seeds were identi-fied to the lowest possible taxonomic level and deposited in the LERBIO seed bank. Fruit color and seed size of the plants dis-persed were determined, to test for differences among the species subsets dispersed by each group. We determined fruit color by direct observation of plants in the field, by checking herbarium specimens, and by searching in the literature. The diameter of each seed was measured in the program Image Tool 3.0.
Relative importance of bat and bird species
A species that either makes a disproportionally large number of interactions (hub) or binds together different mod-ules of the network (connector) was considered as relatively more important to the entire seed dispersal network. Thus, the relative importance of each frugivore and plant species for the overall network structure was measured with three surrogate metrics: degree centrality (kr), betweenness centrality (BC), and network functional role (FR). Degree centrality is calculated as the number of interactions made by a species (NOOY et al. 2005), and can be expressed as a proportion in relation to the total number of interactions that each vertex could make in its net-work; this metric is used as a surrogate for the ecological con-cept of niche breadth (as the ‘normalized degree’ used in MELLO et al. 2011b). Betweenness centrality is calculated as the pro-portion of small paths (the shortest path between two species, measured in number of interactions) in the network, which the species of interest crosses (NOOYet al. 2005). It is a measure of the role of a species in binding together different guilds within the mutualistic community (DUPONT & OLESEN 2009).The concept of network functional role comes from the (previously described) modularity analysis (GUIMERÀ & AMARAL 2005). Based on the within module degree (z – how many in-teractions a species makes within its module) and the partici-pation coefficient (P – the percentage of interactions made by a species that link it to species outside its module) measured for each species in the modularity analysis, a functional role from R1 to R7 was attributed to the species. The most impor-tant roles are considered connectors (R3, i.e., species that bind different modules) or a mixture of hubs (i.e., species with a disproportionally high number of interactions) and connec-tors (R6 and R7). For details on the analysis of functional roles applied to mutualistic networks, see MELLOet al. (2013).
In order to test the hypothesis that more specialized frugivores establish interactions with a larger proportion of the plants available in the network (and have higher impor-tance for the whole network structure), we classified each bat and bird species according to its dietary specialization. Here, specialization is related to ‘level of frugivory’, i.e., how depen-dent a species is on fruits. When a frugivore feeds exclusively or mostly on fruits, it was classified as ‘specialized’; when fruits are an important part of the diet, but the species does not de-pend exclusively on them, it was classified as ‘secondary’; and when the species feeds on fruits only occasionally, it was clas-sified as ‘opportunistic’.
A general linear mixed-effects multivariate model (GLMM) was used to test whether the variation in centrality (kr, BC, and FR – dependent variables) was affected by level of frugivory (spe-cialized, secondary or opportunistic) and disperser group (bats or birds) (fixed factors); as the values of centrality could be also biased by sampling effort, we considered the number of cap-tures (a measure of relative abundance) and the number of fecal samples analyzed of each disperser species as cofactors in our model. Each of our variables followed a different statistical dis-tribution, so we estimated significance by bootstrapping (1,000 randomizations). As there are differences among specialized frugivores in the number and diversity of fruit species consumed (e.g., among Carollia bats, THIES & KALKO 2004), we expected spe-cialized frugivores to play a wider variety of functional roles, and secondary and occasional frugivores to be more peripheral. Thus, we tested also for differences in the variance of kr, BC, and
FR among species with different levels of frugivory with Levene tests. We also searched for extreme values and outliers in our data, in order to identify the most important species according to each of the centrality metrics analyzed. Percentage data were arcsine transformed prior to the analysis. Finally, we tested for differences between the seed sizes ingested by birds and bats using a Mann-Whitney U test, as the data were not normally distributed. All analyses were run in SPSS 20 for Mac and fol-lowed ZAR (1996) and MANLY (2007).
RESULTS
Species and interaction records
We captured 284 birds of 43 species and 14 families, from which we obtained 177 fecal samples (Appendix S2*). Only 10
bird species dispersed seeds; 45.7 percent of their feces (N = 81) contained seeds of 39 plant species. We considered only eight of these bird species in the network analysis, as we discarded data collected after August 2008. The three most abundant bird species belonged to Pipridae: Ceratopipra rubrocapilla (Temminck, 1821) (19% of all individuals), Chiroxiphia pareola (Linnaeus, 1766) (18.3%) and Manacus manacus (Linnaeus, 1766)(7.7%). These species were also the main seed dispersers,
contributing with 54.8 percent of the fecal samples, of which 82.8 percent contained seeds. Capture success was higher for bats (bat = 535 x 104 ind/h.m² and bird = 64 x 104 ind/h.m²), as
we recorded 964 individuals from 27 species and two families, from which we obtained 629 fecal samples (Appendix S2*).
Twelve bat species dispersed seeds, and 57.1 percent (N = 359) of their fecal samples contained the seeds of 33 species. Carollia perspicillata (Linnaeus, 1758) (Phyllostomidae) was the most abundant bat (73.2% of all individuals), and was responsible for 80 percent of all fecal samples and 85.2 percent of all samples with seeds. Almost half of the captured bat species but only one quarter of the bird species dispersed seeds. Bats dispersed almost five times more seeds than the birds and also more seeds per individual (birds: 5,415 seeds, 66.8 seeds/individual; bats: 26,670 seeds, 75.1 seeds/individual). Although the number of bird fecal samples was five times lower than the number for bats, on average each bird species dispersed more plant spe-cies: the plant/animal ratio was 3.9 for birds and 2.7 for bats. However, on average, birds (kr = 9 ± 7%) and bats (kr = 9 ± 14%) interacted with a similar proportion of the fruit species availa-ble in the overall network (d.f. = 20, t = -0.26, P = 0.80).
Seed size and fruit color
Seeds ingested by birds (N = 61, median = 2.00 mm, range = 0.3-8.5) were larger than seeds consumed by bats (N = 63, median = 1.00 mm, range = 0.3-6.0) (U = 1526.0, p = 0.048). Birds dispersed seeds from fruits of six different colors; purple (50%), blue (21%), green (14%), brown (7%), red (5%) and yel-low (3%), whereas bats dispersed mainly seeds of green fruits (91%), with a lower percentage of brown (6%) and purple (3%) fruits.
Guild structure of the network
The overall seed dispersal network comprised of eight bird and 12 bat species, which dispersed seeds from 56 plant species (Fig. 1, Appendix S3*). Seeds of 28 plant species were
dispersed exclusively by bats, 23 exclusively by birds, and 5 by both taxa, in a total of 124 interactions. The overall network was more modular (M = 0.58, p < 0.001) than the 21 single-taxon networks with either bats or birds used for comparison (M = 0.35 ± 0.07, d.f. = 20, t = 11.4, p < 0.001) and another mixed network from Peru (M = 0.45), but exhibited lower nestedness (NODF = 0.21, p < 0.001) than the same 21 single-taxon networks (NODF = 0.48 ± 0.10, d.f. = 20, t = 15.0, p < 0.001) and mixed network (NODF = 0.31). The bat sub-net-work (NODF = 0.48, p < 0.001) had a higher degree of nestedness than the overall network, whereas the bird sub-network was not significantly nested (NODF = 0.21, p = 0.59).
Eight modules were detected in the overall network. Five modules were composed exclusively of birds, two exclusively of bats, and one module contained species of both groups (Fig. 1).
Relative importance of bat and bird species
The most important species, identified as connector hubs (R6), were the bat Carollia perspicillata and the bird Chiroxiphia pareola. Modules were centered on these hubs. These were fol-lowed by two provincial hubs (R5), the bat Rhinophylla pumilio Peters, 1865 (Phyllostomidae) and the bird Ceratopipra rubrocapilla. Two plant species functioned as non-hub connec-tors (R3), binding together different modules, although having fewer interactions than a hub: Piper caldense C.DC 1872 (Piperaceae) and Philodendron sp. Schott.1829 (Araceae). There was large variation in all centrality metrics among the frugivore species in the seed dispersal network of Coimbra Forest (Table II). Variances did not differ among categories of level of frugivory for network functional role (FR: F = 2.53, p = 0.08), degree cen-trality (kr: F = 1.85, p = 0.17), and betweenness centrality (BC: F = 1.35, p = 0.30). The GLMM was significant for degree central-ity (N = 20, F = 8.01, p = 0.001, Power = 0.99) and betweenness centrality (N = 20, F = 6.35, p = 0.003, Power = 0.97), but not for network functional role (N = 20, d.f. = 7, F = 1.81, p = 0.18, Power = 0.48). There were no significant effects of level of frugivory (level of frugivory – FR: F = 0.78, p = 0.48, partial eta2= 0.12; kr: F = 2.50, p = 0.12, partial eta2 = 0.29; BC: F = 1.44, p =
0.28, partial eta2 = 0.19) and disperser group (FR: F = 0.005, p =
0.95, partial eta2 = 0.00; k
r: F = 0.27, p = 0.62, partial eta 2 = 0.02;
BC: F = 1.37, p = 0.26, partial eta2 = 0.10) on the centrality metrics
analyzed (Figs 2-7). The number of captures (p-values – FR: 0.80, kr = 0.97, BC = 0.76) and the number of fecal samples analyzed
(P-values – FR: 0.72, kr = 0.79, BC = 0.60) for each species did
also not explain the variation in the centrality metrics. Despite the lack of differences in averages and variances among levels of frugivory in all three centrality metrics, there was an interesting pattern of outliers and extreme values. Specialized frugivores, such as the bat Carollia perspicillata and the bird Chiroxiphia pareola, were the only species to reach the highest values of all centrality metrics (Table III).
DISCUSSION
Our findings support the hypothesis that the seed dis-persal network of Coimbra Forest is highly modular, with bats and birds forming separated guilds and playing different func-tional roles. This separation of guilds may be explained by in-teraction syndromes. Also, as anticipated, the most important species for the maintenance of the seed dispersal system were specialized frugivores. In summary, our results suggest that the maintenance of seed dispersal within our highly impacted area largely depends on the complementarity among modules and on the survival of specialized frugivorous bats and birds.
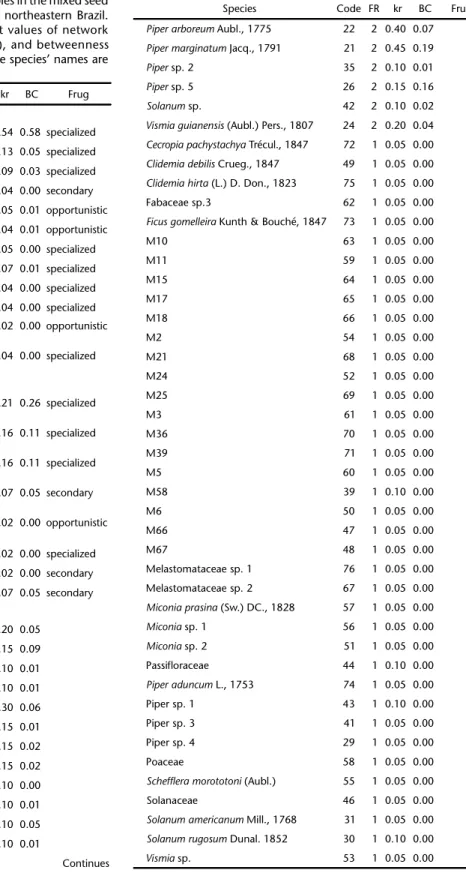
Table II. The studied species of bats, birds, and plants showed a large variation in their ecological functional roles in the mixed seed dispersal network form the Coimbra Forest, northeastern Brazil. Specialized frugivores reached the highest values of network functional role (FR), degree centrality (kr), and betweenness centrality (BC). The codes presented after the species’ names are the same used in Fig. 1.
Species Code FR kr BC Frug Bats
Carolliaperspicillata (Linnaeus, 1758) 1 6 0.54 0.58 specialized
Rhinophyllapumilio W. Peters, 1865 2 5 0.13 0.05 specialized
Artibeusfimbriatus Gray, 1838 3 2 0.09 0.03 specialized
Glossophagasoricina (Pallas, 1766) 9 2 0.04 0.00 secondary
Trachopscirrhosus (Spix, 1823) 6 2 0.05 0.01 opportunistic
Trinycterisnicefori Sanborn, 1949 11 2 0.04 0.01 opportunistic
Artibeuscinereus (P. Gervais, 1856) 5 1 0.05 0.00 specialized
Artibeuslituratus (Olfers, 1818) 4 1 0.07 0.01 specialized
Artibeusobscurus (Schinz, 1821) 8 1 0.04 0.00 specialized
Artibeusplanirostris (Spix, 1823) 7 1 0.04 0.00 specialized
Phyllostomuselongatus (É. Geoffroy, 1810)
12 1 0.02 0.00 opportunistic
Platyrrhinuslineatus (É. Geoffroy, 1810)
10 1 0.04 0.00 specialized
Birds
Chiroxiphiapareola (Linnaeus, 1766)
13 6 0.21 0.26 specialized
Ceratopiprarubrocapilla
(Temminck, 1821)
14 5 0.16 0.11 specialized
Manacusmanacus (Linnaeus, 1766)
15 2 0.16 0.11 specialized
Saltatormaximus (Statius Muller, 1776)
16 2 0.07 0.05 secondary
Dysithamnusmentalis (Temminck, 1823)
18 1 0.02 0.00 opportunistic
Euphoniaviolacea (Linnaeus, 1758) 19 1 0.02 0.00 specialized
Tangaracayana (Linnaeus, 1766) 20 1 0.02 0.00 secondary
Turdusalbicollis Vieillot, 1818 17 1 0.07 0.05 secondary Plants
Philodendron sp. Schott.1829 25 3 0.20 0.05
Pipercaldense C.DC. 1872 32 3 0.15 0.09
Fabaceae sp. 1 37 2 0.10 0.01
Fabaceae sp. 2 38 2 0.10 0.01
M42 23 2 0.30 0.06
M46 27 2 0.15 0.01
M47 28 2 0.15 0.02
M52 33 2 0.15 0.02
M53 34 2 0.10 0.00
M55 36 2 0.10 0.01
M59 40 2 0.10 0.05
M64 45 2 0.10 0.01
Continues
Table II. Continued.
Species Code FR kr BC Frug
Piperarboreum Aubl., 1775 22 2 0.40 0.07
Pipermarginatum Jacq., 1791 21 2 0.45 0.19
Piper sp. 2 35 2 0.10 0.01
Piper sp. 5 26 2 0.15 0.16
Solanum sp. 42 2 0.10 0.02
Vismiaguianensis (Aubl.) Pers., 1807 24 2 0.20 0.04
Cecropiapachystachya Trécul., 1847 72 1 0.05 0.00
Clidemiadebilis Crueg., 1847 49 1 0.05 0.00
Clidemiahirta (L.) D. Don., 1823 75 1 0.05 0.00 Fabaceae sp.3 62 1 0.05 0.00
Ficusgomelleira Kunth & Bouché, 1847 73 1 0.05 0.00
M10 63 1 0.05 0.00
M11 59 1 0.05 0.00
M15 64 1 0.05 0.00
M17 65 1 0.05 0.00
M18 66 1 0.05 0.00
M2 54 1 0.05 0.00
M21 68 1 0.05 0.00
M24 52 1 0.05 0.00
M25 69 1 0.05 0.00
M3 61 1 0.05 0.00
M36 70 1 0.05 0.00
M39 71 1 0.05 0.00
M5 60 1 0.05 0.00
M58 39 1 0.10 0.00
M6 50 1 0.05 0.00
M66 47 1 0.05 0.00
M67 48 1 0.05 0.00
Melastomataceae sp. 1 76 1 0.05 0.00 Melastomataceae sp. 2 67 1 0.05 0.00
Miconiaprasina (Sw.) DC., 1828 57 1 0.05 0.00
Miconia sp. 1 56 1 0.05 0.00
Miconia sp. 2 51 1 0.05 0.00
Passifloraceae 44 1 0.10 0.00
Piperaduncum L., 1753 74 1 0.05 0.00 Piper sp. 1 43 1 0.10 0.00 Piper sp. 3 41 1 0.05 0.00 Piper sp. 4 29 1 0.05 0.00
Poaceae 58 1 0.05 0.00
Scheffleramorototoni (Aubl.) 55 1 0.05 0.00 Solanaceae 46 1 0.05 0.00
Solanumamericanum Mill., 1768 31 1 0.05 0.00
Solanumrugosum Dunal. 1852 30 1 0.10 0.00
which comprised either birds or bats. First, as observed in other seed dispersal networks (MELLO et al. 2011a) and oil-flower pol-lination networks (BEZERRAet al. 2009), mixed networks are less nested than single-taxon networks. Although we should be careful when interpreting the topological metrics of the bat or bird subnetworks – as they are very small – these results are consistent with the hypothesis that mutualistic modules formed by phylogenetically related species are tiny worlds (BEZERRA et al. 2009) within small worlds (OLESENet al. 2006), i.e., subnet-works with higher cohesiveness than whole netsubnet-works. They also corroborate the hypothesis that plant-animal mutualisms at the community level are mosaics of subsystems with differ-ent structure and dynamics (JORDANO (1987).
This conclusion is also supported by the much higher modularity observed in the mixed seed-dispersal network as compared with single-taxon networks. In the Coimbra Forest network there was strong separation between bird and bat modules, as from the eight modules detected only one was mixed. Therefore, although species within a module play some-what redundant roles by dispersing particular subsets of plants, modules in the network are complementary. This information is relevant for conservation, as efficient strategies for mainte-nance of ecosystem services should take into account ecologi-cal redundancy (WALKER 1992, ALVES-COSTA & ETEROVICK 2007).
Our results show that bats and birds probably do not replace each other in the seed-dispersal service; so both groups need to be preserved within local systems – especially when other dispersers have already been lost.
The biological features that explain the observed modu-lar and hierarchical structure within the disperser network are especially interesting. The separation between birds and bats in terms of dispersal services is explained at least in part by the theory of dispersal syndromes (VANDER PIJL 1972), as in the area fruit color was related to disperser choice. Although this theory has been criticized (e.g., OLLERTON et al. 2009), some of its pre-dictions are useful to understand fruit selection by bats and birds. Specifically, there is growing evidence that these disperser groups focus on different plant species (MUSCARELLA & FLEMING 2007, LOBOVA et al. 2009), and that their choices are largely re-lated to fruit characteristics (KALKO et al. 1996, KALKO & CONDON 1998, KORINE & KALKO 2005). Results were also consistent with syndromes, as bats dispersed smaller seeds. However, as our study was based only on fecal samples, it remains unknown to what extent the remaining birds and bats can disperse large-seed plants. Evidence from a rainforest in Mexico suggests that bats can partly replace larger dispersers (MELO et al. 2009).
Similar differences in nestedness and modularity were observed between the study network and a mixed seed-dispersal Figures 2-7. On average, there was no effect of level of frugivory (2-4) and disperser group (5-7) on the three centrality metrics studied (network functional role, degree centrality, and betweenness centrality), and variances were also similar among categories. However, we noticed that all outliers and extreme values occurred only in the category ‘specialized’; furthermore, there was a slight, but non-significant, trend towards higher variance in this category. In the plot, the central line represents the median, the boxes represent the quartiles, the whiskers represent the 95% interval, and * represents outliers.
2
7 6
5
network from Peru (analyzed by MELLO et al. 2011a). The higher modularity and lower nestedness of the study network com-pared with the Peruvian network are probably an effect of the loss of other frugivores in Coimbra Forest. Medium- and large-bodied mammals, birds, and reptiles are frequently generalistic frugivores (ALVES-COSTA & ETEROVICK 2007), binding different parts of the network and increasing its cohesiveness. These animals are also among those preferred by poachers and hunt-ers (REDFORD 1992), and are among the first to be lost due to fragmentation effects (FAHRIG 2003). Therefore, species loss due to human influence may significantly increase modularity, i.e., guild segregation, in seed-dispersal networks. This hypothesis remains to be tested in future studies.
Our mixed model detected no significant effect of level of frugivory on network functional role, degree centrality, and betweenness centrality (contrary to the observations by MELLO et al. 2011b). However, in our study only specialized frugivores attained the highest functional roles (i.e., extremes and outli-ers) in the mixed network: hubs and connectors. This is an important finding, consistent with results obtained in studies on pollination (BEZERRA et al. 2009, DUPONT & OLESEN 2009, GONZALEZet al. 2010) and seed dispersal (MELLOet al. 2011b), which indicate that, regardless on their level of specialization, the keystones in each network are dietary specialists (frugivores that feed exclusively or mainly on fruits). Interestingly, there were some differences in centrality between specialized frugivores, especially bats of the subfamilies Stenodermatinae and Carolliinae. Among specialized frugivorous bats, the first are considered more specialized than the latter (LOBOVA et al. 2009). However, those subtle differences did not result in stenodermatines being more central than carolliines, as what matters in our context in how dependent on fruits an animal is, no matter on how many fruit species it specializes.
It should be noted that the concept of specialization is a source of disagreement in the literature (BLÜTHGEN 2010, MELLO et al. 2011b). There are several ecological concepts of special-ization, which take into account not only the number of in-teractions made by a species, but also different aspects of the phylogenetic signal in those interactions (DEVICTOR et al. 2010). However, in the network literature, specialization is in most cases referred to as simply the number or strength of the inter-actions made by a species (BASCOMPTEet al. 2006) or the unique-ness of those interactions when compared to the patterns observed in other species in the same network (BLÜTHGEN et al. 2006). We propose that, in network studies, specialization should be defined on biological grounds, while centrality metrics should be used as surrogates for relative importance in the community as a network. Centrality metrics can be also used as surrogates for ecological specialization, although care must be taken not to mistake the former for the latter. For instance, in the studied network, a highly specialized frugivore, such as the phyllostomid bat Carollia perspicillata, could have been called a ‘generalist’ (following the terminology of most
Table III. Some specialized frugivores, such as the bat Carollia perspicillata and the bird Chiroxiphiapareola, were the only species to reach extreme values of all centrality metrics, although there were no differences on average in centrality among categories of dietary specialization.
Centrality metric Level of frugivory Species Value Network Opportunistic Highest 1 Trachops cirrhosus 2 functional role 2Trinycteris nicefori 2 Lowest 1 Dysithamnus mentalis 1 2 Phyllostomus elongatus 1 Secondary Highest 1Glossophaga soricina 2 2 Saltator maximus 2 Lowest 1Turdus albicollis 1
2Tangara cayana 1
network studies), which does not make any sense from a bio-logical perspective.
Two plant species functioned as connectors in the net-work (Piper caldense and Philodendron sp.), as they bound to-gether different modules. These two genera are core components of the diet of some numerically important bats (Carolliinae and Stenodermatinae) genera (HENRY & KALKO 2007). Therefore, these plants are good candidates to be used in for-est rfor-estoration programs, as they may accelerate the process of regeneration of the seed-dispersal network in degraded areas.
In summary, the seed-dispersal service in the Coimbra Forest appears to be structured as a network with a combined topology. Future conservation plans should take into account the modular structure of seed-dispersal networks. Moreover, guild diversity should be prioritized since the loss of some dis-perser groups seems to cause a more modular system in which interactions are fragmented and the system as a whole is less resilient.
ACKNOWLEDGEMENTS
We thank many colleagues who helped us during this study. Gleice P. Silva assisted us in the field. Sônia Roda and Thaís Lira helped us identify frugivore species. Andrej Mrvar, Carsten Dormann, Flávia Marquitti, Mário Almeida-Neto, Roger Guimerà, and Vladmir Batagelj provided us with their network software. Elisabeth Kalko and Nico Blüthgen discussed with us the biological meaning of network metrics, what was extremely helpful in trying to strengthen the link between natural his-tory, ecological theory, and network ecology. Scott Heald and Richard Ladle proofread our manuscript. Usina Serra Grande allowed us to carry out research in Mata de Coimbra. CEPAN made this project possible by establishing a partnership be-tween Usina Serra Grande and Universidade Federal de Pernambuco. This project was funded by the Brazilian Research Council (CNPq, 485309/2006-8). Marco Mello was sponsored by the Alexander von Humboldt Foundation (AvH, 1134644) and the Federal University of Minas Gerais (UFMG, edital 2013/ 1). This work is dedicated to the memory of Elisabeth Kalko.
LITERATURE CITED
ALMEIDA-NETO, M.; P.R. GUIMARÃES; P.R. GUIMARÃES JR; R.D. LOYOLA & W. ULRICH. 2008. A consistent metric for nestedness analysis in ecological systems: reconciling concept and measurement. Oikos 117: 1227-1239. doi: 10.1111/j.0030-1299.2008.16644.x
ALVES-COSTA, C.P. & P.C. ETEROVICK. 2007. Seed dispersal services by coatis (Nasua nasua, Procyonidae) and their redundancy with other frugivores in southeastern Brazil. Acta
Oecologica 32: 77-92. doi:10.1016/j.actao.2007.03.001
ATMAR, W. & B.D. PATTERSON. 1993. The measure of order and disorder in the distribution of species in fragmented habitat.
Oecologia 96: 373-382. doi:10.1007/BF00317508
BASCOMPTE, J. & P. JORDANO. 2007. Plant-animal mutualistic networks: the architecture of biodiversity. Annual Review
of Ecology Evolution and Systematics 38: 567-593. doi:
10.1146/annurev.ecolsys.38.091206.095818
BASCOMPTE, J.; P. JORDANO; C.J. MELIAN & J.M. OLESEN. 2003. The nested assembly of plant-animal mutualistic networks.
Proceedings of the National Academy of Sciences of the
United States of America 100: 9383-9387. doi: 10.1073/
pnas.1633576100
BASCOMPTE, J.; P. JORDANO & J.M. OLESEN. 2006. Asymmetric coevolutionary networks facilitate biodiversity maintenance.
Science 312: 431-433. doi: 10.1126/science.1123412
BEZERRA, E.L.S.; I.C.S. MACHADO & M.A.R. MELLO. 2009. Pollination networks of oil-flowers: a tiny world within the smallest of all worlds. Journal of Animal Ecology 78: 1096-1101. doi: 10.1111/j.1365-2656.2009.01567.x
BLÜTHGEN, N. 2010. Why network analysis is often disconnected from community ecology: a critique and an ecologist’s guide.
Basic and Applied Ecology 11: 185-195. doi:10.1016/
j.baae.2010.01.001
BLÜTHGEN, N.; F. MENZEL & N. BLÜTHGEN. 2006. Measuring specialization in species interaction networks. BMC Ecology 6: 1-12. doi:10.1186/1472-6785-6-9
BRONSTEIN, J.L. 1994. Our current understanding of mutualism.
The Quarterly Review of Biology 69: 31-51.
DEVICTOR, V.; J. CLAVEL; R. JULLIARD; S. LAVERGNE; D. MOUILLOT; W. THUILLER; P. VENAIL; S. VILLÉGER & N. MOUQUET. 2010. Defining and measuring ecological specialization. Journal of Applied
Ecology 47: 15-25. doi: 10.1111/j.1365-2664.2009.01744.x
DUPONT, Y.L. & J.M. OLESEN. 2009. Ecological modules and roles of species in heathland plant-insect flower visitor networks.
Journal of Animal Ecology 78: 346-353. doi: 10.1111/
j.1365-2656.2008.01501.x
EMMONS, L.H. & F. FEER. 1997. Neotropical rainforest mammals:
a field guide. Chicago, University of Chicago Press.
FAHRIG, L. 2003. Effects of habitat fragmentation on biodiversity.
Annual Review of Ecology, Evolution, and Systematics 34: 487-515. doi: 10.1146/annurev.ecolsys.34011802.132419 FLEMING, T.H. & W.J. KRESS. 2011. A brief history of fruits and frugivores. Acta Oecologica 37: 521-530. doi:10.1016/ j.actao.2011.01.016
FORTUNA, M.A.; D.B. STOUFFER; J.M. OLESEN; P. JORDANO; D. MOUILLOT; B.R. KRASNOV; R. POULIN & J. BASCOMPTE. 2010. Nestedness versus modularity in ecological networks: two sides of the same coin? Journal of Animal Ecology 79: 811-817. doi: 10.1111/j.1365-2656.2010.01688.x
GALINDO-GONZÁLES, J.; S. GUEVARA & V.J. SOSA. 2000. Bat and bird-generated seed rains at isolated trees in pastures in a tropi-cal rainforest. Conservation Biology 14: 1693-1703. doi: 10.1111/j.1523-1739.2000.99072.x
GONZALEZ, A.M.M.; B. DALSGAARD & J.M. OLESEN. 2010. Centrality measures and the importance of generalist species in pollination networks. Ecological Complexity 7: 36-43. doi: 10.1016/j.ecocom.2009.03.008.
GORCHOV, D.L.; F. CORNEJO; C.F. ASCORRA & M. JARAMILLO. 1995. Dietary overlap between frugivorous birds and bats in the Peruvian Amazon. Oikos74: 235-250.
GRILLO, A.S.; A.A. OLIVEIRA & M. TABARELLI. 2006. Árvores, p. 190-216. In: K.C. PÔRTO; J.S. ALMEIDA-CORTEZ & M. TABARELLI (Eds).
Diversidade biológica e conservação da floresta
atlânti-ca ao norte do Rio São Francisco. Brasília, Ministério do
Meio Ambiente, Série Biodiversidade 14.
GUIMARÃES, P.R. & P. GUIMARÃES. 2006. Improving the analyses of nestedness for large sets of matrices. Environmental
Modelling and Software 21: 1512-1513. doi:10.1016/
j.envsoft.2006.04.002.
GUIMERÀ, R. & L.A.N. AMARAL. 2005. Functional cartography of complex metabolic networks. Nature 433: 895-900. doi:10.1038/nature03288
HENRY, M. & E.K.V. KALKO. 2007. Foraging strategy and breeding constraints of Rhinophylla pumilio (Phyllostomidae) in the Amazon lowlands. Journal of Mammalogy 88: 81-93. doi:
http://dx.doi.org/10.1644/06-MAMM-A-001R1.1
JORDANO, P. 1987. Patterns of mutualistic interactions in pollination and seed dispersal – connectance, dependence asymmetries, and coevolution. The American Naturalist 129: 657-677. JORDANO, P.; J. BASCOMPTE & J.M. OLESEN. 2003. Invariant properties in
coevolutionary networks of plant-animal interactions. Ecology
Letters 6: 69-81. doi: 10.1046/j.1461-0248.2003.00403.x
KALKO, E.K.V. & M.A. CONDON. 1998. Echolocation, olfaction and fruit display: how bats find fruit of flagellichorous cucurbits. Functional Ecology 12: 364-372. doi: 10.1046/ j.1365-2435.1998.00198.x
KALKO, E.K.V.; E.A. HERRE & C.O. HANDLEY. 1996. The relation of fig fruit syndromes to fruit-eating bats in the New and Old World tropics. Journal of Biogeography 23: 565-576. doi: 10.1111/j.1365-2699.1996.tb00018.x
KORINE, C. & E.K.V. KALKO. 2005. Fruit detection and discrimination by small fruit-eating bats (Phyllostomidae): echolocation call design and olfaction. Behavioral Ecology and Sociobiology 59: 12-23. doi: 10.1007/s00265-005-0003-1
LOBOVA, T.A.; C.K. GEISELMAN & S.A. MORI. 2009. Seed dispersal
by bats in the Neotropics. New York, New York Botanical
Garden Press.
KRISHNA, A.;P.R. GUIMARAES; P. JORDANO & J. BASCOMPTE. 2008. A neutral-niche theory of nestedness in mutualistic networks. Oikos 117: 1609-1618. doi: 10.1111/j.1600-0706.2008.16540.x
MANLY, B.F.J. 2007. Randomization, bootstrap and Monte
Carlo methods in biology. Boca Raton, Chapman & Hall/
CRC, 3rd ed.
MELLO, M.A.R.; E.L.S. BEZERRA & I.C. MACHADO. 2013. Functional roles of Centridini oil bees and Malpighiaceae oil flowers in biome-wide pollination networks. Biotropica 45:
45-53.doi: 10.1111/j.1744-7429.2012.00899.x
MELLO, M.A.R.; F. MARQUITTI; P. GUIMARÃES; E. KALKO; P. JORDANO & M. DE AGUIAR. 2011a. The modularity of seed dispersal: differences in structure and robustness between bat– and bird–fruit networks. Oecologia 167: 131-140. doi:10.1007/ s00442-011-1984-2
MELLO, M.A.R.; F.M.D. MARQUITTI; P.R. GUIMARÃES JR; E.K.V. KALKO; P. JORDANO & M.A.M. DE AGUIAR. 2011b. The missing part of seed dispersal networks: structure and robustness of bat-fruit interactions. PLOS One 6: e17395. doi:10.1371/ journal.pone.0017395
MELO, F.P.L.; B. RODRIGUEZ-HERRERA; R.L. CHAZDON; R.A. MEDELLIN & G.G. CEBALLOS. 2009. Small tent-roosting bats promote dispersal of large-seeded plants in a Neotropical forest. Biotropica 41: 737-743. doi: 10.1111/j.1744-7429.2009.00528.x
MUSCARELLA, R. & T.H. FLEMING. 2007. The role of frugivorous bats in tropical forest succession. Biological Reviews 82: 573-590. doi: 10.1111/j.1469-185X.2007.00026.x
NOOY, W.; A. MRVAR & V. BATAGELJ. 2005. Exploratory social
network analysis with Pajek. New York, Cambridge
University Press.
OLESEN, J.M.; J. BASCOMPTE; Y.L. DUPONT & P. JORDANO. 2006. The smallest of all worlds: Pollination networks. Journal of Theoretical
Biology 240: 270-276. doi:10.1016/j.jtbi.2005.09.014
OLIVEIRA, M.; A. GRILLO & M. TABARELLI. 2005. Caracterização da flora dos remanescentes da Usina Serra Grande, Alagoas.
Recife, Centro de Pesquisas Ambientais do Nordeste. OLLERTON, J.; R. ALARCON; N.M. WASER; M.V. PRICE; S. WATTS; L.
CRANMER; A. HINGSTON; C.I. PETER & J. ROTENBERRY. 2009. A glo-bal test of the pollination syndrome hypothesis. Annals of
Botany 103: 1471-1480. doi:10.1093/aob/mcp03.
PONTES, A.R.M.; P.H.A.L. PERES; I.C. NORMANDE & C.M. BRAZIL. 2006. Mamíferos, p. 303-324. In: K.C. PÔRTO; J.S. ALMEIDA-CORTEZ & M. TABARELLI (Eds). Diversidade biológica e conservação da
floresta atlântica ao norte do Rio São Francisco. Brasília,
Ministério do Meio Ambiente, Série Biodiversidade 14. REDFORD, K. 1992. The empty forest. BioScience 42: 412-422. RODA, S.A. 2006. Aves, p. 279-302. In: K.C. PÔRTO; J.S. ALMEIDA
-CORTEZ & M. TABARELLI (Eds). Diversidade biológica e con-servação da floresta atlântica ao norte do Rio São
Fran-cisco. Brasília, Ministério do Meio Ambiente, Série
Biodiversidade 14.
SIGRIST, T. 2006. Aves do Brasil: uma visão artística. São Pau-lo, Auk Paper, 2nd ed.
SILVA, J.M.C. & M. TABARELLI. 2000. Tree species impoverishment and the future flora of the Atlantic Forest of northeast Brazil.
Nature 404: 72-74. doi:10.1038/35003563
STRAUBE, F. & G. BIANCONI. 2002. Sobre a grandeza e a unidade utilizada para estimar esforço de captura com utilização de redes-de-neblina. Chiroptera Neotropical 8: 150-152. TABARELLI, M. & S.A. RODA. 2005. Uma oportunidade para o
TERBORGH, J.; N. PITMAN; M. SILMAN; H. SCHICHTER & V.P. NÚÑES. 2002. Maintenance of tree diversity in tropical forests, p. 1-17. In: D.J. LEVEY; W.R. SILVA & M. GALETTI (Eds). Seed dispersal
and frugivory: ecology, evolution, and conservation. New
York, CABI Publishing.
THIES, W. & E.K.V. KALKO. 2004. Phenology of Neotropical pepper plants (Piperaceae) and their association with their main dispersers, two short-tailed fruit bats, Carollia perspicillata and C. castanea (Phyllostomidae). Oikos 104: 362-376. doi: 10.1111/j.0030-1299.2004.12747.x
ULRICH, W.; M. ALMEIDA-NETO & N.J. GOTELLI. 2009. A consumer’s
Submitted: 04.XII.2013; Accepted: 06.IV.2014. Editorial responsibility: Diego Astúa de Moraes
guide to nestedness analysis Oikos 118: 3-17. doi: 10.1111/ j.1600-0706.2008.17053.x
VANDER PIJL, L. 1972. Principles of dispersal in higher plants.
Berlin, Springer Verlag.
VIZOTTO, L.D. & V.A. TADDEI. 1973. Chave para determinação
de quirópteros brasileiros. São José do Rio Preto, EDUSP.
WALKER, B.H. 1992. Biodiversity and ecological redundancy.
Conservation Biology 6: 18-23. doi:
10.1046/j.1523-1739.1992.610018.x