Dose Equates to Chronic Exposure
Birger Scholz1, Marcus Svensson1, Henrik Alm1, Karl Sko¨ld1, Maria Fa¨lth1, Kim Kultima1, Ce´line Guigoni2, Evelyne Doudnikoff2, Qin Li3, Alan R. Crossman4, Erwan Bezard2.*, Per E. Andre´n1.
1Department of Pharmaceutical Biosciences, Uppsala Biomedicinska Centrum (BMC), Uppsala University, Uppsala, Sweden,2Universite´ Victor Segalen Bordeaux 2, Centre National de la Recherche Scientifique, Bordeaux Institute of Neuroscience, UMR 5227, Bordeaux, France,3Institute of Lab Animal Sciences, China Academy of Medical Sciences, Beijing, China,4Faculty of Life Sciences, The University of Manchester, Manchester, United Kingdom
Abstract
L-3,4-dihydroxypheylalanine (L-dopa)-induced dyskinesia represent a debilitating complication of therapy for Parkinson’s disease (PD) that result from a progressive sensitization through repeated L-dopa exposures. The MPTP macaque model was used to study the proteome in dopamine-depleted striatum with and without subsequent acute and chronic L-dopa treatment using two-dimensional difference in-gel electrophoresis (2D-DIGE) and mass spectrometry. The present data suggest that the dopamine-depleted striatum is so sensitive tode novoL-dopa treatment that the first ever administration alone would be able (i) to induce rapid post-translational modification-based proteomic changes that are specific to this first exposure and (ii), possibly, lead to irreversible protein level changes that would be not further modified by chronic L-dopa treatment. The apparent equivalence between first and chronic L-dopa administration suggests that priming would be the direct consequence of dopamine loss, the first L-dopa administrations only exacerbating the sensitization process but not inducing it.
Citation:Scholz B, Svensson M, Alm H, Sko¨ld K, Fa¨lth M, et al (2008) Striatal Proteomic Analysis Suggests that First L-Dopa Dose Equates to Chronic Exposure. PLoS ONE 3(2): e1589. doi:10.1371/journal.pone.0001589
Editor:Schahram Akbarian, University of Massachusetts Medical School, United States of America
ReceivedNovember 14, 2007;AcceptedJanuary 17, 2008;PublishedFebruary 13, 2008
Copyright:ß2008 Scholz et al. This is an open-access article distributed under the terms of the Creative Commons Attribution License, which permits unrestricted use, distribution, and reproduction in any medium, provided the original author and source are credited.
Funding:We want to acknowledge the work (2D-DIGE separations) done by the Proteomic Resource Centre at Uppsala university, which was established with funding from Wallenberg Consortium North (WCN). This study was sponsored by the Michael J. Fox Foundation for Parkinson Research (ARC,EB), Swedish Research Council (VR) Grants 2002-6116 and 2004-3417 (PEA), the Swedish Foundation for International Cooperation in Research and Higher Education (STINT) Institutional grant (PEA), the K&A Wallenberg Foundation (PEA), Swedish Knowledge Foundation through the Industrial PhD program in Medical Bioinformatics at the Centre for Medical Innovations (CMI) at Karolinska Institutet (PEA).
Competing Interests:The authors have declared that no competing interests exist.
*E-mail: [email protected]
.These authors contributed equally to this work.
Introduction
Involuntary movements, or dyskinesias, represent a debilitating complication of L-3,4-dihydroxyphenylalanine (L-dopa) therapy for Parkinson’s disease (PD), experienced, ultimately, by the vast majority of the patients [1]. The past few years have seen unprecedented progress towards better understanding of the underlying neural mechanisms of existing L-dopa-induced dyski-nesia (LID). LID has been associated with a sequence of events that include pulsatile stimulation of striatal dopamine (DA) receptors, downstream changes in striatal proteins and genes, abnormalities in non-dopaminergic transmitter systems all of which combine to produce alterations in the neuronal firing patterns that signal between the basal ganglia and the cortex [2]. However, the very first molecular events thought to be responsible for the establishment of LID and generally grouped under the term of ‘‘priming’’ are poorly known. Priming is classically defined as the process by which the brain becomes sensitized such that administration of dopaminergic therapy modifies the response to subsequent dopaminergic treatments [3]. In this way, over time, with repeated treatment, the chance of dopaminergic stimulation eliciting LID is increased and once LID has been established, the severity of dyskinesia increases. Study of immediate-early gene expression has unraveled that a single
administration of a DA agonist induces a complex striatal response [4,5], including components of homeostatic response to excessive stimulation as well as genes subserving cellular and synaptic plasticity [4].
chronically-treated with L-dopa for months and displaying overt dyskinesia at the peak of antiparkinsonian effect (CP; n = 10).
Results
Experimental groups
MPTP intoxication procedure and further vehicle or L-dopa treatment for several months at a tailored dose designed to produce a full reversal of parkinsonian condition were performed as described in many occasions [e.g. see 8,9–11] (Note that by L-dopa, we actually mean the clinical formulation ModoparH, (Roche) that is a combination of L-dopa and carbidopa at a fixed ratio of 4:1). Clinical observations were conducted throughout the experimental proce-dure, but, because of the acute administration of L-dopa in one group, the last hour immediately before death was carefully investigated as it represents exactly the clinical status of the animals. The parkinsonian disability score of both acutely (AP) and chronically (CP) L-dopa-treated MPTP-lesioned animals significant-ly improved during this first hour post-L-dopa administration (Fig. 1A) while the sole chronically L-dopa-treated MPTP-lesioned animals (CP) developed severe LID (Fig. 1B). Measurement of locomotor activity reflected this dyskinetic behaviour as well (Fig. 1C) while acutely-treated animals (AP) displayed a moderate increase in activity as expected for a first ever exposure to L-dopa (Fig. 1C). DA transporter binding experiment revealed that the three MPTP-intoxicated groups had a similar severe nigrostriatal fiber denerva-tion of the striatum (Fig. 1D) as shown in other occasions with the very same MPTP regimen [12].
Differential striatal protein expression
After careful dissection of the commissural and post-commissural motor striatum [11] and extraction, the 2D-DIGE gels were run as previously shown [13]. The design and analysis of the proteomic experiment was done as previously described [6]. A quality estimation of all matched spots resulted in a total of 1211 spots used for group comparisons. A total of 476 proteins, (corresponding to 170 unique identities) were identified using electrospray ionization linear trap quadrupole (ESI-LTQ) mass spectrometry (MS), 445 of them being present among the 1211 estimated spots. Gel-based analysis such as 2D-DIGE is by far the best technique available when analyzing the global proteome without, at the same time, loosing information on protein isoforms. This is reflected in the fact that approximately two thirds of the identified proteins were isoforms (161 unique identities out of 445 identified proteins). Phosphoryla-tions are believed to affect approximately one third of the proteome [14] and are therefore one of the most common post-translational modifications (PTM). All tandem MS (MS/MS) spectra were therefore also analyzed for the presence of phosphorylation signatures, but no phosphorylations in significantly differentially expressed proteins (Table 1) were detected (Table S1). The specific nature of isoform rich protein expression data from the comparison of four different experimental groups (controls, untreated parkinso-nian, AP and CP animals) complicates the interpretation and presentation. We therefore present the data with respect to global expression profiles combined with a traditional Gene Ontology (GO) approach (Fig. 2, Tables 2–3), an isoform adjusted global functional analysis called DEPPS (Fig. 3) and as significantly expressed key candidate proteins (Table 1).
STEM Expression profiling
STEM clustering [7] was used to generate general expression profiles of all identified (445) and unidentified proteins (766). Five maps (Fig. 2, profiles I–V) were found to incorporate the most significant shapes of expression patterns within the present data
set. The common denominator for these profiles is the clear effect of L-dopa in acutely treated animals, i.e. of its first ever administration. Together these profiles correspond to 144 proteins (77 identified) or,12% of all plotted proteins (Table 2). Proteins
in the STEM profiles were considered up or down regulated as compared to the control animal expression. Profiles I and II (total of 77 proteins, 43 identified) showed either up- or down-regulation in untreated MPTP-intoxicated animals, followed by a clear inversion of expression afterde novoacute L-dopa treatment (Fig. 2). Interestingly, those profiles are stabilized after chronic L-dopa treatment. Profiles III and V (total of 47 proteins, 25 identified) were similar to Profiles I and II except that they were not affected by the lesion alone, i.e. in untreated MPTP-intoxicated animals (Fig. 2). The profiles I–III and V showed clear changes induced by acute treatment in drug naive MPTP-intoxicated animals that were neither normalized nor further deregulated after chronic L-dopa treatment (Fig. 2). The profiles were analyzed for GO enrichment using GO annotation available for 442 out of 445 proteins (Table S2). A STEM clustering of similar profiles II and V for GO-analysis indicated alterations in intracellular transport and metabolic processes (Table 3). GO-clustering of profiles I and III showed changes in energy metabolism, but also in organelle/ mitochondria related processes (Table 3).
Although the classic priming concept posits that LID results from a progressive sensitization through repeated administrations [3],
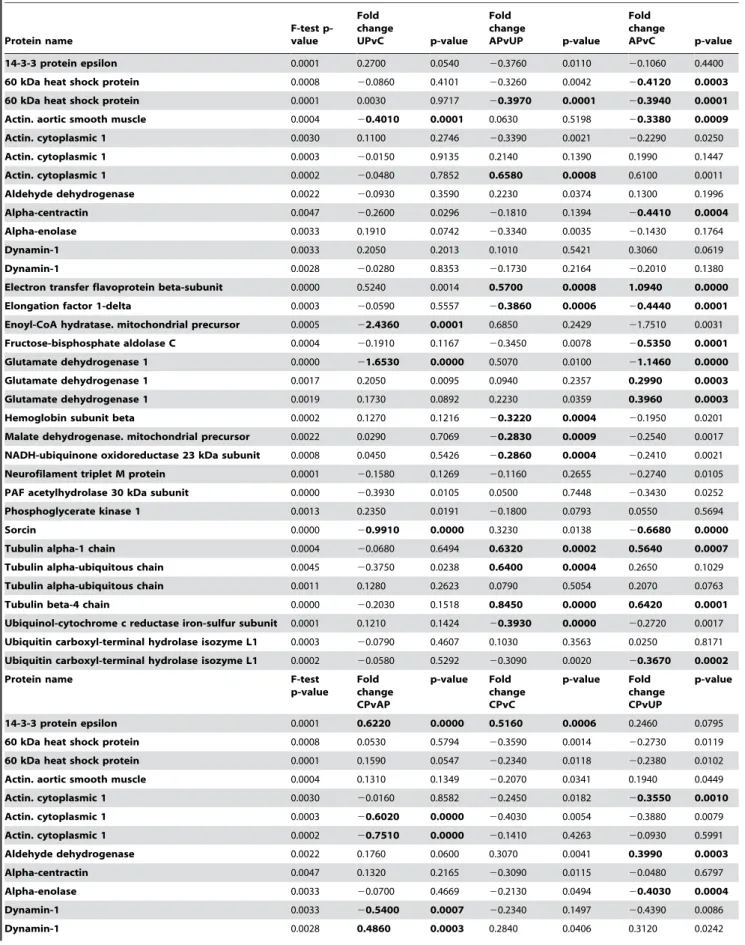
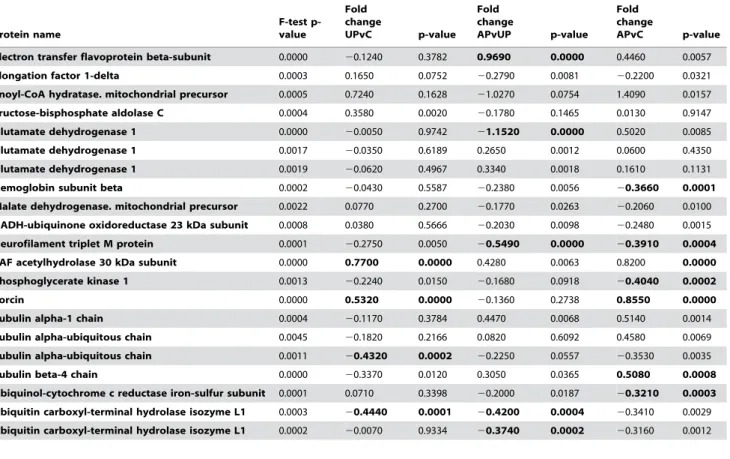
Table 1.Differentially expressed proteins.
Protein name
F-test p-value
Fold change
UPvC p-value
Fold change
APvUP p-value Fold change
APvC p-value
14-3-3 protein epsilon 0.0001 0.2700 0.0540 20.3760 0.0110 20.1060 0.4400
60 kDa heat shock protein 0.0008 20.0860 0.4101 20.3260 0.0042 20.4120 0.0003
60 kDa heat shock protein 0.0001 0.0030 0.9717 20.3970 0.0001 20.3940 0.0001
Actin. aortic smooth muscle 0.0004 20.4010 0.0001 0.0630 0.5198 20.3380 0.0009
Actin. cytoplasmic 1 0.0030 0.1100 0.2746 20.3390 0.0021 20.2290 0.0250
Actin. cytoplasmic 1 0.0003 20.0150 0.9135 0.2140 0.1390 0.1990 0.1447
Actin. cytoplasmic 1 0.0002 20.0480 0.7852 0.6580 0.0008 0.6100 0.0011
Aldehyde dehydrogenase 0.0022 20.0930 0.3590 0.2230 0.0374 0.1300 0.1996
Alpha-centractin 0.0047 20.2600 0.0296 20.1810 0.1394 20.4410 0.0004
Alpha-enolase 0.0033 0.1910 0.0742 20.3340 0.0035 20.1430 0.1764
Dynamin-1 0.0033 0.2050 0.2013 0.1010 0.5421 0.3060 0.0619
Dynamin-1 0.0028 20.0280 0.8353 20.1730 0.2164 20.2010 0.1380
Electron transfer flavoprotein beta-subunit 0.0000 0.5240 0.0014 0.5700 0.0008 1.0940 0.0000
Elongation factor 1-delta 0.0003 20.0590 0.5557 20.3860 0.0006 20.4440 0.0001
Enoyl-CoA hydratase. mitochondrial precursor 0.0005 22.4360 0.0001 0.6850 0.2429 21.7510 0.0031
Fructose-bisphosphate aldolase C 0.0004 20.1910 0.1167 20.3450 0.0078 20.5350 0.0001
Glutamate dehydrogenase 1 0.0000 21.6530 0.0000 0.5070 0.0100 21.1460 0.0000
Glutamate dehydrogenase 1 0.0017 0.2050 0.0095 0.0940 0.2357 0.2990 0.0003
Glutamate dehydrogenase 1 0.0019 0.1730 0.0892 0.2230 0.0359 0.3960 0.0003
Hemoglobin subunit beta 0.0002 0.1270 0.1216 20.3220 0.0004 20.1950 0.0201
Malate dehydrogenase. mitochondrial precursor 0.0022 0.0290 0.7069 20.2830 0.0009 20.2540 0.0017
NADH-ubiquinone oxidoreductase 23 kDa subunit 0.0008 0.0450 0.5426 20.2860 0.0004 20.2410 0.0021
Neurofilament triplet M protein 0.0001 20.1580 0.1269 20.1160 0.2655 20.2740 0.0105
PAF acetylhydrolase 30 kDa subunit 0.0000 20.3930 0.0105 0.0500 0.7448 20.3430 0.0252
Phosphoglycerate kinase 1 0.0013 0.2350 0.0191 20.1800 0.0793 0.0550 0.5694
Sorcin 0.0000 20.9910 0.0000 0.3230 0.0138 20.6680 0.0000
Tubulin alpha-1 chain 0.0004 20.0680 0.6494 0.6320 0.0002 0.5640 0.0007
Tubulin alpha-ubiquitous chain 0.0045 20.3750 0.0238 0.6400 0.0004 0.2650 0.1029
Tubulin alpha-ubiquitous chain 0.0011 0.1280 0.2623 0.0790 0.5054 0.2070 0.0763
Tubulin beta-4 chain 0.0000 20.2030 0.1518 0.8450 0.0000 0.6420 0.0001
Ubiquinol-cytochrome c reductase iron-sulfur subunit 0.0001 0.1210 0.1424 20.3930 0.0000 20.2720 0.0017
Ubiquitin carboxyl-terminal hydrolase isozyme L1 0.0003 20.0790 0.4607 0.1030 0.3563 0.0250 0.8171
Ubiquitin carboxyl-terminal hydrolase isozyme L1 0.0002 20.0580 0.5292 20.3090 0.0020 20.3670 0.0002
Protein name F-test
p-value Fold change CPvAP
p-value Fold change CPvC
p-value Fold change CPvUP
p-value
14-3-3 protein epsilon 0.0001 0.6220 0.0000 0.5160 0.0006 0.2460 0.0795
60 kDa heat shock protein 0.0008 0.0530 0.5794 20.3590 0.0014 20.2730 0.0119
60 kDa heat shock protein 0.0001 0.1590 0.0547 20.2340 0.0118 20.2380 0.0102
Actin. aortic smooth muscle 0.0004 0.1310 0.1349 20.2070 0.0341 0.1940 0.0449
Actin. cytoplasmic 1 0.0030 20.0160 0.8582 20.2450 0.0182 20.3550 0.0010
Actin. cytoplasmic 1 0.0003 20.6020 0.0000 20.4030 0.0054 20.3880 0.0079
Actin. cytoplasmic 1 0.0002 20.7510 0.0000 20.1410 0.4263 20.0930 0.5991
Aldehyde dehydrogenase 0.0022 0.1760 0.0600 0.3070 0.0041 0.3990 0.0003
Alpha-centractin 0.0047 0.1320 0.2165 20.3090 0.0115 20.0480 0.6797
Alpha-enolase 0.0033 20.0700 0.4669 20.2130 0.0494 20.4030 0.0004
Dynamin-1 0.0033 20.5400 0.0007 20.2340 0.1497 20.4390 0.0086
these expression profiles strongly suggest that the DA-depleted striatum is so sensitive tode novoacute L-dopa treatment that the first ever administration alone would be able (i) to induce rapid post-translational modification-based proteomic changes that are specific to this first exposure and (ii), possibly, lead to irreversible protein level changes that would be not further modified by chronic L-dopa treatment.
DEPPS
GO expression profiling in a protein isoform rich data set is dependent on co-regulation of proteins, i.e. that all isoforms for the same protein are similarly up/down regulated. This cannot be assumed to occur among differentially regulated protein isoforms. To further explore proteomic differences between treatment groups, DEPPS profiling was performed between six comparisons (UPvC, APvUP, CPvAP, CPvC, CPvUP, APvC) resulting in a total of 137sets,which correspond to 67 manually annotatedsets and 70 predefined sets from the Molecular Signature Database (MSigDB, http://www.broad.mit.edu/gsea/) [15]. 94 of the more affected groups are shown in Fig. 3 (see Table S3 for all 137 DEPPS sets). DEPPS recognizes differential expression between two groups and does not depend on defining up- or down-regulations. For a more conservative sets estimate, two types of DEPPS analyses were conducted. The first was based on lods-ratio and the second on consecutive ranking. The average rankings
(RL-scores) from these two analyses was used, thereby reducing possiblesetseffects from strongly differentially expressed proteins, without loosing their impact. We discuss below the functional significance of different DEPPSsetsgathered in 3 main groups.
Synaptic plasticity and cytoskeleton are altered by L-dopa treatment
Synaptic activity is related to immediate early gene expression and cytoskeletal dynamics [16,17]. Neural immediate-early gene expres-sion may occur within 1h, followed by their proteins within 1–2h [18]. Few proteins in our 2D-DIGE set can be considered as immediate early proteins, many belonging to multi-copy housekeep-ing groups such as cytoskeleton and metabolism. The acute dopa-treated MPTP-intoxicated (AP) animals were sacrificed 1h after L-dopa treatment, making it unlikely that differential protein expression is due to generally altered rates of protein synthesis/ translation. Acute L-dopa treatment might induce changes in synaptic plasticity, requiring synaptic protein synthesis [19,20] and degradation [20]. This is supported by DEPPS sets (sets 48, 49) changes in protein synthesis and protein stability after L-dopa treatment in APvC, APvUP and CPvC (Fig. 3). Although protein synthesis/degradation is affected by L-dopa treatment, the number of available polyribosomes in dendritic shafts and spines is considered as relatively low [21], which argues against a general rapid increase of synaptic protein translation within 1h.
Further-Protein name
F-test p-value
Fold change
UPvC p-value
Fold change
APvUP p-value Fold change
APvC p-value
Electron transfer flavoprotein beta-subunit 0.0000 20.1240 0.3782 0.9690 0.0000 0.4460 0.0057
Elongation factor 1-delta 0.0003 0.1650 0.0752 20.2790 0.0081 20.2200 0.0321
Enoyl-CoA hydratase. mitochondrial precursor 0.0005 0.7240 0.1628 21.0270 0.0754 1.4090 0.0157
Fructose-bisphosphate aldolase C 0.0004 0.3580 0.0020 20.1780 0.1465 0.0130 0.9147
Glutamate dehydrogenase 1 0.0000 20.0050 0.9742 21.1520 0.0000 0.5020 0.0085
Glutamate dehydrogenase 1 0.0017 20.0350 0.6189 0.2650 0.0012 0.0600 0.4350
Glutamate dehydrogenase 1 0.0019 20.0620 0.4967 0.3340 0.0018 0.1610 0.1131
Hemoglobin subunit beta 0.0002 20.0430 0.5587 20.2380 0.0056 20.3660 0.0001
Malate dehydrogenase. mitochondrial precursor 0.0022 0.0770 0.2700 20.1770 0.0263 20.2060 0.0100
NADH-ubiquinone oxidoreductase 23 kDa subunit 0.0008 0.0380 0.5666 20.2030 0.0098 20.2480 0.0015
Neurofilament triplet M protein 0.0001 20.2750 0.0050 20.5490 0.0000 20.3910 0.0004
PAF acetylhydrolase 30 kDa subunit 0.0000 0.7700 0.0000 0.4280 0.0063 0.8200 0.0000
Phosphoglycerate kinase 1 0.0013 20.2240 0.0150 20.1680 0.0918 20.4040 0.0002
Sorcin 0.0000 0.5320 0.0000 20.1360 0.2738 0.8550 0.0000
Tubulin alpha-1 chain 0.0004 20.1170 0.3784 0.4470 0.0068 0.5140 0.0014
Tubulin alpha-ubiquitous chain 0.0045 20.1820 0.2166 0.0820 0.6092 0.4580 0.0069
Tubulin alpha-ubiquitous chain 0.0011 20.4320 0.0002 20.2250 0.0557 20.3530 0.0035
Tubulin beta-4 chain 0.0000 20.3370 0.0120 0.3050 0.0365 0.5080 0.0008
Ubiquinol-cytochrome c reductase iron-sulfur subunit 0.0001 0.0710 0.3398 20.2000 0.0187 20.3210 0.0003
Ubiquitin carboxyl-terminal hydrolase isozyme L1 0.0003 20.4440 0.0001 20.4200 0.0004 20.3410 0.0029
Ubiquitin carboxyl-terminal hydrolase isozyme L1 0.0002 20.0070 0.9334 20.3740 0.0002 20.3160 0.0012
Proteins that are differentially expressed between groups. Significance defined by moderated nested F-test statistics (F-test p-value,0.005. moderated t-test p,0.001 are written with bold text). Fold change is in log2.
more, studies on L-dopa treatment in 6-OHDA rats indicate altered PTM patterns in striatal synaptic proteins without changes in their total levels [22].
We therefore propose that acute L-dopa-treated MPTP-intoxi-cated (AP) animals mainly show PTM-based proteomic changes, PTMs being defined as both modifications of existing proteins, such as phosphorylation, and proteolytic cleavage, for instance specific cleavage of precursors [23]. Both PD and LID are associated with an altered cortico-striatal synaptic plasticity [24]. Proteins reported in the postsynaptic density (PSD), dendrites or axons or involved in general synaptic transmission and receptor recycling were altered in CPvAP (DEPPSsets 5, 6, 7, 37, 39, 40) as were endocytosis and vesicle recycling proteins (DEPPS sets 43, 113)(Fig. 3). Vesicle recycling and synaptic plasticity is dependent on the actin cytoskeleton [25]. The polymerization state of actin is highly sensitive to synaptic activity [17] and a beta-actin enriched set (DEPPSsets 54, 71) differed in both APvC, CPvAP, CPvUP and CPvC (Fig. 3). Microtubule proteins were clearly affected in APvUP, CPvAP and CPvUP but not in CPvC (DEPPSsets57, 60, 61) (Fig. 3). This might be related to L-dopa induced alterations in synaptic plasticity as microtubule stability is believed to regulate synaptic transmission [16,17]. Altogether these changes suggest that, in our animal model, acute and chronic L-dopa treatments affect synaptic activity through synaptic structure. Since a loss of dendritic spines on striatopallidal neurons has recently been reported both in the 6-OHDA rat model and in postmortem samples from PD patients [26,27], we examined if our proteomic data could be explained at least in part by comparable changes. We used electron microscopy of D1-like and D2-like receptors (D1R and D2R, respectively)
containing medium spiny neurons in the dorsolateral caudate to determine whether the same effects can bee seen in the MPTP monkey model and how this was modulated by L-dopa treatment. The caudate was analyzed in 6 additional macaques; controls,
untreated MPTP-intoxicated animals, and chronically L-dopa-treated MPTP-intoxicated animals that were dyskinetic (n = 2 for each group). The animals of the 3 groups have previously been characterized in depth [28]. Preembedded immunoperoxidase staining with specific D1R and D2R antibodies [28] showed a
decrease in the number of D2R-immunopositive synapses (p,0.05)
(Fig. 4A–C), in agreement with earlier observations in 6-OHDA-lesioned rodents [26], but also an increase in the number of D1
R-immunopositive synapses (p,0.05) (Fig. 4A–B). The later seems primate specific as rodents maintain their D1R-immunopositive
synapse levels unaltered after DA depletion [26]. There was no difference in the number of D1R- and D2R-immunopositive synapse
levels between control and chronically L-dopa-treated MPTP-intoxicated animals (p,0,05). Overall, these data support the notion of profound plastic alteration of the corticostriatal connection after DA depletion and L-dopa treatment and further suggest that the apparent normalization in the number of dendritic spines is actually not normalization but reflects the establishment of a different functional situation.
Glutamatergic signaling and metabolism
Of 445 identified proteins/spots, 149 could be linked to the PSD and 42 proteins more directly to synaptic transmission (Table S4). As DA is necessary for proper glutamatergic (Glu) corticostriatal signaling [24,29], MPTP-induced DA depletion and further L-dopa treatment was expected to affect proteins involved in Glu-signaling and/or Glu-metabolism. In agreement with this, proteins involved in Glu and nitrogen/urea-metabolism and signaling were affected in UPvC, APvC and CPvC (DEPPS sets 16, 17, 96, 120) (Fig. 3). Glutamate is converted toa-ketoglutarate (a-KG) through transdea-mination by glutamate dehydrogenase (GDH) and transaminase A (GOT1).a-KG metabolism was affected in parkinsonian striatum, before and after L-dopa treatment (DEPPSset17; a-KG metabolism).
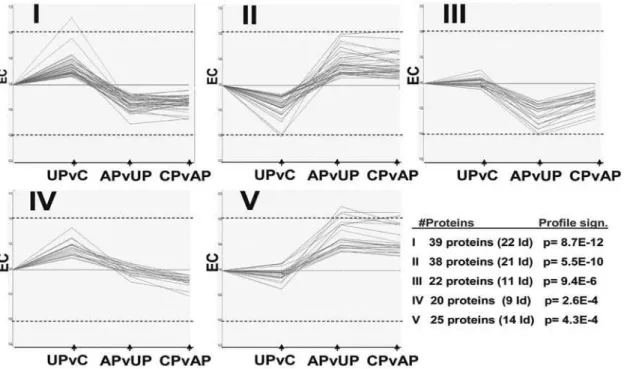
Figure 2. The five most significant STEM profiles for protein expression, their significance (rank I–V) and number of proteins identified in each profile.The Y-axis depicts expression change (EC) in relation to the controls, the maximum positive value being log2 0.75 and the minimum value being log220.75. Dashed lines depict expression changes of log2 0.5. The X-axis shows the three sequential groups whose expression changes are plotted. From left to right: Untreated PD vs controls (UPvC), acute L-dopa vs untreated PD (APvUP) and chronic L-dopa vs. acute L-dopa (CPvAP).
Table 2.Identified proteins belonging to STEM profiles I-V.1
Known PTMs1
Spot SwissProt identity Name UniProt HPRD
Profile I (clusters to profile III)
1516 UCRI_HUMAN Ubiquinol-cytochrome c reductase iron-sulfur subunit, mitochondrial -
-409 SPTA2_HUMAN Spectrin alpha chain, brain P P, C
795 KPYM_HUMAN Pyruvate kinase isozymes M1/M2 P, A A
1292 IDH3A_HUMAN Isocitrate dehydrogenase [NAD] subunit alpha, mitochondrial -
-594 HSP7C_HUMAN Heat shock cognate 71 kDa protein P P
507 HSP7C_HUMAN Heat shock cognate 71 kDa protein P P
505 HSP7C_HUMAN Heat shock cognate 71 kDa protein P P
1413 HBB_HUMAN Hemoglobin subunit beta A, G A,G,M,N
1302 G3P_HUMAN Glyceraldehyde 3 phosphate dehydrogenase P A,N,P
1050 ENOA_HUMAN Alpha-enolase A,P A,P
1046 ENOA_HUMAN Alpha-enolase A,P A,P
1184 EFTU_HUMAN Elongation factor Tu, mitochondrial - A
695 DPYL2_HUMAN Collapsin response mediator protein 2 P P
690 DPYL2_HUMAN Collapsin response mediator protein 2 P P
666 DPYL2_HUMAN Collapsin response mediator protein 2 P P
1012 ATPB_HUMAN ATP synthase subunit beta, mitochondrial A
-927 ATPA_HUMAN ATP synthase subunit alpha, mitochondrial A,P,Q
-926 ATPA_HUMAN ATP synthase subunit alpha, mitochondrial A,P,Q
-916 ATPA_HUMAN ATP synthase subunit alpha, mitochondrial A,P,Q
-1201 ACTB_HUMAN Actin beta A,M,P A,M,R
457 ACON_HUMAN Aconitate hydratase, mitochondrial A,Q
-454 ACON_HUMAN Aconitate hydratase, mitochondrial A,Q
-Profile II (cluters to profile V)
800 VIME_HUMAN Vimentin A,P C,P
527 TRFE_HUMAN Serotransferrin [Precursor] G G
812 TBAK_HUMAN Tubulin K-alpha-1 P
-809 TBAK_HUMAN Tubulin K-alpha-1 P
-709 TBAK_HUMAN Tubulin K-alpha-1 P
-1340 SIRT2_HUMAN NAD-dependent deacetylase sirtuin-2 - P
746 PP2BA_HUMAN Serine/threonine-protein phosphatase 2B catalytic subunit alpha isoform P
-559 NSF_HUMAN Vesicle-fusing ATPase -
-1356 LDHB_HUMAN L-lactate dehydrogenase B chain A,P
-1351 LDHB_HUMAN L-lactate dehydrogenase B chain A,P
-1334 LDHB_HUMAN L-lactate dehydrogenase B chain A,P
-1141 KCRB_HUMAN Creatine kinase B-type P
-1318 IDH3A_HUMAN Isocitrate dehydrogenase [NAD] subunit alpha, mitochondrial -
-442 HS90A_HUMAN Heat shock protein HSP 90-alpha P P
1414 GLO2_HUMAN Hydroxyacylglutathione hydrolase -
-711 GDIB_HUMAN Rab GDP dissociation inhibitor beta -
-355 EF2_HUMAN Elongation factor 2 D N,P,R
1152 CISY_HUMAN Citrate synthase, mitochondrial -
-1627 CALM_HUMAN Calmodulin A,M,P M,P
1142 ACTB_HUMAN Actin beta A,M,P A,M,R
1087 ACTB_HUMAN Actin beta A,M,P A,M,R
Profile III (clusters to profile I)
950 TBB2C_HUMAN Tubulin beta-2C chain -
-Especially two GDH-rich subgroups (DEPPSsets25 and 68) were altered in UPvC (Fig. 3). These effects on glutamate and a-KG metabolism indicate altered levels of TCA cycle intermediates in untreated parkinsonian (UP) and (dyskinetic) chronically L-dopa-treated parkinsonian monkeys (CP). This was further supported by UPvC and CPvC alterations in branched-chain amino acid catabolism (BCAA) proteins (DEPPSset15, 98) (Fig. 3), which uses
a-KG for valine, isoleucine and leucine degradation to produce branched-chain ketoacids (BCKA) and a large part of brain Glu [30].
Metabolism and mitochondria
A 2D-DIGE analysis on total lysate protein samples is expected being dominated by common multi-copy house keeping proteins such as cytoskeletal and metabolic enzymes. Most glycolytic and
TCA enzymes were indeed represented in our 2D-DIGE set (see Tables S4, S5), enabling a representative DEPPS analysis for the analysis of different metabolism aspects in untreated (UP) and L-dopa treated DA-depleted striatum (both AP and CP). The DEPPS analysis showed altered striatal carbohydrate metabolism proteins in UPvC, which were the least affected by acute L-dopa treatment (AP). Changes in carbohydrate metabolism proteins occurred only after chronic L-dopa treatment (CPvUP), i.e. in dyskinetic animals, although in a way that did not differ in CPvC (Fig. 3). A subset of mitochondrial proteins (DEPPSset124) were affected in UPvC, but in contrast to our earlier smaller DEPPS study [6], no effects were detected in citric acid cycle (TCA) proteins nor oxidative phosphorylation/ATP-synthesis proteins when using the larger protein data set. The tricarboxylate
Table 2.cont.
Known PTMs1
Spot SwissProt identity Name UniProt HPRD
929 SCOT_HUMAN Succinyl-CoA:3-ketoacid-coenzyme A transferase 1, mitochondrial -
-1354 MDHM_HUMAN Malate dehydrogenase, mitochondrial A,P
-1346 MDHM_HUMAN Malate dehydrogenase, mitochondrial A,P
-1363 MDHC_HUMAN Malate dehydrogenase, cytoplasmic A
-1279 IDH3A_HUMAN Isocitrate dehydrogenase [NAD] subunit alpha, mitochondrial -
-185 HS90A_HUMAN Heat shock protein HSP 90-alpha P P
1348 EF1D_HUMAN Eukaryotic translation elongation factor 1,delta A,P P
744 CH60_HUMAN 60 kDa heat shock protein, mitochondrial P A,S
572 ALBU_HUMAN Albumin G A,G
756 AINX_HUMAN Alpha-internexin P
-1369 ACTB_HUMAN Actin beta A,M,P A,M,R
1268 ACTB_HUMAN Actin beta A,M,P A,M,R
Profile IV 608 VATA1_HUMAN Vacuolar ATP synthase catalytic subunit A P
-1042 TBB2C_HUMAN Tubulin beta-2C chain -
-864 TBB2C_HUMAN Tubulin beta-2C chain -
-385 SPTA2_HUMAN Spectrin alpha chain, brain P P, C
427 NUAM_HUMAN NADH-ubiquinone oxidoreductase 75 kDa subunit, mitochondrial A
-643 NFL_HUMAN Neurofilament triplet L protein A,G,P G
1300 GIPC1_HUMAN PDZ domain-containing protein GIPC1 -
-1030 GDIB_HUMAN Rab GDP dissociation inhibitor beta -
-1303 G3P_HUMAN Glyceraldehyde 3 phosphate dehydrogenase P A,N,P
Profile V (clusters to profile II)
1216 VA0D_HUMAN Vacuolar ATP synthase subunit d P
-1374 TBB2C_HUMAN Tubulin beta-2C chain -
-873 TBA3_HUMAN Tubulin alpha-3 chain -
-1379 TBA1_HUMAN Tubulin alpha-1 chain P A,P
754 PP2BA_HUMAN Serine/threonine-protein phosphatase 2B catalytic subunit alpha isoform P
-609 HSP7C_HUMAN Heat shock cognate 71 kDa protein P P
604 GRP75_HUMAN Stress-70 protein, mitochondrial A N
710 DPYL2_HUMAN Collapsin response mediator protein 2 P P
1029 ATPB_HUMAN ATP synthase subunit beta, mitochondrial A
-1153 AATC_HUMAN Aspartate aminotransferase, cytoplasmic -
-1460 1433F_HUMAN 14-3-3 protein eta A A,P
Known post-translational modifications in listed proteins. Information taken from UniProt-database (http://www.expasy.uniprot.org/) and the Human Protein. Reference Database (HPRD; http://www.hprd.org/). A stands for acetylation, C–proteolytic cleavage, D–diphthamide, G–glycation, M–methylation, N–nitrosylation, P– phosphorylation, Q-Pyrrolidone carboxylic acid, R-ADP-Ribosylation, S-S-glutathionylation.
transport system (DEPPSset87) was altered in UPvC, indicating altered transport of citrate from mitochondria to the cytosole in untreated parkinsonian striatum (Fig. 5). The STEM profiles II and III (Fig. 2, Table 3) indicated mitochondrial protein effects after L-dopa treatment. Mitochondrial proteins DEPPSsets(sets2,
3, 124, 135, 136) were affected in APvC and APvUP and weakly in CPvC. Most DEPPS sets involved in electron transport and oxidative phosphorylation were affected after the first L-dopa treatment (APvUP, APvC) and were weakly affected after chronic L-dopa treatment in dyskinetic animals (CPvC) (Fig. 3). Other
Table 3.Gene ontology (GO) analysis for Figure 2 profile clusters I+V, and II+III.
GO for Profile I & III
Category ID Category Name #Proteins p-value*
GO:0043231 intracellular membrane-bound organelle 26.0 ,0.001
GO:0043227 membrane-bound organelle 26.0 ,0.001
GO:0044237 cellular metabolic process 30.0 ,0.001
GO:0008152 metabolic process 31.0 ,0.001
GO:0005622 intracellular 35.0 ,0.001
GO:0044424 intracellular part 35.0 ,0.001
GO:0051186 cofactor metabolic process 13.0 0.001
GO:0006732 coenzyme metabolic process 13.0 0.001
GO:0044444 cytoplasmic part 26.0 0.002
GO:0044238 primary metabolic process 29.0 0.002
GO:0005737 cytoplasm 31.0 0.002
GO:0005623 cell 35.0 0.002
GO:0044464 cell part 35.0 0.002
GO:0006091 generation of precursor metabolites and energy 13.0 0.007
GO:0009109 coenzyme catabolic process 8.0 0.008
GO:0051187 cofactor catabolic process 8.0 0.008
GO:0006099 tricarboxylic acid cycle 8.0 0.008
GO:0046356 acetyl-CoA catabolic process 8.0 0.008
GO:0006100 tricarboxylic acid cycle intermediate metabolic process 7.0 0.010
GO:0005739 mitochondrion 18.0 0.010
GO:0045333 cellular respiration 8.0 0.010
GO:0009060 aerobic respiration 8.0 0.010
GO:0043170 macromolecule metabolic process 22.0 0.011
GO:0043226 organelle 29.0 0.011
GO:0043229 intracellular organelle 29.0 0.011
GO:0006084 acetyl-CoA metabolic process 8.0 0.012
GO:0015980 energy derivation by oxidation of organic compounds 8.0 0.012
GO:0009987 cellular process 35.0 0.013
GO:0044262 cellular carbohydrate metabolic process 13.0 0.017
GO:0005975 carbohydrate metabolic process 13.0 0.020
GO for Profile II & V
Category ID Category Name #Proteins p-value
GO:0046907 intracellular transport 55 11.0
GO:0051649 establishment of cellular localization 69 12.0
GO:0051641 cellular localization 74 12.0
GO:0051179 localization 166 19.0
GO:0006810 transport 130 16.0
GO:0051234 establishment of localization 131 16.0
GO:0005622 intracellular 356 30.0
GO:0044424 intracellular part 356 30.0
GO:0044267 cellular protein metabolic process 99 13.0
GO:0044260 cellular macromolecule metabolic process 100 13.0
GO:0019538 protein metabolic process 102 13.0
mitochondrial proteins (set 53) clearly affected by L-dopa treatment were proteins related to mitochondrial protein folding and transport. Amino acid and fatty acid metabolism enzymes, many of them also involved in carbohydrate and TCA were among the most clearly affected proteinsetsboth before and after L-dopa treatment. Furthermore, amino acid and fatty acid metabolism protein effects remained in CPvC in contrast to carbohydrate and TCA metabolisms (Fig. 3).
Potential key striatal proteins in L-dopa induced dyskinesia
Moderated nested F-test statistics was used for the identification of significant key candidate proteins (F-test p,0,005, moderated t-test p,0.001). The numbers of identified key candidate proteins in the six possible pair wise comparisons were 4 (UPvC), 11 (APvUP), 14 (APvC), 9 (CPvAP), 6 (CPvC) and 10 (CPvUP) (Table 1). The CPvAP comparison is among the more interesting, listing protein expression differences between acute and chronic L-dopa treatment. The following proteins were found to be significantly altered in CPvAP: 14-3-3 protein epsilon (1 out of 7 isoforms), cytoplasmic Actin (2 out of 23 isoforms), Dynamin 1 (2 out of 8 isoforms), the PAF acetylhydrolase 30 kDa subunit (single identity), Sorcin (single identity), Tubulin alpha (1 out of 6 isoforms), and Ubiquitin carboxyl-terminal hydrolase isozyme L1 (1 out of 5 isoforms). A total of 11 proteins were significantly altered in more than a single pair wise comparison, some being affected in more than two pair wise comparisons (1 of 2 isoforms of the beta sub-unit of Electron transfer flavoprotein, 1 of 7 isoforms of Glutamate dehydrogenase 1 and the singularly identified Sorcin).
Discussion
The MPTP macaque model was used to study the morpholog-ical and proteomic effects in DA-depleted striatum with and without subsequent acute and chronic L-dopa treatment. Chronic L-dopa treatment is associated with L-dopa induced dyskinesia (LID). Although recently challenged [31], the classic priming concept posits that LID results from a progressive sensitization through repeated administrations. At odds with this classic view, the present data suggests that the DA-depleted striatum is so sensitive to a de novo acute L-dopa treatment that the first ever administration alone is able to induce rapid PTM-based proteomic changes that do not seem to be modified by chronic L-dopa treatment. More in agreement with the classical view, we notice a shift in protein expression in several metabolic pathways connected to the TCA and the mitochondrial electron transport. We here used the gold-standard model of LID and PD, the L-dopa-treated MPTP-lesioned macaque model. Although extreme-ly valuable it is not without limitations. For instance, the severity of the parkinsonian syndrome and the homogeneity of the striatal denervation [32] differ from the progressive deterioration of parkinsonian syndrome [33] and the rostro-caudal and dorso-ventral gradients observed in PD [34,35], respectively. Besides the model itself, the experimental design has its own limitations although unprecedented in term of experimental groups and power. The absence of L-dopa-treated healthy NHPs or of parkinsonian NHPs that would have discontinued L-dopa treatment in this study (e.g. a group first treated with L-DOPA then allowed to recover from treatment) limits the possibility to draw more specific conclusions regarding the direct effects of L-dopa exposure on the proteome. Furthermore, there is a difference in time between the MPTP-induced lesion and the first L-dopa dose between acute L-dopa parkinsonian animals (AP) and chronic L-dopa parkinsonian animals (CP). AP animals were untreated for
Figure 4. (A) Number of D1R- and D2R-immunopositive asymmetrical synapses in the dorsal caudate nucleus of control, untreated MPTP-lesioned and L-dopa chronically-treated MPTP-lesioned monkeys using the preembedding immunoperoxidase method. Data are expressed as the mean
6-standard deviation. Examples of D1R- (B) and D2R-immunopositive (C) asymmetrical synapses in the dorsal caudate nucleus. Stars denote presence of an asymmetrical synapse. Scale bars = 1mm
,5 months after starting MPTP exposure whereas CP animals
started L-dopa treatment after one month. Although no differences in DAT binding between AP and CP animals were seen (Fig. 1), one can not rule out possible time lag dependent differences in striatal sensitivity to DAergic stimulation [36].
A key result of this study is to confirm and extend in primates the observation of corticostriatal dendritic spine alterations. The presence of those dendritic spines is dependent on DA levels and synaptic activity [29,37–39]. Earlier studies on PD have shown alterations in corticostriatal synaptic plasticity in humans and rats [26,27,40,41]. Interestingly, DA depletion induced alterations in dendritic spines were not reflected in the overall protein expression patterns. Indeed, although post MPTP-treatment alterations in dendritic spines would predict differential expression in cytoskel-etal proteins, neither actin or microtubulin cytoskelcytoskel-etal DEPPS group effects were detected in the comparison between untreated parkinsonian and controls (UPvC; Fig. 3). Neither was there a significant STEM profile with general down or up regulation of proteins in UP animals. STEM profiles I, II and IV were weakly affected in UP animals but were not enriched in cytoskeletal
proteins (Tables 2–3), indicating that alterations in dendritic spine numbers are not detectable in 2D-DIGE run on whole lysate samples. However, the increase in D1R asymmetric synapses
between UPvC might actually negate the overall effects of the decrease in D2R asymmetric synapses (Fig. 4), possibly explaining
the absence of proteomic changes. The UPvC changes in both D1R and D2R synapses also indicates interesting PD model species
differences between rats and NHPs. 6-OHDA-lesioned rats show a general reduction in dendritic spines [26], whereas we detected both an decrease in NHP D2R dendritic spines and an increase of
D1R dendritic spines (Fig. 4). The chronic L-dopa treatment, on
the contrary, induces significant changes in proteins reported in the postsynaptic density (PSD), dendrites or axons or involved in general synaptic transmission and receptor recycling (DEPPSsets 5, 6, 7, 37, 39, 40) as were endocytosis and vesicle recycling proteins (DEPPS sets 43, 113). This strongly suggests that the apparent normalization in the number of D1R and D2R synapses
in dyskinetic animals is not normalization as such but rather a fundamentally different situation. L-dopa does not turn back the clock but leads the system to a new state.
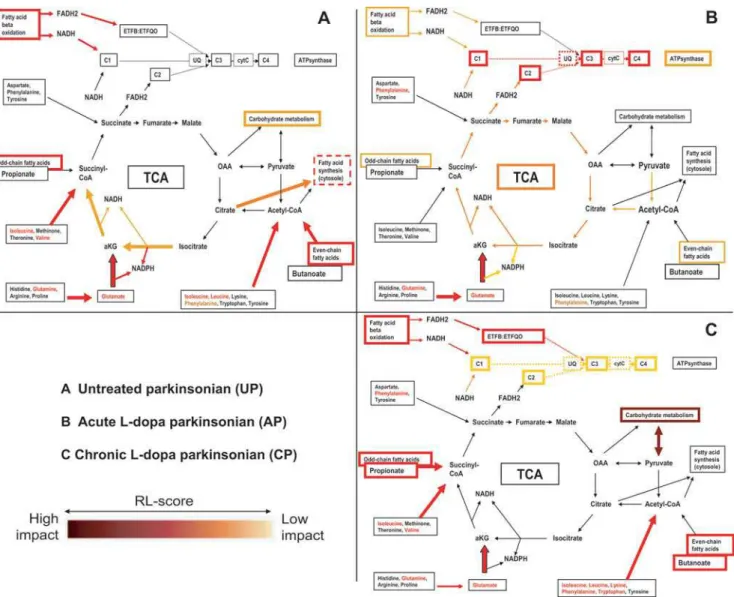
Figure 5. Visualization of DEPPS results in energy metabolism pathways. DEPPS effects are divided into three parts. (A) Untreated parkinsonian (DEPPS comparison UPvC); (B) Acute L-dopa parkinsonian (DEPPS comparisons APvUP, APvC); (C) Chronic L-dopa parkinsonian (DEPPS comparisons CPvUP, CPvC). An increasing darker red color indicates a more significant RL score with a greater impact on the metabolism pathways. OAA stands for oxaloacetate, aKG; alpha ketoglutarate, C1–C4; mitochondrial complexes I–IV, CytC; cytochrome C, UQ; Coenzyme Q.
The method of analysis itself is not without limitations. 2D-DIGE gels run on total protein lysate and resolve foremost multi-copy proteins, tissue specific or housekeeping. It is therefore remarkable that the expression of,12–14% plotted proteins is altered by the
first L-dopa dose (Fig. 2). Considering that expression changes occur only after 1h of L-dopa, we propose that the changes actually reflect changes in PTM status instead of altered protein translation. The first (de novo) L-dopa dose clearly reverses existing up or down regulation in untreated parkinsonian (UP) animals, assumingly affecting the PTM status of each protein. It is therefore most interesting that some of these PTM profiles (Fig 2. Profiles I–III, V) remain after long term L-dopa (LID), although profile V proteins are slightly attenuated towards control levels. It is indeed tempting to speculate that de-novo L-dopa induces priming effects in a DA-depleted striatum which is supersensitive to DAergic stimulation, thereby establishing long-term L-dopa related PTM patterns. A GO-analysis of the STEM profiles indicates that the putative PTM alteration patterns are related to processes involving protein transport and mitochondrial metabolism (Table 3). Analysis for PTM signatures in MSMS spectra for all identified proteins did not reveal any clear phosphorylation presence in neither STEM profile proteins (Table 2) or between groups differentially expressed proteins (Table 1), possibly due to lack of whole peptide coverage after trypsin digestion.
The STEM profiles indicate that there are L-dopa dependent PTM patterns that remain between de novo and chronic L-dopa (AP to CP). This knowledge does not easily translate itself into an understanding of the processes that cause LID. A pair-wise comparison between AP and CP animals revealed several significantly differentially expressed proteins that may be key candidates for LID (Table 1). The previously mentioned presence of numerous protein isoforms is obvious in regard to CPvAP key candidate proteins listed in table 1. Two Dynamin 1 isoforms out of eight were for instance changed between AP and CP, one isoform being upregulated and the other downregulated, indicat-ing LID dependent changes in vesicle endocytosis. We believe that proteins that can be regarded to be among the most interesting candidates for LID are the ones that are affected both in CPvAP and in other pair wise comparisons. In that respect, the calcium-binding Sorcin seems to be the top candidate as it is significantly affected in four out of six pair-wise comparisons (UPvC, APvC, CPvAP and CPvUP). Studied in rat striatum indicates that Sorcin is expressed in dendrites and dendritic spines in a subset of NMDA-R1 immunoreactive neurons [42]. As only one Sorcin protein isoform was identified, it is difficult to say if the expression changes are attributable to PTM alterations or total protein expression levels. The significant effect on Sorcin in untreated parkinsonian animals (UPvC) also indicates a role in Parkinson disease as such.
The DEPPS data shows that there are changes occurring in energy metabolism and mitochondria related proteins after L-dopa treatment. Neurons require glucose and pyruvate to maintain their pools of glutamate and aspartate [43]. Glutamate, whose associated DEPPS groups were altered in UPvC, APvC and CPvC, is formed through the reaction of BCAA anda-KG, the later also being dependent on glycolysis. The DEPPS changes in CPvC BCAA metabolism could therefore be related to the changes in carbohydrate metabolism proteins (CPvUP). Interest-ingly, although TCA proteins were unaffected in LID, there were still effects on respiratory chain proteins (Fig. 3). These effects are possibly due to changes in striatal fatty acid metabolism, considering its important contribution to respiratory chain activity and that fatty acid metabolism proteins were clearly affected in UP, AP and CP animals. Julien et al. recently reported unchanged
fatty acid profiles in the cortex of drug-naive MPTP monkeys [44]. The changes in striatal fatty acid metabolism proteins would therefore indicate brain region specificity regarding fatty acids profiles. Dyskinetic NHPs are known to exhibit changes in omega-3 and omega-6 poly-unsaturated fatty acid (PUFA) levels in cortex and adding omega-3 PUFA docosahexaenoic acid (DHA) reduces LID in MPTP-lesioned NHPs [45]. This could be in accordance with the alterations seen in long-term L-dopa fatty acid metabolism proteins. One of the subunit isoforms (ETFB) in electron transfers flavoprotein (ETF), that linksb-oxidation to the respiratory chain was significantly differentially expressed between controls and LID animals. ETF dysfunctions (OMIM#231680) affect mitochondrial fatty acid oxidation, BCAA, lysine, and choline metabolism, the effects of the first two supported by DEPPS sets in LID animals. Everything considered, it is remarkable that both STEM and DEPPS profiling show mitochondrial, metabolism and transport proteins to be overrep-resented directly after L-dopa treatment (Figs 2–3, Table 1–2). Such proteins are mainly multi-copy house keeping proteins well represented in our DIGE data and it is therefore worth noting that the STEM profiling indicates potential altered PTM patterns in these proteins which remain after chronic L-dopa. This indicates that de-novo L-dopa affects the metabolic and protein transport basis of the striatum on a long-lasting posttranslational level.
We also suggest that some of the metabolic changes are related to the increase of homocysteine (Hcy) levels known to occur after long-term L-dopa treatment [46]. It is known that elevated Hcy plasma levels are linked to inhibition in fatty acidb-oxidation [47]. Furthermore, a recent study by Zoccolella et al. on PD patients reported a correlation between increasing Hcy levels and LID [48]. An increase of Hcy can only be assumed to occur after long-term L-dopa treatment, butb-oxidation protein alteration is seen both in drug-naive and L-dopa treated PD animals. The later could indicate that L-dopa treatment is detrimental for an already deficient process and would support the hypothesis that the DA-depleted striatum is affected differently by L-dopa than a normal striatum. One difference regarding fatty acid metabolism in drug-naive and L-dopa treated PD-animals is that drug-drug-naive animals probably have an altered striatal fatty acid synthesis whereas L-dopa seems to affect mitochondrial respiratory chain activity.
To summarize, our data represent the first large-scale proteomic analysis of striatum in the NHP model of PD and LID. We present data on previously unknown NHP-specific effects in striatal synaptic plasticity after DA denervation. Our data also indicates that de-novo L-dopa treatment has priming effects on the PTM status of numerous proteins, which potentially remains modified after chronic L-dopa treatment. The protein data also shows that mitochondrial (dys)function is of importance in LID animals, involving fatty acid degradation and ketogenic amino acid metabolism. Proteins, such as Sorcin and ETFB, the later important in connecting metabolic pathways to mitochondrial metabolism, are interesting candidates for future investigation regarding PD and LID mechanisms.
Methods Animal housing
Experimental PD and LID
2 sets of animals are used in the present study. The first set of 27 female monkeys (Macaca fascicularis, SAH, Beijing, China; average age = 4.4 years, between 4–7 years; mean weight = 2.9 kg, be-tween 2.4–3.4 kg) was used for the proteomic study. Experiments were conducted according to previously published procedures and methods [8,10]. 21 monkeys received once daily i.v. injections of 1-methyl-4-phenyl 1,2,3,6-tetrahydropyridine (MPTP) hydrochlo-ride (0.2 mg/kg) until they displayed parkinsonian symptoms (mean cumulative dose of 2.44 mg/kg) [32] while 6 received vehicle only (control group). Of these 21 MPTP-lesioned animals, 10 were dosed with L-dopa (ModoparH, Roche, L-dopa/ carbidopa, ratio 4:1) twice daily (approximately for 4.5 months) and the 11 others remained untreated. The L-dopa dose was tailored to produce a full reversal of the parkinsonian condition (20–60 mg). All 10 animals exhibited L-dopa induced dyskinesia and received their final tailored dose of L-dopa one hour before death. Of the untreated 11 MPTP-lesioned animals that were kept without L-dopa administration for approximately 4.5 months, 6 received a single dose of L-dopa (ModoparH, Roche, L-dopa/ carbidopa, ratio 4:1) (50 mg) one hour before death. All animals were killed with a sodium pentobarbital overdose (150 mg/kg, i.v.). Dissection of different brain regions were performed on ice with the brain immersed in cold saline (0.9%) in less than 15 min. The striatum (combining caudate nucleus, putamen and nucleus accumbens, across the rostrocaudal extent of the structure) was dissected from each hemisphere, immediately frozen at245uC in isopentane and then stored at280uC.
The second set of 6 female monkeys (Macaca fascicularis, SAH, Beijing, China; average age = 4.1 years, between 3–5 years; mean weight = 3.4 kg, between 2.8–4.9 kg) was used for the electron microscopy analysis. Theses animals have previously been characterized in depth [28] and were renderd parkinsonian and dyskinetic according to the very same procedures described above for the ‘‘proteomic set’’ [28]. 3 groups have been used: controls, untreated MPTP-intoxicated animals, and chronically L-dopa-treated MPTP-intoxicated animals that were dyskinetic (n = 2 for each group). Animals were deeply anesthetized with sodium chloral hydrate (150 mg/kg) 1 h after the last vehicle/L-dopa dose and animals were perfused transcardially with a mixture of 2% paraformaldehyde and 0.2% glutaradehyde in phosphate buffer (PB, 0.1M) [49]. Brains were removed, bisected along the midline, stored in 2% paraformaldehyde overnight, and cut into 60mm frontal sections with vibratome (Leica, VT1000S, Wetzlar, Germany). Sections were collected in PB saline (PBS), cryopro-tected in PBS with 25% saccharose, freeze-thawed in isopentane and stored in PBS with 0.03% sodium azide until use.
Behavioural assessment
Parkinsonian condition (and its reversal) was assessed on a parkinsonian monkey rating scale using videotape recordings of monkeys as previously described [e.g. 8,10,12]. A score of 0 corresponds to a normal animal and a score above 6 to a parkinsonian animal. The severity of dyskinesia was rated using the Dyskinesia Disability Scale: 0, dyskinesia absent; 1, mild, fleeting, and rare dyskinetic postures and movements; 2, moderate, more prominent abnormal movements, but not interfering significantly with normal behavior; 3, marked, frequent and, at times, continuous dyskinesia intruding on the normal repertoire of activity; or, 4, severe, virtually continuous dyskinetic activity replacing normal behavior and disabling to the animal. Locomotor activity was concomitantly monitored with infrared activity monitors, providing a mobility count every 5 min [10].
Assessment of lesion
The extent of depletion of DA terminals in the striatum was assessed by determining binding of the DA transporter ligand (E)-N-(3-iodoprop-2-enyl)-2beta-carbomethoxy-3beta-(49 -methylphe-nyl)-nortropane (PE2I) [50] in synaptosomal membrane fractions [51,52]. Striatal tissue was weighed and homogenized in 300ml of ice-cold 0.32 M sucrose in a tapered glass tissue grinder with a Teflon pestle (clearance of the cylindrical section, 0.1–0.15 mm; Wheaton). The homogenate was then diluted 1:2 in 0.32 M sucrose and centrifuged at 1200gmaxfor 10 min. Aliquot portions
were taken from the supernatant containing the synaptosomes to determine protein concentration and DA transporter binding. Protein content was determined using the BioRad DC protein assay kit (BioRad) and the membrane sample was resuspended to a final protein concentration of 2mg/ml. 50mg protein (25ml sample) was incubated for 90 minutes at 22uC with 4nM [125I] PE2I in pH 7.4 phosphate buffer (NaH2PO4 10.14 mM, NaCl
137 mM, KCl 2.7 mM, KH2PO41.76 mM) made up to a total of
200ml volume. Non-specific binding was measured in the presence of 100mM Mazindol (Sigma). Uptake was stopped by the addition of 5 ml of ice-cold phosphate buffer and immediate filtration through a Whatman GF/B glass-fiber filter presoaked in 0.05% polyethylenimine. Filters were transferred to scintillation vials and the radioactivity was measured in a gamma counter (Cobra 5010, Packard). For each animal, three samples were used for total binding and one for non-specific binding. Non-specific binding per animal was subtracted from corresponding total samples to obtain specific binding. The average specific binding per animal was then calculated and normalized to the mean binding observed in the control animals.
Immunoperoxidase experiments and electron microscopy
Immunohisotchemistry for D1R, detected using a monoclonal
antibody raised in rat against a 97 amino acid sequence corresponding to the C-terminus of the human D1R (Sigma; St Louis, MO) [53,54] and for D2R using an affinity-purified rabbit
polyclonal antiserum directed against a 28 amino acid sequence within the third cytoplasmic loop from the human D2R
corresponding to anti D2-284 peptide (Chemicon International,
Temecula, CA) [55] was performed as previously described [28]. Sections were incubated in 4% normal goat serum (NGS) for 30 min and then in D1R (1:1000) or D2R (1:500) antibody
supplemented with 1% NGS overnight at room temperature (RT). After thorough washing, sections were incubated for 90 min at RT in biotinylated goat anti-rat or rabbit IgG (1:200 in PBS, Amersham, UK). After rinsing, Avidin-biotin peroxidase (1:200 in PBS, Vectastain Elite ABC kit, Vector laboratories, Burlingame, CA) for 90 min at RT. Peroxidase activity was revealed with 3,39 -diaminobenzidine (DAB; 0.05% in Tris buffer, pH 7.6) in the presence of hydrogen peroxide (0.01%). The reaction was stopped with several washes in Tris buffer, and stored in this buffer before processing for EM. Negative immunohistological control demon-strated the absence of signal when omitting the first antibody.
The sections were rinsed, post-fixed in 0.25% osmium tetroxide and dehydrated in ascending series of ethanol dilutions that also included 70% ethanol containing 1% uranyl acetate. They were then treated with propylene oxide, impregnated in resin overnight (Durcupan ACM; Fluka, Buchs, Switzerland), mounted on glass slides and cured at 60uC for 48 h. Areas of interest (dorsolateral caudate) were cut out from the sections and glued to blank cylinders of resin. Ultrathin sections were collected on pioloform-coated single slot copper grids. The analysis of the distribution of D1R and D2
images obtained with a computer linked directly to CCD camera on the Tecnai 20 EM (Philips) electron microscope at a final magnification of 2500 to 6000 using the Metamorph software (version 4.6r5, Universal Imaging, Paris, France). A mean of 100 fields of 150mm2was counted for each individual.
2D-DIGE protein sample preparation
Each frozen striatum was taken directly from the freezer, put in an eppendorf-tube, and rapidly homogenized in a 4:1 (v/w) ratio of lysis buffer containing 8 M urea, 4% 3-[(3-Cholamidopropyl)-Dimethyl-Ammonio]-1-Propanesulfonate (CHAPS), 70 mM di-thiothreitol (DTT), 5% immobilized pH gradient (IPG) buffer pH 3–10, using a sonicator. The sonication was performed on ice (to avoid carbamylation of the proteins) in pulses for 10 seconds (Fisher Bioblock scientific), followed by ultracentrifugation for 1 hour at 100 0006g (Beckman Optima, Beckman). Supernatants were collected and cleaned from lipids and nucleic acids using the 2D Clean-up Kit (GE Healthcare, Uppsala, Sweden), according to the manufacturer’s instructions. The total protein concentration of each sample was determined in triplicate using the 2D Quant Kit (GE Healthcare) in accordance with the manufacturer’s protocol. The whole procedure was performed on ice whenever possible to minimize protease activity.
2D-DIGE analysis
For 2D-DIGE 50mg protein each of control, treated, and pooled protein sample was labelled with cyanine dye Cy5 or Cy3 and Cy2, respectively, according to the manufacturer’s descrip-tions for CyDye DIGE Fluor minimal dyes (GE Healthcare). The pooled sample was a mixture of equal amounts of protein from all samples in the experiment. The 2D-DIGE experimental design has previously been described [6]. As there were 27 individuals in the experiment, a total of 14 analytical 2D-DIGE gels were run, the 14:th gel containing a technical replicate from the control group. Before the first-dimension isoelectric focusing (IEF), a
50-mg aliquot from each of the three labeling mixes (see above) was combined with DeStreak rehydration buffer and 0.5% (v/v) Pharmalytes (GE Healthcare) that covered the pH interval (pH 3– 11 NL) of the IPG strips, to give a final volume of 450mL. Gel rehydration of the 24-cm IPG strips (GE Healthcare) with the
450-mL rehydration buffer (including the protein sample), was performed at room temperature in the dark for 12 hr according to the manufacturer’s instructions. IEF was run on an IPGPhor (GE Healthcare) at 500 V for 1 hr, at 1 kV for 1 hr, and at 8 kV until a total of 64 kVh was reached. After IEF, the strips were equilibrated for 2615 min by gentle shaking in a buffer containing
50 mM Tris-HCl (pH 6.8), 6 M urea, and 2% sodium dodecyl sulfate (SDS), supplemented with 2% DTT in the first equilibra-tion step and 2.5% iodoacetamide in the second. For the second dimension SDS-polyacrylamide gel electrophoresis (SDS-PAGE), the equilibrated strips were put on top of large format 12.5% polyacrylamide gels and were run using an Ettan DALTsix large-format vertical system (GE Healthcare). All gels were run at 5 W for 45 min before increasing to 11 W per gel until the bromophenol blue dye front had reached the bottom of the gel. The temperature was kept constant at 27uC. The gels were then subjected to image analysis. All gels were scanned using a Typhoon 9400 (GE Healthcare) at 100mm resolution. The images were analyzed using the DeCyder software suite (GE Healthcare, version 5.02). All 1463 images were loaded into the DeCyder Batch processor, and the program was set to find 3000 spots in each image then filter away artefacts and finally to do a primary matching between all the different gel images. The resulting files were then loaded into the BVA module for further
image analysis. All spots were manually compared between the different gels to minimize false spot matching. The gel with the largest number of spots identified was used as the master gel. When needed, spots were merged to better match against the spots in the master gel. Volume data and coordinate data for each spot was exported for further analysis.
Spot picking
Analytical 2D-DIGE gels that use 3650-mg CyDye labelled proteins aliquots do not provide large quantities of protein making MS based identification difficult. We previously picked spots manually from normal Coomassie stained two-dimensional electrophoresis (2-DE) gels which were loaded with 500mg protein [6]. This had the drawback of requiring manual matching between spot patterns in the analytical 2D-DIGE gels and the preparative 2-DE gels. To increase the number of identified spots and to improve the association of identities to a given spots, two additional ‘‘preparative’’ 2D-DIGE gels with additional 250mg unlabelled protein added to the 3650-mg CyDye aliquots were run for spot picking purposes.
MS/MS analysis
We previously reported methodology applications on the use of 221 manually picked, identified and annotated 2D-DIGE spots/ proteins from the same experiment as reported here [6]. To increase this data set, we used the Ettan spot picker (GE Healthcare) to randomly pick additional 4696 spots from two
containing all proteins identified in the study (Table S1). All the identified phosphorylations have been manually confirmed.
2D-DIGE normalization and effect estimation
Normalization and effect estimation of the 2D-DIGE data was done as previously described [6]. The gel images were normalized using the ‘SC-2D+quantile’ method as to both remove spatial localization bias and differences in mean signal intensities between gels. Using gel 4 as master gel generated 1849 spots. Manual analysis of DeCyder-based spot matching between gels and effect estimations resulted in a dataset of 1211 spots. The proteomic data from the control group and the three treatment groups were analyzed in 6 different pair wise comparisons. They were: controls (C) compared to MPTP-lesioned (UP) animals (UPvC), UP animals compared to MPTP-lesioned animals with one L-dopa (AP) treatment (APvUP), AP animals compared to MPTP-lesioned animals with long term L-dopa (CP) treatment (CPvAP), C animals compared to AP animals (APvC), C animals compared to CP animals (CPvC) and UP animals compared to CP animals (CPvUP).
The statistical analysis for each spot/proteinpwas based on the log2-intensites. The gels were treated as blocks in a linear model, so that effects were estimated within gels where possible. A mixed model was set up with gel as random factor and dye as fixed factor in order to account for differences between the channels Cy5, Cy3 and Cy2 and fixed effects for the four treatment states (C, UP, AP and CP). The pool channel (Cy2) samples were consequently assumed to contain 6/27 C-samples, 5/27 UP-samples, 6/27 AP-samples and 10/27 CP-AP-samples. After the ‘SC-2D+quantile’ normalization, the six comparisons (or effects) of interest were estimated by the least squares method using the lmFit() Limma function [57] The correlation between the spots of the three dyes within each gel was first estimated using the Limma dupcor() function [58]. To test for differences between the expression levels in the treatment groups we calculated lodsratios for each proteinp and effectlfor the effectsUPvC,APvUP,CPvAP,CPvC,CPvUPand APvCusing eBayes() in Limma, [57,59].
Expression profile analysis
The expression of all protein spots (1211) were plotted using Short-Time Series Expression Miner (STEM) [7] (Table S6). STEM is based on the comparison between groups that are sequential to each other, such as dose-response or time dependent data. The four treatment groups in our study can be considered to be sequential to each other enabling three comparisons for STEM analysis: UPvC, APvUP, CPvAP. Out of 476 identified proteins, 445 were present among the 1211 estimated spots on the master gel. To correlate expression profiles to gene ontology analysis [60], special GO-annotation was needed. 2-DE data, in comparison to other proteomics techniques, is valuable insofar that it enables the analysis of protein isoforms. In any 2-DE dataset, many proteins are present in multiple isoforms. Assuming slight functional differences between each isoform for a given protein within a given GO-annotation, a GO-set incorporating each isoform (designated as Id1_a, Id1_b, and Id1_c… Id1_n for known spot/protein identity Id1) was created for 442 out of 445 proteins (Table S7). Multiple testing in STEM model profiling was done using Bonferroni correction with a significance level of 0,05. The significance of STEM profiles are calculated by comparing the number of proteins assigned the number of proteins expected by a permutation test (50 being the default value) and the profiles p-value. STEM parameters differing from default values were the following: ‘‘No normalization/add 0’’; ‘‘Filtering Minimum absolute expression change = 0,20’’; ‘‘Cluster profile Minimum correlation = 0,75’’. For the STEM GO analysis, all electronically
inferred annotations (IEA) were excluded, minimum hierarchical GO level was set to 2 and the minimum number of proteins used for GO enrichment was 5. Multiple hypothesis correction for actual size based GO enrichment analysis was performed using 10000 randomized samples. The maximum number of STEM model profiles was set to 98 as that was the maximum of possible profiles in our data set as determined by the above defined parameters. Significantly expressed key proteins were analyzed using moderated nested F-test statistics{Smyth, 2004#57} on all possible pair wise comparisons (UPvC, APvUP, CPvAP, APvC, CPvC, CPvUP) in the whole (1211) dataset. The F-test can be used to classify proteins that are differentially expressed under two or more conditions. Proteins were considered as potential key proteins if F-test p,0,005 and the moderated t-test p-value in pair wise comparisons p,0.001.
DEPPS analysis
The DEPPS methodology uses the complete ranking lists of spots/ proteins detected in 2D-DIGE experiments for the purpose of finding general proteomic trends and not become restricted to proteins above arbitrarily defined cut-off and/or fold change thresholds. DEPPS sets classification was done as previously described [6] some modifications. The previous DEPPS analysis was based solely on lodsratio-derived ranking for all the spots in each setof interest. This approach is sensitive to proteins exhibiting large lodsratios, causing DEPPSsetscontaining such proteins to generally rank higher. To get a more conservative DEPPSsetsestimation, we modified the DEPPS analysis by calculating both lodsratio based and consecutive-based ranking. Furthermore, all sets containing less than 5 proteins and/or fewer than 3 unique identities were discarded. A p-value for each proteinsetwas assessed by comparing the results from the true comparison to those from 10000 permutations.Sets with the same p-value were assigned the same ranking number. The ranking numbers for each DEPPS set was then added together and the mean calculated resulting in DEPPS-scores were lower values indicates greater effects.
Supporting Information
Table S1 Protein identities and identified PTMs
Found at: doi:10.1371/journal.pone.0001589.s001 (1.22 MB XLS)
Table S2 GO-tables for STEM profiles I-V
Found at: doi:10.1371/journal.pone.0001589.s002 (0.02 MB XLS)
Table S3 DEPPS scores for all DEPPS sets
Found at: doi:10.1371/journal.pone.0001589.s003 (0.09 MB XLS)
Table S4 Manually annotated DEPPS sets
Found at: doi:10.1371/journal.pone.0001589.s004 (0.54 MB XLS)
Table S5 GSEA derived DEPPS sets
Found at: doi:10.1371/journal.pone.0001589.s005 (0.78 MB XLS)
Table S6 Normalized data used for STEM expression analysis Found at: doi:10.1371/journal.pone.0001589.s006 (0.17 MB XLS)
Table S7 Isoform adapted Gene ontology (GO) annotation used in STEM analysis