with Intensive Planting of Bt Cotton in China
Haonan Zhang1,2, Wei Yin1,2, Jing Zhao1,2, Lin Jin1,2, Yihua Yang1,2, Shuwen Wu1,2, Bruce E. Tabashnik3, Yidong Wu1,2*
1College of Plant Protection, Nanjing Agricultural University, Nanjing, China,2Key Laboratory of Integrated Management of Crop Diseases and Pests (Nanjing Agricultural University), Ministry of Education, Nanjing, China,3Department of Entomology, University of Arizona, Tucson, Arizona, United States of America
Abstract
Transgenic crops producingBacillus thuringiensis(Bt) toxins kill some key insect pests, but evolution of resistance by pests can reduce their efficacy. The predominant strategy for delaying pest resistance to Bt crops requires refuges of non-Bt host plants to promote survival of susceptible pests. To delay pest resistance to transgenic cotton producing Bt toxin Cry1Ac, farmers in the United States and Australia planted refuges of non-Bt cotton, while farmers in China have relied on ‘‘natural’’ refuges of non-Bt host plants other than cotton. Here we report data from a 2010 survey showing field-evolved resistance to Cry1Ac of the major target pest, cotton bollworm (Helicoverpa armigera), in northern China. Laboratory bioassay results show that susceptibility to Cry1Ac was significantly lower in 13 field populations from northern China, where Bt cotton has been planted intensively, than in two populations from sites in northwestern China where exposure to Bt cotton has been limited. Susceptibility to Bt toxin Cry2Ab did not differ between northern and northwestern China, demonstrating that resistance to Cry1Ac did not cause cross-resistance to Cry2Ab, and implying that resistance to Cry1Ac in northern China is a specific adaptation caused by exposure to this toxin in Bt cotton. Despite the resistance detected in laboratory bioassays, control failures of Bt cotton have not been reported in China. This early warning may spur proactive countermeasures, including a switch to transgenic cotton producing two or more toxins distinct from Cry1A toxins.
Citation:Zhang H, Yin W, Zhao J, Jin L, Yang Y, et al. (2011) Early Warning of Cotton Bollworm Resistance Associated with Intensive Planting of Bt Cotton in China. PLoS ONE 6(8): e22874. doi:10.1371/journal.pone.0022874
Editor:Guy Smagghe, Ghent University, Belgium
ReceivedApril 20, 2011;AcceptedJune 30, 2011;PublishedAugust 9, 2011
Copyright:ß2011 Zhang et al. This is an open-access article distributed under the terms of the Creative Commons Attribution License, which permits unrestricted use, distribution, and reproduction in any medium, provided the original author and source are credited.
Funding:This work was supported by grants 2007CB109204, 2008ZX08011-02, and 2008ZX08012-04 from the Ministry of Science and Technology of China, a project funded by the Priority Academic Program Development of Jiangsu Higher Education Institutions (PAPD), and 2008-35302-0390 from the U.S. Department of Agriculture-Agriculture and Food Research Initiative. The funders had no role in study design, data collection and analysis, decision to publish, or preparation of the manuscript.
Competing Interests:B.E. Tabashnik has received support for research that is not related to this publication from the following sources: Cotton Foundation, Cotton Inc., National Cotton Council, Monsanto, and Dow AgroSciences. He is also a coauthor of a patent application on engineering modified Bt toxins to counter pest resistance, which is related to research described by Soberon et al. (2007, Science 318: 1640-1642). This does not alter the authors’ adherence to all the PLoS ONE policies on sharing data and materials, as detailed online in the guide for authors.
* E-mail: [email protected]
Introduction
The toxins produced byBacillus thuringiensis(Bt) kill some major insect pests, but cause little or no harm to vertebrates and most other organisms [1]. Bt toxins have been used in sprays for decades and in transgenic plants since 1996 [2]. Transgenic corn and cotton producing Bt toxins grew on more than 50 million hectares worldwide in 2009 [3]. Benefits of Bt crops can include reduced use of conventional insecticides, regional pest suppression, increased yield, and increased profit [4–8]. The primary threat to the long-term efficacy of Bt toxins is evolution of resistance by pests, which entails a genetically based decrease in their susceptibility [9–12]. Many insects have been selected for resistance to Bt toxins in the laboratory, and some populations of at least six crop pests have evolved resistance to Bt toxins outside of the laboratory, including two species with resistance to Bt sprays and four species with resistance to Bt crops [12–14].
The main strategy for delaying pest resistance to Bt crops promotes survival of susceptible insects with ‘‘refuges’’ of host plants that do not produce Bt toxins [10,15]. Ideally, most of the rare resistant insects emerging from Bt crops will mate with the
relatively abundant susceptible insects from nearby refuges. If the dose of Bt toxin ingested by larvae is high enough to kill all or nearly all of the hybrid progeny produced by matings between susceptible and resistant insects, refuges are expected to be particularly effective for delaying evolution of resistance [10,15]. Retrospective evaluations of global resistance monitoring data suggest that refuges have delayed pest resistance to Bt crops, especially when the plants have met the ‘‘high dose’’ criterion and refuges have been abundant [12,16]. In the United States and Australia, farmers were required to plant refuges of non-Bt cotton near first-generation Bt cotton that produced Bt toxin Cry1Ac [12,17]. In both of these countries, Bt cotton producing only Cry1Ac is no longer grown and has been replaced largely by Bt cotton that produces two toxins, primarily Cry1Ac and Cry2Ab [12,17].
In China, Bt cotton producing Cry1Ac was commercialized 1997 and has been effective against the cotton bollworm,
maintained [19], which increases the risk of resistance [10,15]. In addition, unlike the situation in the United States and Australia, refuges of non-Bt cotton have not been required in China and Bt cotton producing Cry1Ac has not been replaced by two-toxin cotton [8,19]. The lack of a requirement for non-Bt cotton refuges in China is based on the idea that the abundant non-Bt host plants ofH. armigeraother than cotton provide sufficient refuges to delay resistance [18–20]. Several monitoring studies have evaluated the success of the so-called ‘‘natural’’ refuge approach in China. While most previous reports have emphasized sustained susceptibility [18,21–23], some data from populations sampled as recently as 2009 suggest that susceptibility to Cry1Ac may have decreased in certain limited areas [24–27].
Here we compared susceptibility ofH. armigerato Cry1Ac and Cry2Ab in 2010 between 13 populations from five provinces of northern China, where Bt cotton has been planted intensively, with two populations from the Xinjiang Uygur Autonomous Region (Xinjiang) of northwestern China, where Bt cotton has not been planted intensively. The area sometimes referred to as northern China, which includes the Changjiang River Valley and the Yellow River Valley, accounts for most of China’s cotton [8,28]. In six of the provinces of northern China considered together, the percentage of cotton planted to Bt cotton increased from 11% in 1998 to 50% in 2000 and 91% in 2004, with 100% Bt cotton in some provinces by 2004 [8]. In contrast, Bt cotton has not been planted intensively in most areas of northwestern China, which accounts for about a third of China’s cotton production [26]. A 2009 survey of eight locations in northwestern China where Bt cotton had not been planted showed no significant
variation in susceptibility to Cry1Ac [29]. We collected and tested
H. armigerafrom two sites in northwestern China in 2010: Shawan, where no Bt cotton has been planted; and Shache, where Bt cotton was first planted in 2002 and the mean percentage of cotton planted to Bt cotton from 2002 to 2009 was 5.6% (range = 0 to 11%) [26]. We used the two field populations from northwestern China and a susceptible laboratory population as susceptible standards for comparison with 13 field populations from northern China. The results show that populations of H. armigera from northern China have evolved resistance to Cry1Ac but not to Cry2Ab.
Results
Resistance to Cry1Ac
Analyses of three sets of parameters from laboratory bioassays show significant resistance to Cry1Ac in populations ofH. armigera
from northern China, where Bt cotton producing Cry1Ac was planted intensively, compared with populations from two sites in northwestern China where Bt cotton was not planted intensively (Figs. 1 and 2, Tables 1, S1 and S2). The three parameter sets are: the concentration of Cry1Ac activated toxin killing 50% of larvae (LC50), the LC50of Cry1Ac protoxin, and survival at a diagnostic concentration of Cry1Ac activated toxin. In the results of our experiments summarized below, all units for concentration are ng Bt toxin or ng Bt protoxin per cm2diet.
LC50values for Cry1Ac activated toxin and protoxin. For Cry1Ac activated toxin, the median LC50was 2.8 times higher for the 13 populations from northern China (52) compared with the
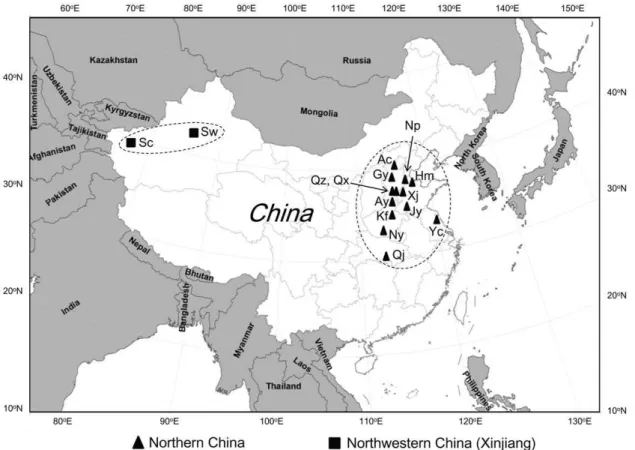
Figure 1. Sampling locations of H. armigera field populations from China. Northern China: Ac = Anci, Ay = Anyang, Gy = Gaoyang, Hm = Huimin, Jy = Juye, Kf = Kaifeng, Np = Nanpi, Ny = Nanyang, Qj = Qianjiang, Qx = Qiuxian, Qz = Quzhou, Xj = Xiajin, Yc = Yancheng. Northwestern China: Sc = Shache, Sw = Shawan.
median for the two populations from northwestern China (18.5) (Mann-Whitney U-test, U = 26, 1-tailed P = 0.0095) (Fig. 2, Table S1). The Shawan population from northwestern China, which had
no exposure to Bt cotton, had the lowest LC50(13) (Fig. 2, Table S1). We calculated the resistance ratio (RR) as the LC50 for a population divided by the LC50 of Shawan. For the 14 field
Figure 2. Responses to Cry1Ac activated toxin, Cry1Ac protoxin and Cry2Ab protoxin byH. armigerafield populations sampled in 2010 from northern China (
N
) and northwestern China (#); and by SCD (g), a susceptible laboratory strain.LC50: concentration killing50% of larvae tested with 95% fiducial limits. Resistance ratio: LC50divided by the LC50of the susceptible Shawan population. Asterisks indicate LC50 values significantly greater than the LC50values of all three susceptible populations (SCD, Sc, and Sw).
populations other than Shawan, the RR ranged from 1.8 for the Shache population from northwestern China, which had limited exposure to Bt cotton, to 16 for the Anyang population from northern China (Fig. 2, Table S1).
We used the conservative criterion of non-overlap of 95% fiducial limits to assess differences in LC50 for pairwise comparisons between populations. By this criterion, the LC50 values did not differ significantly between Shawan and Shache from northwestern China, or between either of the two field populations from northwestern China and the susceptible SCD laboratory strain, which had no exposure to Bt toxins (Fig. 2, Table S1). However, the LC50 value of Cry1Ac activated toxin was significantly greater for 4 of the 13 populations from northern China (Gaoyang, Nanyang, Xiajin, and Anyang) than for each of the three susceptible populations (Shawan, Shache, and SCD; Fig. 2, Table S1).
Like the results for Cry1Ac activated toxin summarized above, the data for Cry1Ac protoxin indicate resistance of populations from northern China relative to those from northwestern China. For Cry1Ac protoxin, the median LC50was 3.0 times higher for the 13 populations from northern China (80) compared with the median for the two populations from northwestern China (26.5) (Mann-Whitney U-test, U = 22.5, 1-tailed P = 0.057) (Fig. 2, Table S2). As with Cry1Ac activated toxin, Shawan had the lowest LC50 of Cry1Ac protoxin. For the 14 field populations other than Shawan, the resistance ratio for Cry1Ac protoxin ranged from 1.0 for Anci from northern China to 10 for Anyang from northern China (Fig. 2, Table S2). The LC50value of Cry1Ac protoxin was significantly greater for 6 of the 13 populations from northern China (Qianjang, Gaoyang, Yancheng, Nanyang, Xiajin, and Anyang) than for each of the three susceptible populations (Shawan, Shache, and SCD) (Fig. 2, Table S2). Across the 15
field populations tested, the LC50 values for Cry1Ac activated toxin and Cry1Ac protoxin were positively correlated (Spearman’s rs= 0.86, df = 13, one-tailed P = 0.000019).
Survival at a diagnostic concentration of Cry1Ac. We used a high diagnostic concentration (1000 ng/cm2), which is 5.3 times the LC99(190 ng/cm2) and slightly higher than the LC99.99 of the susceptible Shawan population. We chose this concentration because it was likely to kill virtually all susceptible larvae and thus provide a conservative method for detecting resistance. Also, we used this concentration previously to test the Anyang population in 2005 [30].
Survival at the diagnostic concentration was significantly higher for the 13 populations from northern China pooled (1.3%, 147 of 11,064) than for the two populations from northwestern China pooled (0%, 0 of 1296) (Table 1, Chi-squared = 18.5, df = 1, one-tailed P,0.0001). Collectively, the three susceptible populations (Shawan, Shache and SCD) had no survival at the diagnostic concentration (0 of 1464). The Anyang population, which had the highest LC50 values for Cry1Ac activated toxin and Cry1Ac protoxin, also had the highest survival at the diagnostic concentration (2.6%, 33 of 1248). In addition, survival at the diagnostic concentration for Anyang in 2010 was more than double the survival for Anyang in 2005 [30] (1.2%, 123 of 9984) (Chi-squared = 16.1, df = 1, one-tailed P,0.0001). Across the 15 field populations tested, survival at the diagnostic concentration and the LC50of Cry1Ac activated toxin were positively correlated (Spearman’s rs= 0.66, df = 13, one-tailed P = 0.004).
Susceptibility to Cry2Ab
In contrast to the results for Cry1Ac described above, the data for Cry2Ab show no significant resistance to this toxin overall in northern China relative to northwestern China. The median LC50
Table 1.Survival at a diagnostic concentration of Cry1Ac activated toxin ofH. armigerapopulations sampled in 2010 from northern China (N) and northwestern China (NW).
Location Province Region Number collected Diagnostic concentration
na Survival (%)
SCDb 168 0.0
Shawan (Sw) Xinjiang NW 134 1008 0.0
Shache (Sc) Xinjiang NW 104 288 0.0
Quzhou (Qz) Hebei N (YR)c 100 768 0.0
Kaifeng (Kf) Henan N (YR) 125 48 0.0
Huimin (Hm) Shandong N (YR) 183 1008 0.8
Anci (Ac) Hebei N (YR) 136 1248 1.6
Juye (Jy) Shandong N (YR) 117 648 0.0
Nanpi (Np) Hebei N (YR) 237 1848 2.2
Qianjiang (Qj) Hubei N (CR)d 457 528 0.0
Gaoyang (Gy) Hebei N (YR) 87 48 0.0
Qiuxian (Qx) Hebei N (YR) 290 888 0.2
Yancheng (Yc) Jiangsu N (CR) 352 1008 0.4
Nanyang (Ny) Henan N (CR) 150 648 1.7
Xiajin (Xj) Shandong N (YR) 168 1128 2.5
Anyang (Ay) Henan N (YR) 300 1248 2.6
aNumber of F
1larvae tested at the diagnostic concentration (1000 ng/cm2). bSusceptible strain from Cote D’Ivoire (see Methods).
cNorthern China (Yellow River Valley). dNorthern China (Changjiang River Valley).
of Cry2Ab protoxin (ng/cm2) was not significantly higher for the 13 populations from northern China (83.5) compared with the two populations from northwestern China (55) (Mann-Whitney U-test, U = 16, 1-tailed P = 0.27) (Fig. 2, Table S3). Also, unlike the results with Cry1Ac, the lowest LC50 for Cry2Ab was for the Kaifeng population from northern China, rather than for the Shawan population (Fig. 2, Table S3). Indeed, the LC50of Cry2Ab was significantly lower for Kaifeng than for Shawan (Fig. 2, Table S3). For Cry2Ab, none of the 13 field populations from northern China had a significantly higher LC50 value than each of the three susceptible populations (Shawan, Shache, and SCD) (Fig. 2, Table S3). In addition, the LC50of Cry2Ab was essentially identical for the susceptible laboratory strain (SCD) and Anci, the least susceptible field population (Fig. 2, Table S3).
Across the 14 field populations tested with Cry2Ab, the LC50of Cry2Ab was not significantly correlated with either the LC50of Cry1Ac activated toxin or Cry1Ac protoxin (Spearman’s rs= 0.13 for activated toxin and20.25 for Cry1Ac protoxin, df = 12, P.0.3 in both cases). The lack of a significant positive correlation between responses to Cry2Ab and Cry1Ac indicates that resistance to Cry1Ac did not cause cross-resistance to Cry2Ab.
Discussion
The results reported here from three different sets of bioassay parameters show that susceptibility to Bt toxin Cry1Ac was significantly lower in 13 populations from northern China than in two populations from northwestern China. The simplest explana-tion for these data is that intensive planting of Bt cotton producing Cry1Ac selected for resistance to Cry1Ac in northern China, whereas limited planting of Bt cotton caused little or no selection for resistance in the two populations from northwestern China.
An alternative hypothesis is that the difference between northern and northwestern China reflects natural geographic variation in susceptibility to Cry1Ac. This hypothesis is refuted by baseline data from 1994 to 1997, before Bt cotton was planted widely in China, showing that susceptibility to Cry1Ac was not lower in northern China than in northwestern China [31]. In particular, our analysis of the baseline data (units are micrograms Cry1Ac per ml diet) shows no significant difference in median LC50between 14 populations from northern China (1.2) and five populations from northwestern China (0.74) (Mann-Whitney U-test, U = 47, one-tailed P = 0.15). Unexpectedly, the baseline data show that the median concentration of Cry1Ac inhibiting development to third instar in 50% of larvae (IC50) was significantly lower for northern China (0.024) than for northwest-ern China (0.049) (Mann-Whitney U-test, U = 63, two-tailed P = 0.00036). This difference is in the opposite direction predicted by the natural variation hypothesis and thus cannot account for the decreased susceptibility to Cry1Ac in northern China relative to northwestern China detected in our 2010 monitoring.
A second line of evidence supporting the conclusion that intensive planting of Bt cotton producing Cry1Ac in northern China caused resistance is that susceptibility to Cry1Ac was significantly lower in northern China than in northwestern China in 2010, whereas no difference in susceptibility to Cry2Ab was detected in 2010 between northern China and northwestern China. These results imply that the decreased susceptibility to Cry1Ac is a specific adaptation to Bt cotton producing Cry1Ac, rather than a general difference between regions in susceptibility to Bt toxins.
A third line of evidence supporting the conclusion that intensive planting of Bt cotton producing Cry1Ac in northern China caused resistance is the significant increase in survival at the diagnostic
concentration detected for Anyang in 2010 (2.6%) versus 2005 (1.2%) [30]. Among the 15 populations tested here, Anyang was the most resistant to Cry1Ac based on LC50values and survival at the diagnostic concentration (Fig. 2, Tables 1, S1 and S2). Bt cotton has been planted in Anyang since 1997 and it first exceeded 90% of the total cotton area in 2001 [30].
Although the data reported here may constitute the strongest and most widespread evidence of field-evolved resistance to Cry1Ac in China, they are not the first. For example, based on F2 screens, Liu et al. [27] reported that the frequency of alleles conferring resistance to Cry1Ac rose 12-fold from 1999 to 2007 in the Qiuxian area of the province of Hebei in northern China. By itself, this increased frequency over time was considered ambiguous evidence of resistance because the tests in 1999 used Bt cotton plants, while tests in 2007 used Bt cotton leaves [12]. Liu et al. [27] also reported that the Qiuxian population sampled in 2007 had a Cry1Ac resistance ratio of 11, but this was based on comparison with a susceptible lab strain that was tested in a separate study.
From our bioassay results, the resistance ratios for the Qiuxian population sampled in 2010 relative to the susceptible Shawan population are 4.8 for Cry1Ac activated toxin and 2.6 for Cry1Ac protoxin (Fig. 2, Tables S1 and S2). Our 2010 results for Qiuxian also show a 0.2% survival at the diagnostic concentration of Cry1Ac (Table 1). Our results do not show significant increases in the LC50 of Cry1Ac or in the percentage of survivors at the diagnostic concentration for Qiuxian compared with Shawan. Nonetheless, including the previously reported data from 2007 [27] and our data from 2010 (Fig. 2, Tables S1 and S2), all evidence from Qiuxian based on five different parameters is consistent with the hypothesis of field-evolved resistance (resistance allele frequency and LC50in 2007, two LC50values in 2010, and survival at a diagnostic concentration in 2010; sign test, one-tailed P = 0.031).
In addition, while our main focus here is the contrast between northern and northwestern China, some recent evidence suggests that variation in susceptibility to Cry1Ac is associated with variation in the intensity of Bt cotton planting within each of these regions. Within northern China, Bt cotton planting is more intensive in Xiajin than in Anci [24,25]. From 1998 to 2008, the mean percentage of totalH. armigerahost plant area accounted for by Bt cotton was 8.5 times higher in Xiajin (62%) than in Anci (7.3%) [24,25]. Based on survival and mean relative average developmental rating (RADR), susceptibility to Cry1Ac was significantly lower for Xiajin than Anci in 2008 and 2009, which reflects the higher Bt cotton planting intensity in Xiajin [24,25,32]. Consistent with this conclusion, our results from 2010 show that susceptibility to Cry1Ac was significantly lower for Xiajin than Anci, based on the LC50values for both Cry1Ac activated toxin and protoxin (Fig. 2, Tables S1 and S2).
monitoring data from at least seven studies based on the following comparisons: northern versus northwestern China (this study), Anci versus Xiajin in northern China [24, 25, 31, and this study], Korla versus Shache in northwestern China [26], and changes over time in northern China at both Qiuxian [27] and Anyang ([30] and this study).
We hypothesize that the resistance documented here reduces the efficacy of Cry1Ac-producing Bt cotton againstH. armigerain the field, particularly at the end of the growing season [33]. This hypothesis is based on the finding that 5 to 20% of susceptibleH. armigeralarvae can survive on Bt cotton in China toward the end of the growing season [19,33]. In light of only 80–95% mortality of susceptible larvae, we infer that even small decreases in susceptibility to Cry1Ac could reduce the efficacy of Bt cotton in the field. For Cry1Ac activated toxin, we found up to a 16-fold increase in the LC50 of Cry1Ac for a field population from northern China relative to a susceptible field population from northwestern China, and an overall tripling of the median LC50of Cry1Ac activated toxin and protoxin in 13 populations from northern China relative to two populations from northwestern China (Fig. 2, Tables S1 and S2).
Additional experiments are needed to determine if the substantial decreases in susceptibility to Cry1Ac measured in lab bioassays translate to reduced efficacy in the field. Meanwhile, widespread failures of Bt cotton have not been reported in China. Two factors that could be reducing the negative impact of field-evolved resistance ofH. armigerato Cry1Ac in northern China are the reduction in this pest’s population density from 1992 to 2006 [8] and the continued application of more than 10 insecticide sprays per season on cotton [28]. Although sprays targeting H. armigeradropped from 1999 to 2008, the concomitant increase in sprays for mirid bugs yielded a small net increase in sprays for all insects on cotton in northern China from 1999 to 2008 [28].
The outcome of China’s experiment with ‘‘natural’’ refuges of non-Bt host plants other than cotton is mixed. Although widespread control failures have not been reported after 14 years of commercialization of Bt cotton producing Cry1Ac, non-Bt cotton accounted for more than 20% of the total cotton planted in northern China until 2003 [8]. Thus, field-evolved resistance to Cry1Ac in northern China was detected within 8 years after Bt cotton exceeded 80% of the total area of cotton planted.
Monitoring ofH. armigerain China has provided a warning that may be early enough to spur proactive measures to limit the consequences of resistance to Cry1Ac. The observed resistance could be countered by switching to transgenic cotton plants that produce two or more different toxins [25]. Several currently available two-toxin cultivars of cotton produce a Cry1A toxin and another toxin [12]. However, given the resistance to Cry1Ac in some field populations and the expected cross-resistance among Cry1A toxins, plants with two or more toxins other than Cry1A toxins would probably be more durable.
The results here indicating that resistance to Cry1Ac did not confer cross-resistance to Cry2Ab suggest that Cry2Ab could be useful against populations with resistance to Cry1Ac. However, our results differ from previous results based on RADR showing a genetic correlation in susceptibility between Cry1Ac and Cry2Ab both within and across populations sampled in 2008 from Anci and Xiajin [32]. Unlike previous results showing significantly decreased susceptibility to Cry2Ab in Xiajin relative to Anci in 2008 [32], we found that in 2010, the LC50of Cry2Ab was slightly higher for Anci than for Xiajin (Fig. 2, Table S3).
Bt toxin Vip3Aa is especially promising for controlling populations with resistance to Cry1Ac, because susceptibility was not correlated between Cry1Ac and Vip3Aa within the Anci and
Xiajin populations, and susceptibility was negatively correlated between Cry1Ac and Vip3Aa across these two populations [25]. Thus, pyramided Bt cotton producing both Vip3Aa and Cry2Ab could be particularly durable against H. armigera. Moreover, integration of Bt cotton with several other control tactics could provide a more sustainable pest management system [7].
Materials and Methods
Insect rearing and strains
We reared larvae ofH. armigera on an artificial diet based on wheat germ and soybean powder at 2761uC with a 16:8 (L:D) photoperiod. Adults were held under the same temperature and light conditions at 60–70% RH and supplied with a 10% sugar solution.
Insects were collected during June to August of 2010 from 13 sites in northern China and two sites in northwestern China (Table 1, Fig. 1). Bt cotton was the predominant host plant at all collection sites except Shawan, where no Bt cotton has been grown and non-Bt cotton was the predominant host plant. We collected male and female moths by light trap at 13 sites and eggs on Bt cotton plants at two sites in northern China (Yancheng and Qianjiang). Insects from the collected eggs were reared to adults in the laboratory on diet. We tested the F1progeny from all 15 sites with bioassays as described below.
We sampled from two sites in northwestern China where Bt cotton had not been planted intensively to provide susceptible field populations for comparison with potentially resistant field populations from northern China, where Bt cotton had been planted intensively. We did not sample more sites throughout northwestern China because our goal was to use the two northwestern populations as standards for comparison, not to assess variation in northwestern China, which has been reported previously [26,29]. As another standard for comparison, we also tested the susceptible SCD strain. The SCD strain was started with insects from the Cote D’Ivoire (Ivory Coast), Africa over 30 years ago and has been maintained in the laboratory with no outcrossing and no exposure to insecticides or Bt toxins [34].
Bt toxins
Cry1Ac protoxin was produced from the HD73 strain ofBacillus thuringiensissubsp.kurstaki. Activated Cry1A toxin was prepared by incubating with 20:1(w/w) of protoxin:TPCK-treated bovine trypsin (Sigma, T-8642). Cry2Ab protoxin was provided by the Institute of Plant Protection, Chinese Academy of Agricultural Sciences (CAAS), China.
Bioassays
We used diet surface overlay bioassays. Toxin stock suspensions were diluted with a 0.01 M, pH 7.4, phosphate buffer solution (PBS). Liquid artificial diet (900ml) was dispensed into each well of
a 24-well plate. After the diet cooled and solidified, 100ml of PBS
containing the desired concentration of Bt toxin was applied evenly to the diet surface in each well and allowed to air dry, and a single larva was placed in each well. At the end of the bioassay, we scored larvae as dead if they died or if they weighed less than 5 mg.
lower with the new method. For any given concentration, survival was lower for the new method than the old method. This means that any increase in survival found with the new method compared with previous results from the old method is conservative because it would tend to underestimate the increase in survival.
For Cry2Ab, we used unfed neonates (,24 h old) and recorded mortality after 7 days. The method for Cry2Ab required less toxin than the method for Cry1Ac, and followed the method established in Australia for testing Cry2Ab againstH. armigera[36]. We were not able to test the Gaoyang population with Cry2Ab.
For all concentrations other than the diagnostic concentration of Cry1Ac activated toxin (1000 ng/cm2), we tested 48 larvae for each toxin concentration, including a control with PBS and no toxin. For the diagnostic concentration, the number of larvae tested per population ranged from 48 to 1848 (Table 1). All tests were done at 2661uC, with a 16:8 L:D photoperiod and 60% RH. Control mortality was consistently low across all populations tested (mean = 2.5%, range = 0 to 6.2%).
Data analysis
We used the PoloPlus program [37] to conduct probit analysis of the concentration-mortality data to estimate the concentration killing 50% of larvae tested (LC50), the 95% fiducial limits of the LC50, the slope of the concentration-mortality line and the standard error of the slope. We considered two LC50 values significantly different only if their 95% fiducial limits did not overlap, which is a conservative criterion [38,39]. We calculated the resistance ratio (RR) as the LC50of a population divided by the LC50of the Shawan field population, which had not been exposed to Bt cotton.
To test the hypothesis that the LC50 values were higher for northern China (which had a history of intense planting of Bt cotton) than northwestern China (which had a history of much less
planting of Bt cotton), we used the Mann-Whitney U-test. We used Spearman’s rank correlation to test the hypothesis that positive correlations occurred across populations between each of the following four pairs of parameters: LC50of Cry1Ac activated toxin and Cry1Ac protoxin, LC50 and survival at the diagnostic concentration of Cry1Ac activated toxin, LC50 of Cry1Ac activated toxin and Cry2Ab protoxin, LC50of Cry1Ac activated toxin and Cry2Ab protoxin. We used a Chi-squared test to determine if the frequency of survivors at the diagnostic concentration was higher in northern China than in northwestern China, and higher in 2010 (based on data here) than in 2005 (data from Yang et al. [30]) for Anyang. Because each hypothesis we tested is one-sided, we used one-tailed probability values.
Supporting Information Table S1 (PDF) Table S2 (PDF) Table S3 (PDF) Acknowledgments
We thank Mark Sisterson for thoughtful comments that improved the paper.
Author Contributions
Conceived and designed the experiments: YW. Performed the experi-ments: HZ WY JZ YY SW LJ. Analyzed the data: YW BT. Contributed reagents/materials/analysis tools: YY SW. Wrote the paper: YW BT.
References
1. Mendelsohn M, Kough J, Vaituzis Z, Matthews K (2003) Are Bt crops safe? Nat Biotechnol 21: 1003–1009.
2. Schnepf E, Crickmore N, Van Rie J, Lereclus D, Baum J, et al. (1998)Bacillus thuringiensis and its pesticidal crystal proteins. Microbiol Mol Biol Rev 62: 775–806.
3. James C (2009) Global status of commercialized Biotech/GM crops:2009. ISAAA Brief No. 41. ISAAA, Ithaca, New York.
4. Carriere Y, Ellers-Kirk C, Sisterson M, Antilla L, Whitlow M, et al. (2003) Long-term regional suppression of pink bollworm byBacillus thuringiensiscotton. Proc Natl Acad Sci U S A 100: 1519–1523.
5. Hutchison WD, Burkness EC, Mitchell PD, Moon RD, Leslie TW, et al. (2010) Areawide suppression of European corn borer with Bt maize reaps savings to non-Bt maize growers. Science 330: 222–225.
6. National Research Council (2010) The impact of genetically engineered crops on farm sustainability in the United States National Academics Press.
7. Tabashnik BE, Sisterson MS, Ellsworth PC, Dennehy TJ, Antilla L, et al. (2010) Suppressing resistance to Bt cotton with sterile insect releases. Nat Biotechnol 28: 1304–1307.
8. Wu KM, Lu YH, Feng HQ, Jiang YY, Zhao JZ (2008) Suppression of cotton bollworm in multiple crops in China in areas with Bt toxin-containing cotton. Science 321: 1676–1678.
9. Caprio MA, Sumerford DV (2007) Evaluating transgenic plants for suitability in pest and resistance management programs. In: LA. Lacey, HK. Kaya, eds. Field Manual of Techniques in Invertebrate Pathology Springer. pp 769–789.
10. Gould F (1998) Sustainability of transgenic insecticidal cultivars: integrating pest genetics and ecology. Annu Rev Entomol 43: 701–726.
11. Tabashnik B (1994) Evolution of resistance toBacillus thuringiensis. Annu Rev Entomol 39: 47–79.
12. Tabashnik BE, Van Rensburg JB, Carriere Y (2009) Field-evolved insect resistance to Bt crops: definition, theory, and data. J Econ Entomol 102: 2011–2025.
13. Dhurua S, Gujar GT (2011) Field-evolved resistance to Bt toxin Cry1Ac in the pink bollworm,Pectinophora gossypiella(Saunders) (Lepidoptera: Gelechiidae), from India. Pest Manag Sci;doi: 10.1002/ps.2127.
14. Carrie`re Y, Crowder DW, Tabashnik BE (2010) Evolutionary ecology of insect adaptation to Bt crops. Evol Appl 3: 561–573.
15. Tabashnik BE (2008) Delaying insect resistance to transgenic crops. Proc Natl Acad Sci U S A 105: 19029–19030.
16. Tabashnik BE, Gassmann AJ, Crowder DW, Carriere Y (2008) Insect resistance to Bt crops: evidence versus theory. Nat Biotechnol 26: 199–202.
17. Downes S, Mahon RJ, Rossiter L, Kauter G, Leven T, et al. (2010) Adaptive management of pest resistance byHelicoverpaspecies (Noctuidae) in Australia to the Cry2Ab Bt toxin in Bollgard IIHcotton. Evol Appl 3: 574–584. 18. Wu K (2007) Monitoring and management strategy for Helicoverpa armigera
resistance to Bt cotton in China. J Invertebr Pathol 95: 220–223.
19. Wu KM, Guo YY (2005) The evolution of cotton pest management practices in China. Annu Rev Entomol 50: 31–52.
20. Wu K, Guo Y, Gao S (2002) Evaluation of the natural refuge function for
Helicoverpa armigera(Lepidoptera: Noctuidae) withinBacillus thuringiensistransgenic cotton growing areas in North China. J Econ Entomol 95: 832–837. 21. Gao Y, Wu K, Gould F (2009) Frequency of Bt resistance alleles inHelicoverpa
armigeraduring 2006–2008 in Northern China. Environ Entomol 38: 1336–1342. 22. Li G, Wu K, Gould F, Feng H, He Y, et al. (2004) Frequency of Bt resistance genes inHelicoverpa armigerapopulations from the Yellow River cotton-farming region of China. Entomol Exp Appl 112: 135–143.
23. Wu K, Guo Y, Head G (2006) Resistance monitoring ofHelicoverpa armigera
(Lepidoptera: Noctuidae) to Bt insecticidal protein during 2001–2004 in China. J Econ Entomol 99: 893–898.
24. Li G, Wu K, Gould F, Wang J, Miao J, et al. (2007) Increasing tolerance to Cry1Ac cotton from cotton bollworm,Helicoverpa armigera, was confirmed in Bt cotton farming area of China. Ecol Entomol 32: 366–375.
25. An J, Gao Y, Wu K, Gould F, Gao J, et al. (2010) Vip3Aa tolerance response of
Helicoverpa armigerapopulations from a Cry1Ac cotton planting region. J Econ Entomol 103: 2169–2173.
26. Li GP, Feng HQ, Gao YL, Wyckhuys KAC, Wu KM (2010) Frequency of Bt resistance alleles inHelicoverpa armigerain the Xinjiang cotton-planting region of China. Environ Entomol 39: 1698–1704.
27. Liu F, Xu Z, Zhu YC, Huang F, Wang Y, et al. (2010) Evidence of field-evolved resistance to Cry1Ac-expressing Bt cotton inHelicoverpa armigera(Lepidoptera: Noctuidae) in northern China. Pest Manag Sci 66: 155–161.
29. Du W, Wang D, Yu J, Li X (2010) Baseline Susceptibility ofHelicoverpa armigerato Bt Toxin (Cry1Ac) in cotton field of Xinjiang. Xinjiang Agric Sci 47: 902–905. 30. Yang YJ, Chen HY, Wu YD, Yang YH, Wu SW (2007) Mutated cadherin alleles from a field population of Helicoverpa armigera confer resistance to Bacillus thuringiensistoxin Cry1Ac. Appl Environ Microb 71: 6939–6944.
31. Wu K, Guo Y, Lv N (1999) Geographic variation in susceptibility ofHelicoverpa armigera(Lepidoptera: Noctuidae) toBacillus thuringiensisinsecticidal protein in China. J Econ Entomol 92: 273–278.
32. Gao Y, Wu K, Gould F, Shen Z (2009) Cry2Ab tolerance response ofHelicoverpa armigera(Lepidoptera: Noctuidae) populations from Cry1Ac cotton planting region. J Econ Entomol 102: 1217–1223.
33. Wan P, Zhang Y, Wu K, Huang M (2005) Seasonal expression profiles of insecticidal protein and control efficacy againstHelicoverpa armigerafor Bt cotton in the Yangtze River valley of China. J Econ Entomol 98: 195–201. 34. Yang YH, Yang YJ, Gao WY, Guo JJ, Wu YH, et al. (2009) Introgression of a
disrupted cadherin gene enables susceptible Helicoverpa armigera to obtain resistance toBacillus thuringiensistoxin Cry1Ac. Bull Entomol Res 99: 175–181.
35. Xu X, Yu L, Wu Y (2005) Disruption of a cadherin gene associated with resistance to Cry1Acd-endotoxin ofBacillus thuringiensisinHelicoverpa armigera. Appl Environ Microb 71: 948–954.
36. Mahon RJ, k. Olsen KM, Downes S, Addison S (2007) Frequency of alleles conferring resistance to the Bt toxins Cry1Ac and Cry2Ab in Australian populations ofHelicoverpa armigera(Lepidoptera: noctuidae). J Econ Entomol 100: 1844–1853.
37. LeOra Software (2002) Polo Plus, a user’s guide to probit and logit analysis. Berkeley, CA, USA.
38. Payton ME, Greenstone MH, Schenker N (2003) Overlapping confidence intervals or standard error intervals: What do they mean in terms of statistical significance ? J Insect Sci 3: 34.