1Department of Medicine, Penang Medical College, Penang, Malaysia,2Steno Diabetes Centre, Gentofte, Denmark,3Department of Medicine, Penang General Hospital, Penang, Malaysia,4Clinical Research Centre, Seberang Jaya Hospital, Seberang Jaya, Penang, Malaysia,5Kepala Batas Hospital, Kepala Batas, Penang, Malaysia,6Cardiovascular, Diabetes and Nutrition Research Centre, Institute for Medical
Research, Kuala Lumpur, Malaysia,7Metabolic Unit, Institute of Biomedical Engineering, National Research Council, Padova, Italy
Abstract
Gestational Diabetes Mellitus (GDM) and vitamin D deficiency are related to insulin resistance and impaired beta cell function, with heightened risk for future development of diabetes. We evaluated the impact of vitamin D supplementation on markers of glucose metabolism and cardio metabolic risk in Asian women with former GDM and hypovitaminosis D. In this double blind, randomized controlled trial, 26 participants were randomized to receive either daily 4000 IU vitamin D3 or placebo capsules. 75g Oral Glucose Tolerance Test (OGTT) and bio-chemistry profiles were performed at baseline and 6 month visits. Mathematical models, using serial glucose, insulin and C peptide measurements from OGTT, were employed to cal-culate insulin sensitivity and beta cell function. Thirty three (76%) women with former GDM screened had vitamin D level of<50 nmol/L at baseline. Supplementation, when compared with placebo, resulted in increased vitamin D level (+51.1 nmol/L vs 0.2 nmol/L, p<0.001) and increased fasting insulin (+20% vs 18%, p = 0.034). The vitamin D group also demonstrated a 30% improvement in disposition index and an absolute 0.2% (2 mmol/mol) reduction in HbA1c. There was no clear change in insulin sensitivity or markers of cardio metabolic risk.
This study highlighted high prevalence of vitamin D deficiency among Asian women with for-mer GDM. Six months supplementation with 4000 IU of vitamin D3 safely restored the vitamin D level, improved basal pancreatic beta-cell function and ameliorated the metabolic state. There was no effect on markers of cardio metabolic risk. Further mechanistic studies explor-ing the role of vitamin D supplementation on glucose homeostasis among different ethnicities may be needed to better inform future recommendations for these women with former GDM at high risk of both hypovitaminosis D and future diabetes.
OPEN ACCESS
Citation:Yeow TP, Lim SL, Hor CP, Khir AS, Wan Mohamud WN, Pacini G (2015) Impact of Vitamin D Replacement on Markers of Glucose Metabolism and Cardio-Metabolic Risk in Women with Former Gestational Diabetes—A Double-Blind, Randomized Controlled Trial. PLoS ONE 10(6): e0129017. doi:10.1371/journal.pone.0129017
Academic Editor:Yiqing Song, Indiana University Richard M. Fairbanks School of Public Health, UNITED STATES
Received:December 27, 2014
Accepted:May 4, 2015
Published:June 9, 2015
Copyright:© 2015 Yeow et al. This is an open access article distributed under the terms of the Creative Commons Attribution License, which permits unrestricted use, distribution, and reproduction in any medium, provided the original author and source are credited.
Data Availability Statement:All relevant data are available in the manuscript and its Supporting Information files.
Introduction
Gestational diabetes mellitus (GDM) is a state of glucose intolerance occurring during pregnancy and is related to both resistance to peripheral action of insulin and impairment of beta-cell func-tion. Its transient presence during pregnancy alerts to a heightened risk of diabetes in the future. About 10–50% of women with GDM develop diabetes mellitus later on in life [1]. Data from
Ma-laysia found that 50% of GDM women had developed diabetes at an interval of five to seven years post index pregnancy [2]. Vitamin D deficiency has been shown to be associated with insu-lin resistance and impaired pancreatic function [3,4]. Vitamin D deficiency is more prevalent in women with GDM and low vitamin D levels correlate with insulin resistance [5–7].
Interventional studies using vitamin D supplement in an attempt to modify glucose metabo-lism have yielded mixed results. This may be partly due to variable doses of supplementation used, short duration of follow up and inappropriate target group. A very short duration of less than seven days of supplementation may not be sufficient to demonstrate the potential benefi-cial effects [8–10]. Previous studies suggested that vitamin D can help with early stage of
distur-bance in glucose handling [11], but is unable to augment insulin secretion in subjects with chronic diabetes and exhausted pancreatic function [9]. Lack of adequate dosing may have also accounted for the failure of many previous studies to demonstrate beneficial effects of vitamin D replacement. Adequate vitamin D supplementation would ideally raise blood 25-hydroxyvi-tamin D (25(OH)D) levels above 80 nmol/L because diabetes risk is lowest at this vi25-hydroxyvi-tamin D level [12]. Supplementation with 4000 IU of vitamin D3 per day for six months in a population of South Asian women with proven vitamin D deficiency safely restored the vitamin D level and improved insulin resistance [13].
Very little is known about the relationship between vitamin D status and glucose metabo-lism in women with former GDM. Most of the works on effect of vitamin D supplementation on GDM examined its effect during pregnancy rather than following delivery [14].
Our study aimed to evaluate the effect of adequate vitamin D supplementation on insulin sensitivity, pancreatic beta-cell function and markers of cardio-metabolic risk in Malaysian women with former GDM and vitamin D insufficiency.
Materials and Methods
The protocol for this trial and supporting CONSORT checklist are available as supporting in-formation; seeS1 CONSORT ChecklistandS1 Protocol.
Study Design and Screening
This was a prospective, randomized, double-blind, placebo-controlled, parallel group trial. Women with documented GDM in the most recent pregnancy, who were between 6 to 48 months post-partum, were identified from the delivery registry of Maternity Unit, Penang General Hospi-tal and antenaHospi-tal records of community health centers. Potential participants were approached through postal and telephone contacts, pre-screened by telephone interview and invited to attend the screening visit at Clinical Research Centre at Penang Medical College, Penang, Malaysia. The screening and recruitment period was started from 30thJune 2011 through to 3rdAugust 2012.
Women were excluded if they had medical conditions that might increase their risk or inter-fere with study assessments. These included pregnancy, breastfeeding, intolerance to vitamin D supplementation, drug or alcohol dependence, chronic renal or liver failure, hypercalcaemia, hypocalcaemia or concomitant use of calcium supplementation, anti-tuberculosis treatment or anti-epileptic medications. Women who have developed diabetes by the time of assessment were also excluded on the rationale that those with established disease might not respond as and analysis, decision to publish or preparation of the
manuscript.
were stored frozen at -20°C until laboratory analyses were performed. Physical activity was quantified using the Paffenbarger Physical Activity Questionnaire [15].
The Elecsys Vitamin D Total assay (Roche Diagnostics GmbH, Sandhofer Strasse 116, D-68305 Mannheim, Germany) was used to assay total vitamin D, including both vitamin D3 and vitamin D2. Inter-assay coefficient of variation for total vitamin D at concentrations of 37.44 nmol/L was less than 8.5%. The third generation Whole PTH (1–84) Specific
Immunoradio-metric Assay (IRMA) kits (Scantibodies Laboratory, Inc. 9336 Abraham Way, Santee, CA 92071 USA) were employed to assay iPTH. The human insulin and hsCRP ELISA kits (Demeditec Di-agnostics, Lise-Meitne-Strt.2, D-24145 Kiel-Wellsee, Germany) were used to measure serum in-sulin and hsCRP levels. The two-site immunoenzymometric assay kit (ST AIA-PACK C-peptide, TOSOH Corporation, Shiba-koen First Bldg., 3-8-2 Shiba, Minato-ku, Tokyo 105-8623 Japan) were used to assay C-peptide using the TOSOH AIA System Analyzer. Inter-assay coefficient of variation for insulin at 53μIU/ml was 3.8%, for C-peptide at 1.98 ng/ml and 4.9 ng/ml were 1.8%
and 4.9%, for hsCRP at 2.6 ug/ml was 8.4% and for iPTH at 32 pg/ml was 3.1%.
Randomization and follow up
Women who have plasma 25(OH)D level between 15 and 50 nmol/L without overt diabetes were eligible to proceed to the randomization phase. Overt diabetes was defined as fasting plasma glu-cose of7 mmol/L and/or 2-hour OGTT of11.1 mmol/L [16]. Women with plasma 25(OH)D of less than 15 nmol/L or those with overt diabetes were excluded from the study and referred to re-ceive active treatment. Eligible women were then randomized to rere-ceive either 4000 IU of vitamin D3 (cholecalciferol) per day (four capsules of 1000 IU each) or four capsules of matching placebo per day for six months. Both the active (vitamin D3) and placebo capsules contained 300 mg of soy oil. Offsite randomization was generated by the manufacturer of the vitamin D and placebo cap-sules (Blackmore Ltd) using nQuery Advisor. Randomization and allocation were fully concealed from the investigators and subjects until after completion of the study. All participants attended every second month for review and collecting new supply. Participants were advised to contact re-search staff immediately if they suspected a reaction to the supplements or in the event of pregnan-cy. Serum calcium and albumin were taken at two months to rule out hypervitaminosis. The assessments performed at the screening visit were repeated after six months of supplementation. The study was completed on 1stFebruary 2013 with last visit for the last participant. All the data were hosted at Penang Medical College. The data were de-identified before their use in analyses.
Insulin sensitivity and pancreatic beta-cell function
Fasting insulin secretion was evaluated from basal insulin and C-peptide concentrations. Total (120 minutes) insulin secretion was evaluated with the area under the curve of C-peptide (AUCcp), while the amount of insulin reaching the periphery (post-hepatic) with AUC of insu-lin (AUCinsuinsu-lin). Beta-cell function was assessed with the insuinsu-linogenic index calculated at 60 minutes: IGI60= (I60-Ibasal)/ (G60-Gbasal), and with the ratio of the incremental AUCcp
(ΔAUCcp) over the incremental AUCglucose(ΔAUCglucose), as a global insulinogenic index [20]. A simultaneous measurement of pancreatic beta-cell function, insulin sensitivity and glu-cose tolerance test (BIGTT) was employed to provide an additional estimate of insulin sensitiv-ity index (BIGTT-S) and acute insulin response (BIGTT-AIR) using serial data from OGTT; the BIGTT indices were shown to highly correlate with intravenous glucose tolerance test (IVGTT)-derived values [21]. Under normal physiology, the tight glucose regulation is main-tained by a balance between insulin secretion and insulin sensitivity [22]. To describe this pro-cess, here we used the product of post-hepatic beta-cell function (ratio of AUCinsulinover AUCglucose) and insulin sensitivity (OGIS). This product, in other circumstances called disposi-tion index (DI), interprets glucose tolerance of an individual by relating beta-cell funcdisposi-tion with whole-body insulin sensitivity[22].
Sample size and statistical analyses
By using nQuery Advisor version 6.01, based on a trial by von Hurst et al [13], a sample size of 9 will have 95% power to detect a difference in mean for Homeostatic Model Assessment of Insulin Resistance (HOMA%IR) of 0.700 (e.g. the differences between Group 1 mean,μ1, of
0.800 and a Group 2 mean,μ2, of 0.100), assuming that the common standard deviation is
0.384, with a 0.05 two-sided significance level. By allowing a 40% drop-out rate of subjects, the total sample for two arms (placebo and treatment groups) was calculated to be 26 subjects (13 patients for each arm).
All data in this study were analysed according to intention-to-treat protocol. Missing data for subjects who defaulted and withdrew from the study were analysed using listwise deletion technique. All clinical and biochemical continuous variables, except for post-partum duration, were not normally distributed. The non-normally distributed continuous variables were re-ported in median (25th, 75thpercentiles) while the only normally distributed continuous vari-able, post-partum duration, was reported in mean ± standard deviation. Comparison between interventional and placebo groups for baseline socio-demography, clinical histories and char-acteristics, markers for glucose metabolism, insulin sensitivity, pancreatic beta-cell function and cardio-metabolic risk markers were performed using Mann-Whitney U tests for non-nor-mally distributed continuous variables. Wilcoxon signed rank tests were employed to detect differences in clinical and biochemical markers pre- and post-intervention in each group, while Mann-Whitney U tests were performed to compare these markers across both groups. The two-sided statistical significance level, p-value, was set at 0.05 for all analyses in this study.
Ethical approval
Results
Diabetes and Vitamin D status among women with former GDM
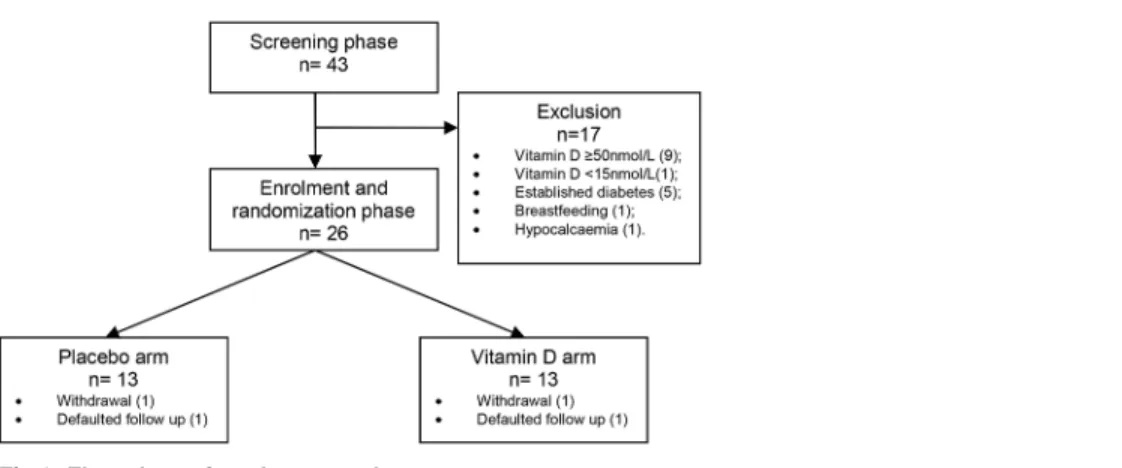
Fig 1shows the number of participants screened and randomized. A total of 43 women with
former GDM were screened for the study at an average of 23 ± 10.7 months post-partum. These were representative of the Malaysian ethnic groups, with 21 (48.8%) Malaysian Malays, 14 (32.6%) Malaysian Chinese and 8 (18.6%) Malaysian Indians. Thirty-three (76%) of these former GDM women had hypovitaminosis (9% had level<20 nmol/L, 67% had level between 20 and 49.9 nmol/L). The median serum vitamin D level among these former GDM women was 40.0 (26.26, 49.67) nmol/L.
By the time of their screening visits, 12 women with former GDM (30.2%) had developed variable degrees of glucose intolerance. These included 1 impaired fasting glucose (IFG), 6 im-paired glucose tolerance (IGT) and 5 overt diabetes.
Randomization and adherence to vitamin D supplementation
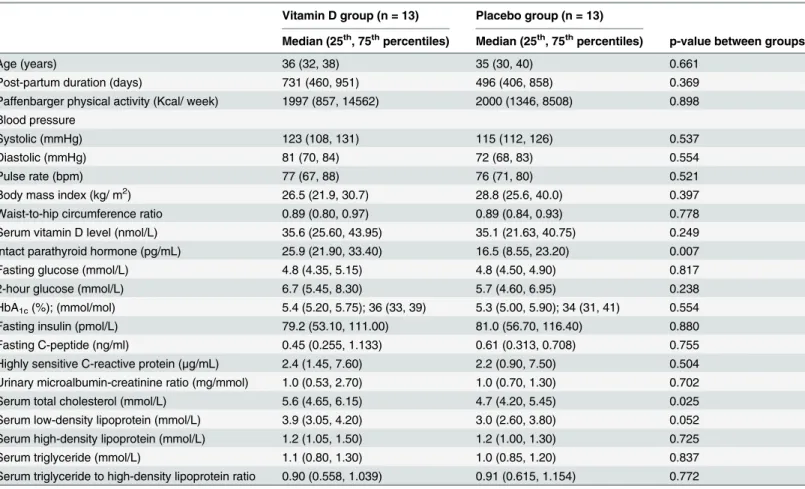
Seventeen women screened were excluded from the randomization phase. Four women dropped out of study (one became pregnant, one developed allergic reaction to bovine capsule and two did not return for final visit due to busy family commitment). Eleven women in each group completed the study (Fig 1). The vitamin D and placebo groups did not differ at baseline with respect to socio-demographics, physical characteristics and laboratory measures, except for serum iPTH and serum total cholesterol (Table 1). The average vitamin D capsule adher-ence over the 6 months follow-up period, reported by pill count, was 88.2% in the vitamin D group and 86.7% in the placebo group. The median serum 25(OH)D concentrations increased significantly in the vitamin D-supplemented group following 6 months of supplementation while the levels remained unchanged in the placebo group (Fig 2). There was no evidence of hypervitaminosis, and serum calcium after 2 months and 6 months of supplements remained normal for all subjects. One participant developed allergic rash to the bovine capsule which re-solved fully on stopping the supplement. No other adverse events were reported.
Effect of vitamin D supplementation on glucose metabolism
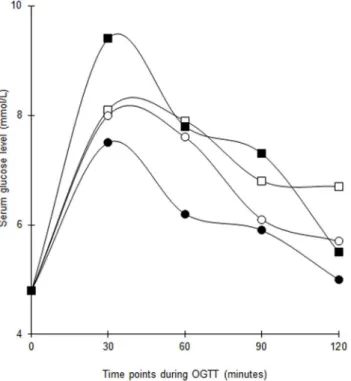
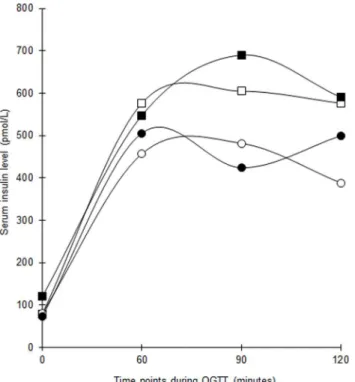
The serial changes in median serum glucose and insulin levels during OGTT are shown in Figs
3and4. The median glucose in the vitamin D group decreased significantly at 2-hour but the changes at the other time points were not significant. There was no difference in the total
AUC-glucosewithin and between groups following supplementation. The HbA1cdropped by 2 mmol/
Fig 1. Flow chart of study protocol.
mol (0.2%) in both groups but with greater statistical significance in the vitamin D group
(Table 2).
Three women in the vitamin D group had IGT at baseline. At the end of the 6 months study, 1 reverted to normal while 2 others remained at the IGT level. In the placebo group, 1 woman with IGT normalized, 1 with IFG progressed to diabetes and 2 women who started with normal glucose response progressed to IGT.
Effect of vitamin D supplementation pancreatic beta-cell function and
insulin sensitivity
The basal pancreatic beta-cell function, as measured by fasting insulin increased by 20% in the vitamin D group and decreased by 18% in the placebo group (p = 0.034). Fasting C-peptide in-creased significantly in both arms (77.8% in vitamin D and 51% in placebo). This inin-creased basal insulin secretion in the absence of changes in basal glucose implied improved basal pan-creatic beta-cell function following supplementation of vitamin D. The total insulin secretion over 2 hours following the glucose challenge, as measured by AUCinsulin(total pancreatic insu-lin secretion) and AUCcp(total insulin reaching the peripheral circulation) did not differ between groups.
The dynamic pancreatic response following glucose challenge did not show consistent change with vitamin D supplementation (Table 2). The BIGTT-AIR increased significantly by
Table 1. Baseline demographics, clinical characteristics and laboratory measures of women with former GDM in both interventional and placebo groups at screening visit.
Vitamin D group (n = 13) Placebo group (n = 13)
Median (25th, 75thpercentiles) Median (25th, 75thpercentiles) p-value between groups
Age (years) 36 (32, 38) 35 (30, 40) 0.661
Post-partum duration (days) 731 (460, 951) 496 (406, 858) 0.369
Paffenbarger physical activity (Kcal/ week) 1997 (857, 14562) 2000 (1346, 8508) 0.898 Blood pressure
Systolic (mmHg) 123 (108, 131) 115 (112, 126) 0.537
Diastolic (mmHg) 81 (70, 84) 72 (68, 83) 0.554
Pulse rate (bpm) 77 (67, 88) 76 (71, 80) 0.521
Body mass index (kg/ m2) 26.5 (21.9, 30.7) 28.8 (25.6, 40.0) 0.397
Waist-to-hip circumference ratio 0.89 (0.80, 0.97) 0.89 (0.84, 0.93) 0.778
Serum vitamin D level (nmol/L) 35.6 (25.60, 43.95) 35.1 (21.63, 40.75) 0.249
Intact parathyroid hormone (pg/mL) 25.9 (21.90, 33.40) 16.5 (8.55, 23.20) 0.007
Fasting glucose (mmol/L) 4.8 (4.35, 5.15) 4.8 (4.50, 4.90) 0.817
2-hour glucose (mmol/L) 6.7 (5.45, 8.30) 5.7 (4.60, 6.95) 0.238
HbA1c(%); (mmol/mol) 5.4 (5.20, 5.75); 36 (33, 39) 5.3 (5.00, 5.90); 34 (31, 41) 0.554
Fasting insulin (pmol/L) 79.2 (53.10, 111.00) 81.0 (56.70, 116.40) 0.880
Fasting C-peptide (ng/ml) 0.45 (0.255, 1.133) 0.61 (0.313, 0.708) 0.755
Highly sensitive C-reactive protein (μg/mL) 2.4 (1.45, 7.60) 2.2 (0.90, 7.50) 0.504 Urinary microalbumin-creatinine ratio (mg/mmol) 1.0 (0.53, 2.70) 1.0 (0.70, 1.30) 0.702
Serum total cholesterol (mmol/L) 5.6 (4.65, 6.15) 4.7 (4.20, 5.45) 0.025
Serum low-density lipoprotein (mmol/L) 3.9 (3.05, 4.20) 3.0 (2.60, 3.80) 0.052 Serum high-density lipoprotein (mmol/L) 1.2 (1.05, 1.50) 1.2 (1.00, 1.30) 0.725
Serum triglyceride (mmol/L) 1.1 (0.80, 1.30) 1.0 (0.85, 1.20) 0.837
Serum triglyceride to high-density lipoprotein ratio 0.90 (0.558, 1.039) 0.91 (0.615, 1.154) 0.772
52% in the vitamin D group. The IGI60and global insulinogenic index increased but was not affected by vitamin D supplementation.
Vitamin D had no obvious effect on insulin sensitivity. No within-group changes were ob-served for QUICKI, OGIS and BIGTT-S. A borderline between-groups difference (p = 0.047) was noted for QUICKI but not for OGIS and BIGTT-S. The disposition index increased signifi-cantly in the vitamin D group (Table 2).
Effect of vitamin D supplementation on markers of cardio-metabolic risk
Overall, vitamin D supplementation did not alter the markers of cardio-metabolic risk
(Table 3). There were no significant between-group differences in changes in blood pressure,
BMI, WHR, hsCRP, total cholesterol, LDL-cholesterol and HDL-cholesterol. The placebo group experienced a within-group decrease in BMI, systolic and diastolic blood pressures and LDL-cholesterol, while the vitamin D group saw a rise in triglyceride and triglyceride to HDL-cholesterol ratio after 6 months. These within-group differences may be due to chance findings given the small sample size.
Discussion
This study highlights a high prevalence of vitamin D insufficiency among young women of Ma-laysian origin with former GDM and their high risk of progression to diabetes. Supplementa-tion with vitamin D at 4000 IU daily for six months resulted in improved 25(OH)D levels and improved basal pancreatic beta-cell function when compared with placebo. There appeared to be no similar effect on the dynamic pancreatic function. While the improved BIGTT-AIR
Fig 2. Differences in median serum vitamin D levels among women with former GDM in both groups. Boxplot with complete line = Pre-study serum vitamin D level. Boxplot with breaking line = Post-study serum vitamin D level.
suggests amelioration, this was not supported by the other indices of dynamic pancreatic beta-cell function including IGI60and the global insulinogenic index.
In our study, vitamin D replacement did not result in significant change in insulin sensitivi-ty. Previous randomized controlled studies showed that vitamin D, when given in similar dose and duration, improved hepatic insulin sensitivity in insulin-resistant South Asian women [13] and obese adolescents [23]. A single injection of 300,000 IU vitamin D3 at 3–10 days after
de-livery reduces indices of insulin resistance in mothers with recent pregnancy complicated by GDM [24]. On the other hand, a study in obese African Americans [25], supplementation of vitamin D worsened hepatic insulin sensitivity. In observational studies, higher serum 25(OH) D and lower HOMA%IR were observed in Caucasian Americans but not in African Americans [4,26]. These seeming conflicting results suggest that the effect of vitamin D on insulin sensi-tivity may be different in different ethnic groups. In our study, vitamin D replacement did not result in significant change in markers of peripheral insulin sensitivity, including OGIS and BIGTT-S. While the between-group difference in QUICKI may imply that vitamin D supple-mentation decreased hepatic insulin sensitivity, the marginal p-value could be equally likely due to the scattering of data in a small sample size. Our study included Malaysian women of three different ethnic groups and our sample size was inadequate to differentiate effect among the different ethnic groups; however, the similar baseline characteristics seem to exclude an ef-fect of ethnicity within Malaysian women.
Although OGIS and ratio of AUCinsulinover AUCglucosedid not improve significantly, their combination (the so-called disposition index) increased significantly in the vitamin D group, suggesting indeed an amelioration of the compensatory mechanism of insulin resistance by
Fig 3. Changes in median serum glucose levels throughout 2-hour OGTT at baseline and post intervention among women with former GDM in both groups.White squares = Vitamin D group (baseline). Black squares = Vitamin D group (post intervention). White circles = Placebo group (baseline). Black circles = Placebo group (post intervention). The baseline differences of median serum glucose levels between vitamin D-supplemented group and placebo group at 0 (p = 0.817), 30 (p = 0.512), 60 (p = 0.383), 90 (p = 0.700) and 120 (p = 0.238) minutes were not statistically significant.
insulin release [22]. This is supported by an improvement in the glucose tolerance and a signifi-cant drop in HbA1cof 2 mmol/mol (0.2%) in the vitamin D group, but not in the placebo arm.
The overall trend suggests that vitamin D may have beneficial effect on glucose metabolism in women with previous gestational diabetes and hypovitaminosis D, by predominantly im-proving the basal pancreatic beta-cell function. This observation will need to be verified in a larger trial of longer duration. Contrary to observational data, supplementation of vitamin D failed to result in significant changes in markers of cardio-metabolic risk of blood pressure, lipid profile, hsCRP and MCR in this interventional study.
The high prevalence of vitamin D insufficiency despite the tropical climate and lack of sea-sonal variation is alarming. Inadequate intake from diets low in vitamin D, practice of deliber-ate sun avoidance and foetal utilization through previous pregnancy and lactation are all possible contributing factors. In addition, darker skin pigmentation may be associated with de-creased vitamin D conversion [27]. This is important in our globalized world, because people of tropical origin going–for instance–to Northern Europe will lack sun light even more,
poten-tially worsening their hypovitaminosis. On the other hand, Powe et al recently demonstrated that racial difference in common genetic polymorphism between black and white Americans contributes to variation in the levels of vitamin D-binding protein and bioavailability of 25 (OH)D [28]. The vitamin D-binding protein was not incorporated into the assessment of vita-min D status in our multi-ethnic study population.
The strength of this study lied in the randomized placebo-controlled prospective design, in a well-defined group of individuals at high risk of progression to diabetes, the use of high dose of vitamin D over substantial duration, conduct of 2-hour OGTT which enabled use of various
Fig 4. Changes in median serum insulin levels throughout 2-hour OGTT at baseline and post intervention among women with former GDM in both groups.White squares = Vitamin D group (baseline). Black squares = Vitamin D group (post intervention). White circles = Placebo group (baseline). Black circles = Placebo group (post intervention).The baseline differences of median serum insulin levels between vitamin D-supplemented group and placebo group at 0 (p = 0.878), 60 (p = 0.457), 90 (p = 0.489) and 120 (p = 0.112) minutes were not statistically significant.
Table 2. Changes in vitamin D level, glucose and markers of insulin sensitivity and pancreatic beta-cell functions among women with former GDM in both interventional and placebo groups before and after intervention.
Vitamin D group (n = 13) Placebo group (n = 13)
Median (25th, 75th percentiles)
p-value difference within group
Median (25th, 75th percentiles)
p-value difference within group
p-value changes(E-B) between groups
Serum vitamin D level (nmol/L)
Baseline (B) 35.6 (25.60, 43.95) 0.003 35.1 (21.63, 40.75) 0.859 Endpoint
(E)
92.4 (79.00, 102.34) 28.5 (20.87, 42.43)
Change (E-B)
51.1 (39.86, 76.08) -0.2 (-10.18, 11.83) <0.001
Intact parathyroid hormone (pg/mL) Baseline (B) 25.9 (21.90, 33.40) 0.213 16.5 (8.55, 23.20) 0.656 Endpoint
(E)
20.1 (16.00, 29.00) 17.0 (10.10, 22.50)
Change (E-B)
-5.1 (-12.50, 1.40) 2.30 (-3.90, 6.90) 0.123
HbA1Clevel and glucose metabolism during OGTT HbA1c(mmol/mol); (%)
Baseline (B) 36 (33, 39); 5.4 (5.20, 5.75) 0.009 34 (31, 41); 5.3 (5.00, 5.90) 0.057 Endpoint
(E)
33 (30, 36); 5.2 (4.90, 5.40) 31 (30, 40); 5.0 (4.90, 5.80)
Change (E-B)
-2 (-3, -1); -0.2 (-0.30, -0.10) -2 (-4, 0); -0.2 (-0.40, 0) 0.847
Fasting glucose (mmol/L)
Baseline (B) 4.8 (4.35, 5.15) 0.674 4.8 (4.50, 4.90) 0.211
Endpoint (E)
4.8 (4.50, 5.10) 4.8 (4.30, 5.30)
Change (E-B)
0 (-0.20, 0) 0.1 (-0.20, 0.50) 0.270
30-minute glucose (mmol/L)
Baseline (B) 8.1 (7.50, 9.95) 0.646 8.0 (7.15, 9.10) 0.342 1.000
Endpoint (E)
9.4 (7.20, 10.30) 7.5 (6.80, 7.90)
Change (E-B)
-0.4 (-2.40, 1.70) -0.1 (-1.93, 0.48)
2-hour glucose (mmol/L)
Baseline (B) 6.7 (5.45, 8.30) 0.009 5.7 (4.60, 6.95) 0.657
Endpoint (E)
5.5 (5.00, 7.10) 5.0 (4.50, 7.90)
Change (E-B)
-2.6 (-1.50, -0.40) 0.4 (-1.20, 1.00) 0.061
AUCglucose(mmol/L)
Baseline (B) 871.5 (773.25, 1095.00) 0.386 849.0 (702.75, 942.00) 0.182 Endpoint
(E)
871.5 (768.00, 1027.50) 727.5 (655.50, 969.00)
Change (E-B)
-28.5 (-199.50, 70.5) -56.6 (-130.50, 54.00) 1.00
ΔAUCglucose(mmol/L)
Baseline (B) 283.5 (210.00, 496.50) 0.423 264.0 (140.25, 379.5) 0.062 Endpoint
(E)
286.5 (216.00, 441.00) 157.5 (79.50, 333.00)
Change (E-B)
-28.5 (-228, 70.5) -60 (-129.00, 12.00) 0.606
Insulin secretion
Baseline (B) 0.4 (0.26, 1.13) 0.013 0.6 (0.31, 0.71) 0.021 Endpoint
(E)
1.1 (0.57, 1.61) 0.8 (0.57, 1.22)
Change (E-B)
0.4 (0.03, 0.54) 0.3 (-0.09, 0.48) 0.365
AUCinsulin(pmol/L)
Baseline (B) 60660 (47931.0, 69399.0) 0.155 46296 (39441.0, 69579.0) 0.477 Endpoint
(E)
66612 (46380.0, 146160.0) 55044 (43242.0, 76134.0)
Change (E-B)
17376 (-8574, 41514) 3894 (-10242, 17524) 0.365
AUCcp(ng/mL)
Baseline (B) 240 (157.0, 317.0) 0.004 268 (138.5, 392.5) 0.006 Endpoint
(E)
397 (295.0, 456.0) 380 (371.0, 449.0)
Change (E-B)
157 (79.0, 210.0) 134 (86.0, 269.0) 1.00
ΔAUCinsulin(pmol/L)
Baseline (B) 48282 (36846.0, 54345.0) 0.248 35544 (31368.0, 53409.0) 0.594 Endpoint
(E)
49608 (34422.0, 129492.0) 40314 (36066, 64800)
Change (E-B)
13626 (-11634.0, 36402.0) 8508 (-20322, 25464) 0.606
ΔAUCcp(ng/mL)
Baseline (B) 132 (103.3, 195.0) 0.010 163 (95.25, 254.75) 0.026 Endpoint
(E)
269 (172.0, 319.0) 300 (277.0, 346.0)
Change (E-B)
97 (57.0, 142.0) 145 (34.0, 212.0) 0.898
ΔAUCinsulin/ΔAUCglucose
Baseline (B) 1.2 (1.07, 2.14) 0.062 1.4 (0.92, 1.98) 0.003
Endpoint (E)
1.9 (1.48, 4.03) 2.2 (1.40, 4.30)
Change (E-B)
0.4 (-0.11, 2.89) 0.7 (0.42, 2.13) 0.450
ΔAUCcp/ΔAUCglucose
Baseline (B) 0.03 (0.011, 0.041) 0.026 0.03 (0.015, 0.097) 0.013 Endpoint
(E)
0.05 (0.027, 0.099) 0.11 (0.054, 0.201)
Change (E-B)
0.02 (0.008, 0.066) 0.07 (0.017, 0.181) 0.250
IGI60(pmol/ mmol)
Baseline (B) 126.8 (91.37, 212.46) 0.328 135.0 (60.34, 203.19) 0.059
validated modeling to estimate insulin sensitivity and pancreatic function and the adjustment for confounder of physical activity. However, it was limited by the small number of participants of different ethnicities studied. A larger study with longer duration, including sufficient number of women with former GDM of different racial groups will be needed to explore if different races have different optimal serum concentration of 25(OH)D to improve glucose homeostasis.
Conclusions
This study has demonstrated that 6 months supplementation of vitamin D in Asian women with previous gestational diabetes and hypovitaminosis D resulted in improved basal pancreatic beta-cell function, unchanged dynamic pancreatic beta-cell function and overall amelioration of the metabolic state as shown by an improved DI and HbA1c. There was no
Table 2. (Continued)
Vitamin D group (n = 13) Placebo group (n = 13)
Median (25th, 75th percentiles)
p-value difference within group
Median (25th, 75th percentiles) p-value difference within group p-value changes(E-B) between groups Endpoint (E)
204.0 (63.21, 407.27) 256.8 (119.26, 347.52)
Change (E-B)
31.8 (-30.05, 297.33) 82.66 (-2.00, 203.87) 0.863
BIGTT-AIR (min*pmol/L)
Baseline (B) 2372.9 (1761.27, 3438.48) 0.062 3010.1 (1871.95, 3722.19) 0.424 Endpoint
(E)
3864.7 (2844.36, 5035.23) 2527.1 (1863.77, 3453.72)
Change (E-B)
1241.2 (-299.48, 2260.43) -144.8 (-1893.53, 916.62) 0.133
Insulin sensitivity QUICKI
Baseline (B) 0.32 (0.310, 0.347) 0.248 0.33 (0.311, 0.344) 0.110 Endpoint
(E)
0.31 (0.303, 0.328) 0.33 (0.315, 0.354)
Change (E-B)
-0.01 (-0.029, 0.008) 0.01 (-0.005, 0.021) 0.047
OGIS (ml/ min/ m2)
Baseline (B) 435 (356.5, 455.5) 0.790 438 (397.0, 463.0) 0.689 Endpoint
(E)
396 (315.0, 469.0) 446 (358.0, 488.0)
Change (E-B)
-10 (-47.0, 55.0) -1 (-82.0, 42.0) 1.00
BIGTT-S (10-5
*(min*pmol/L)-1)
Baseline (B) 4.5 (2.52, 8.19) 0.374 6.4 (3.45, 9.23) 0.859
Endpoint (E)
4.9 (1.31, 5.57) 5.3 (3.64, 9.13)
Change (E-B)
-0.6 (-1.15, 0.60) -0.3 (-1.29, 1.04) 0.699
Disposition index (OGIS*ratio of total AUCinsulinover AUCglucose) Baseline (B) 25.7 x 10³(22.13 x 10³,
32.45 x 10³)
0.021 24.1 x 10³(19.64 x 10³, 33.78 x 10³)
0.477
Endpoint (E)
33.7 x 10³(32.51 x 10³,
44.60 x 10³) 29.6 x 10
3(21.07 x 10³, 42.44 x 10³)
Change (E-B)
7.7 x 10³(2.94 x 10³, 17.52
x 103) 4.5 x 10
3
(-3.88 x 10³,
10.70 x 10³) 0.171
(E-B)
Diastolic blood pressure (mmHg) Baseline
(B)
81.0 (70.00, 83.50) 0.625 72.0 (68.50, 83.00) 0.023
Endpoint (E)
76.8 (72.67, 84.00) 67.0 (64.67, 73.33)
Change (E-B)
2.0 (-5.33, 3.67) -6.0 (-12.67, 0.33) 0.065
Body mass index (kg/ m2) Baseline
(B)
26.5 (21.95, 30.67) 0.929 28.8 (25.55, 30.96) 0.026
Endpoint (E)
25.8 (23.61, 30.36) 27.8 (25.99, 29.99)
Change (E-B)
0.1 (-0.77, 0.78) -0.6 (-1.04, 0.14) 0.133
Waist-to-hip circumference ratio Baseline
(B)
0.89 (0.808, 0.968) 1.0 0.89 (0.838, 0.925) 0.155
Endpoint (E)
0.90 (0.835, 0.960) 0.90 (0.869, 0.965)
Change (E-B)
0.02 (-0.054, 0.053) 0.04 (-0.014, 0.077) 0.151
Highly sensitive C-reactive protein (μg/mL) Baseline
(B)
2.4 (1.45, 7.60) 0.563 2.2 (0.90, 7.50) 0.594
Endpoint (E)
1.8 (0.50, 3.50) 3.7 (0.40, 4.90)
Change (E-B)
-0.2 (-2.20, 1.00) 0 (-2.10, 1.40) 0.748
Urinary microalbumin-creatinine ratio (mg/mmol) Baseline
(B)
1.0 (0.53, 2.70) 0.399 1.0 (0.70, 1.30) 0.722
Endpoint (E)
0.9 (0.58, 1.33) 0.8 (0.60, 1.60)
Change (E-B)
0 (-1.55, 0.20) -0.1 (-0.70, 0.90) 0.766
Serum total cholesterol (mmol/L) Baseline
(B)
5.6 (4.65, 6.15) 0.423 4.7 (4.20, 5.45) 0.181
Endpoint (E)
5.6 (4.60, 5.80) 4.4 (4.10, 5.10)
Change (E-B)
-0.2 (-0.90, 0.50) -0.5 (-0.70, 0.30) 0.921
effect on markers of cardio-metabolic risk. Further mechanistic studies exploring the role of vi-tamin D supplementation on glucose homeostasis among different ethnicities may be needed to better inform future recommendations for these women with former GDM at high risk of both hypovitaminosis D and future diabetes.
Supporting Information
S1 CONSORT Checklist. CONSORT Checklist.
(DOC)
S1 Protocol. Trial Protocol.
(DOCX)
S1 Study Dataset. Study data set and variable explanatory information.
(RAR)
Acknowledgments
The authors wish to thank the Director-General of Health Malaysia, Deputy Director-General of Health (Research and Technical Support) and the Director of the Institute for Medical
Table 3. (Continued)
Vitamin D group (n = 13) Placebo group (n = 13)
Median (25th, 75th percentiles)
p-value difference within group
Median (25th, 75th percentiles)
p-value difference within group
p-value changes(E-B) between groups
Serum low-density lipoprotein (mmol/L) Baseline
(B)
3.9 (3.05, 4.20) 0.327 3.0 (2.60, 3.80) 0.016
Endpoint (E)
3.6 (2.90, 3.90) 2.5 (2.30, 3.60)
Change (E-B)
-0.4 (-0.70, 0.20) -0.3 (-0.43, -0.05) 0.804
Serum high-density lipoprotein (mmol/L) Baseline
(B)
1.2 (1.05, 1.50) 0.256 1.2 (1.00, 1.30) 0.831
Endpoint (E)
1.3 (1.10, 1.40) 1.2 (1.00, 1.60)
Change (E-B)
-0.1 (-0.20, 0) -0.1 (-0.15, 0.15) 0.693
Serum triglyceride (mmol/L) Baseline
(B)
1.1 (0.80, 1.30) 0.049 1.0 (0.85, 1.20) 0.383
Endpoint (E)
1.2 (0.90, 1.60) 0.9 (0.60, 1.30)
Change (E-B)
0.1 (0, 0.50) -0.20 (-0.400, 0.020) 0.041
Serum triglyceride to high-density lipoprotein ratio Baseline
(B)
0.90 (0.558, 1.039) 0.021 0.91 (0.615, 1.154) 0.285
Endpoint (E)
1.14 (0.600, 1.375) 0.85 (0.500, 1.083)
Change (E-B)
0.20 (0.033, 0.375) -0.27 (-0.425, 0.149) 0.024
lyzed the data: TPY SLL CPH GP. Contributed reagents/materials/analysis tools: WNWM GP. Wrote the paper: TPY SLL CPH ASK WNWM GP.
References
1. Kim C, Newton KM, Knopp RH. Gestational diabetes and the incidence of type 2 diabetes: A systematic review. Diabetes Care. 2002; 25(10):1862–8. doi:10.2337/diacare.25.10.1862PMID:12351492
2. Velaiutham S, Khaw CH, Lim SL, Mumtaz M, Aziz NA, Baharom J, et al. Prevalence of glucose intoler-ance in women with previous gestational diabetes mellitus in Penang Hospital. Journal of the Asean Federation of Endocrine Societies- Proceedings of the First Malaysian Endocrine And Metabolic Socie-ty Annual Congress. 2009; 24(1 (Supplement)):14 (Abstract).
3. Chiu KC, Chu A, Go VLW, Saad MF. Hypovitaminosis D is associated with insulin resistance andβcell dysfunction. Am J Clin Nutr. 2004; 79(5):820–5. PMID:15113720
4. Scragg R, Sowers M, Bell C. Serum 25-hydroxyvitamin D, diabetes, and ethnicity in the third National Health and Nutrition Examination Survey. Diabetes Care. 2004; 27(12):2813–8. doi:10.2337/diacare. 27.12.2813PMID:15562190
5. Clifton-Bligh RJ, McElduff P, McElduff A. Maternal vitamin D deficiency, ethnicity and gestational diabe-tes. Diabet Med. 2008; 25(6):678–84. doi:10.1111/j.1464-5491.2008.02422.xPMID:18544105
6. Maghbooli Z, Hossein-nezhad A, Karimi F, Shafaei A- R, Larijani B. Correlation between vitamin D3 de-ficiency and insulin resistance in pregnancy. Diabetes Metab Res Rev. 2008; 24(1):27–32. PMID:
17607661
7. Zhang C, Qiu C, Hu FB, David RM, van Dam RM, Bralley A, et al. Maternal plasma 25-hydroxyvitamin D concentrations and the risk for gestational diabetes mellitus. PLoS One. 2008; 3(11):e3753. PMID:
19015731. doi:10.1371/journal.pone.0003753
8. Fliser D, Stefanski A, Franek E, Fode P, Gudarzi A, Ritz E. No effect of calcitriol on insulin-mediated glucose uptake in healthy subjects. Eur J Clin Invest. 1997; 27(7):629–33. PMID:9263752.
9. Orwoll E, Riddle M, Prince M. Effects of vitamin D on insulin and glucagon secretion in non-insulin-de-pendent diabetes mellitus. Am J Clin Nutr. 1994; 59(5):1083–7. PMID:8172095
10. Zofkova I, Stolba P. Effect of calcitriol and trifluoperazine on glucose stimulated B cell function in healthy humans. Exp Clin Endocrinol. 1990; 96(2):185–91. PMID:2097163.
11. Pittas AG, Harris SS, Stark PC, Dawson-Hughes B. The effects of calcium and vitamin D supplementa-tion on blood glucose and markers of inflammasupplementa-tion in nondiabetic adults. Diabetes Care. 2007; 30 (4):980–6. doi:10.2337/dc06-1994PMID:17277040
12. Scragg R. Vitamin D and type 2 diabetes: are we ready for a prevention trial? Diabetes. 2008; 57 (10):2565–6. doi:10.2337/db08-0879PMID:18820212
13. von Hurst PR, Stonehouse W, Coad J. Vitamin D supplementation reduces insulin resistance in South Asian women living in New Zealand who are insulin resistant and vitamin D deficient- a randomised, placebo-controlled trial. Br J Nutr. 2010; 103(04):549–55. doi:10.1017/S0007114509992017
14. Joergensen JS, Lamont RF, Torloni MR. Vitamin D and gestational diabetes: an update. Current Opin-ion in Clinical NutritOpin-ion & Metabolic Care. 2014; 17(4):360–7. doi:10.1097/mco.0000000000000064 PMID:00075197-201407000-00012.
15. Paffenbarger RS, Wing AL, Hyde RT. Physical activity as an index of heart attack risk in college alumni. Am J Epidemiol. 1978; 108(3):161–75. PMID:707484
17. Pacini G, Mari A. Methods for clinical assessment of insulin sensitivity andβ-cell function. Best Practice & Research Clinical Endocrinology & Metabolism. 2003; 17(3):305–22.
18. Mari A, Pacini G, Murphy E, Ludvik B, Nolan JJ. A model-based method for assessing insulin sensitivity from the oral glucose tolerance test. Diabetes Care. 2001; 24(3):539–48. doi:10.2337/diacare.24.3. 539PMID:11289482
19. Abdul-Ghani MA, Jenkinson CP, Richardson DK, Tripathy D, DeFronzo RA. Insulin secretion and ac-tion in subjects with impaired fasting glucose and impaired glucose tolerance: results from the Veterans Administration Genetic Epidemiology Study. Diabetes. 2006; 55(5):1430–5. PMID:16644701. 20. Tura A, Kautzky-Willer A, Pacini G. Insulinogenic indices from insulin and C-peptide: comparison of
beta-cell function from OGTT and IVGTT. Diabetes Res Clin Pract. 2006; 72(3):298–301. PMID:
16325298.
21. Hansen T, Drivsholm T, Urhammer SA, Palacios RT, Vølund A, Borch-Johnsen K, et al. The BIGTT Test: A novel test for simultaneous measurement of pancreaticβ-cell function, insulin sensitivity, and glucose tolerance. Diabetes Care. 2007; 30(2):257–62. doi:10.2337/dc06-1240PMID:17259491
22. Ahrén B, Pacini G. Islet adaptation to insulin resistance: mechanisms and implications for intervention. Diabetes, Obesity and Metabolism. 2005; 7(1):2–8. PMID:15642070
23. Belenchia AM, Tosh AK, Hillman LS, Peterson CA. Correcting vitamin D insufficiency improves insulin sensitivity in obese adolescents: a randomized controlled trial. Am J Clin Nutr. 2013; 97(4):774–81. doi:
10.3945/ajcn.112.050013PMID:23407306
24. Mozaffari-Khosravi H, Hosseinzadeh-Shamsi-Anar M, Salami MA, Hadinedoushan H, Mozayan MR. Effects of a single post-partum injection of a high dose of vitamin D on glucose tolerance and insulin re-sistance in mothers with first-time gestational diabetes mellitus. Diabetic Medicine. 2012; 29(1):36–42. doi:10.1111/j.1464-5491.2011.03473.xPMID:21977923
25. Harris SS, Pittas AG, Palermo NJ. A randomized, placebo-controlled trial of vitamin D supplementation to improve glycaemia in overweight and obese African Americans. Diabetes Obes Metab. 2012; 14 (9):789–94. doi:10.1111/j.1463-1326.2012.01605.xPMID:22486948
26. Alemzadeh R, Kichler J, Babar G, Calhoun M. Hypovitaminosis D in obese children and adolescents: relationship with adiposity, insulin sensitivity, ethnicity, and season. Metabolism. 2008; 57(2):183–91. PMID:S0026-0495(07)00319-8. doi:10.1016/j.metabol.2007.08.023
27. Clemens TL, Henderson SL, Adams JS, Holick MF. Increased skin pigment reduces the capacity of skin to synthesise vitamin D3. Lancet. 1982; 319(8263):74–6. PMID:S0140-6736(82)90214-8. 28. Powe CE, Evans MK, Wenger J, Zonderman AB, Berg AH, Nalls M, et al. Vitamin D-binding protein and