Association of Apolipoprotein B and
Adiponectin Receptor 1 Genes with Carcass,
Bone Integrity and Performance Traits in a
Paternal Broiler Line
Valdecy Aparecida Rocha da Cruz1, Flávio Schramm Schenkel2, Rodrigo Pelicioni Savegnago1, Natalia Vinhal Grupioni1, Nedenia Bonvino Stafuzza1,
Mehdi Sargolzaei3, Adriana Mércia Guaratini Ibelli4, Jane de Oliveira Peixoto4, Mônica Corrêa Ledur4, Danísio Prado Munari1*
1Departamento de Ciências Exatas, Faculdade de Ciências Agrárias e Veterinárias (FCAV),Universidade Estadual Paulista (UNESP), Jaboticabal, São Paulo, Brasil,2Department of Animal and Poultry Science, University of Guelph, Guelph, Ontario, Canada,3The Semex Alliance, Guelph, Ontario, Canada, 4Embrapa Suínos e Aves, Concórdia, Santa Catarina, Brasil
Abstract
Apolipoprotein B (APOB) and Adiponectin Receptor 1 (ADIPOR1) are related to the regula-tion of feed intake, fat metabolism and protein deposiregula-tion and are candidate genes for geno-mic studies in birds. In this study, associations of two single nucleotide polymorphisms (SNPs)g.102A>T(APOB) andg.729C>T(ADIPOR1) with carcass, bone integrity and per-formance traits in broilers were investigated. Genotyping was performed on a paternal line of 1,454 broilers. The SNP detection was carried out by PCR-RFLP technique using the restriction enzymesHhaIfor the SNPg.729C>TandMslIfor the SNPg.102A>T. The associ-ation analyses of the two SNPs with 85 traits were performed using the restricted maximum likelihood (REML) and Generalized Quasi-Likelihood Score (GQLS) methods. For REML the model included the random additive genetic effect of animal and fixed effects of sex, hatch and SNP genotypes. In the GQLS method, a logistic regression was used to associ-ate the genotypes with phenotypes adjusted for fixed effects of sex and hatch. The SNP g.729C>Tin theADIPOR1gene was associated with thickness of the femur and breast skin yield. Thus, theADIPOR1gene seems implicated in the metabolism and/or fat deposition and bone integrity in broilers.
Introduction
The chicken (Gallus gallus) was one of the first domestic animals sequenced and its genome assembly was completed in 2004 [1] by the Washington University Genome Sequence Center and the National Human Genome Research Institute of the United States of America.Gallus gallusgenome has 38 pairs of autosome chromosomes (5 macrochromosomes, 5 intermediates
a11111
OPEN ACCESS
Citation:Cruz VARd, Schenkel FS, Savegnago RP, Grupioni NV, Stafuzza NB, Sargolzaei M, et al. (2015) Association of Apolipoprotein B and Adiponectin Receptor 1 Genes with Carcass, Bone Integrity and Performance Traits in a Paternal Broiler Line. PLoS ONE 10(8): e0136824. doi:10.1371/journal. pone.0136824
Editor:Roberta Davoli, University of Bologna, ITALY
Received:October 3, 2014
Accepted:August 9, 2015
Published:August 31, 2015
Copyright:© 2015 Cruz et al. This is an open access article distributed under the terms of the
Creative Commons Attribution License, which permits unrestricted use, distribution, and reproduction in any medium, provided the original author and source are credited.
Data Availability Statement:The phenotypic and genomic data used in this study belong to the Brazilian Agricultural Research Corporation (EMBRAPA). Access to the data is available upon request by contacting Dr. Mônica Côrreia Ledur (
[email protected]). The authors confirm that all interested researchers will be able to access the data in the same way as the authors of this study.
Funding:VARC would like to thank the
and 28 microchromosomes) and one pair of sex chromosomes, Z and W [2], with a total of 1.2 Gbp. At 2.5–21 cM/Mb, depending on the chromosome, recombination rates are higher in chickens than in humans or rats, which average 1 cM/Mb and 0.5 cM/Mb respectively [3]. This, plus the great diversity among breeds and strains, has madeGallus gallusan animal model for studying the genetic basis of phenotypic traits, capitalizing on the possibility of detecting more segregation than in other species.
Many traits of economic interest are complex and determined by a number of unknown genes.Locithat control quantitative traits (QTL) have been associated with a number of traits in chickens, including growth, body composition, egg production, antibody production, disease resistance, and behavior. However, determining causative genes of phenotypic variation is diffi-cult, since eachlocuscontrols only a fraction of the phenotypic variance of a given trait [3].
Among the molecular markers, single nucleotide polymorphisms (SNPs) are promising for association studies. These markers are abundant and exhibit low mutation rates, which facili-tates genotyping [4]. Many studies have been done on the association between SNPs in candi-date genes and metabolic pathway in several species [5–10]. Wong et al. [11] identified 2.8 million SNPs in the chicken genome. This abundance of available SNPs may aid in the map-ping of causative polymorphisms underlying complex traits in chickens in the future.
Studies on Apolipoprotein B have identified its role in lipid metabolism. This glycoprotein plays an important part in the absorption, assembly and secretion of lipids, including triglycer-ides and cholesterol. In chickens, Apolipoprotein B is the main component of IDL (intermedi-ate density lipoprotein) and VLDL (very low density lipoproteins) present in plasma
cholesterol [12]. In rats and mice, Apolipoprotein B was found in several forms and with diverse functions at different ages by Mcleod et al. [13], who also reported that Apolipoprotein B48, a protein only half the size of Apolipoprotein B100, could mediate both assembly and secretion of chylomicrons (in the intestine) and VLDL (in the liver). In chickens, the Apolipo-protein B (APOB) gene may be related to early body growth rates and fat deposition [14].
Another candidate gene associated with fat metabolism in chickens is Adiponectin (ADIPO). Adiponectin exerts its action by binding to two specific receptors,ADIPOR1and ADIPOR2. BothADIPOR1andADIPOR2are seven transmembrane receptors that are struc-turally and functionally distinct from G-protein-coupled receptors [15]. Adiponectin receptor 1, encoded by theADIPOR1gene, is a major adiponectin receptor that mediates the glucose and lipid metabolism-related effects of adiponectin on target cells [16]. Research based on ani-mal models has shown thatADIPOR1overexpression can increse the biological effects of adi-ponectin [17].
There is evidence that visceral adiposity or age influences the adiponectin plasma levels in chickens. According to Kershaw and Flier [18], the biological effects of adiponectin depend not only on the relative concentrations in circulation and the properties of the different adiponec-tin subtypes, but also the specific expression of the subtypes on their respective tissue receptors. Maddineni et al. [19] confirmed their presence in skeletal muscle, diencephalon, pituitary gland, liver, ovary and kidney. In addition,ADIPOgene may be associated with the initiation and growth processes of adipose tissue deposition in chickens [20,21].
There are several studies investigating metabolic and genetic mechanisms regulating fat deposition in chickens [22]. Broilers are genetically selected for body weight and muscle growth. However, this genetic selection also leads to an unwanted increase in visceral adiposity [23,24]. In human studies, fat has been associated to bone disorders [25] and cardiovascular diseases [26] and there is evidence of the interconnection of both these metabolic problems in modern broiler production.
Given the genetic selection process that modern broilers are subject to, it is important to understand both the direct and indirect influence ofAPOBandADIPOR1genes on the
de Amparo à Pesquisa do Estado de São Paulo”
(FAPESP). NVG was supported by fellowship from CAPES and“Brazilian Agricultural Research Corporation Swine and Poultry’(EMBRAPA). NBS was supported by postdoctoral fellowship from National Counsel of Technological and Scientific Development (CNPq). DPM was supported by productivity research fellowship from CNPq. The funders had no role in study design, data collection and analysis, decision to publish, or preparation of the manuscript.
development of birds. Therefore, the object of this study was to investigate the association of the SNPs in theAPOBandADIPOR1genes with carcass, bone integrity and performance traits in broilers. In addition, two different statistical methodologies were used in order to confirm possible associations.
Material and Methods
Ethics Statement
This study was performed with the approval of the Embrapa Swine and Poultry Ethical Com-mittee for Animal Use (CEUA) under protocol number 011/201, following international guide-lines for animal welfare.
Population and the collection of data
Phenotypic records were obtained from 1,454 animals from a paternal lineage of broilers. This line has been developed and is owned by the Poultry Genetic Improvement Program from EMBRAPA Swine and Poultry (Brazilian Agricultural Research Corporation,https://www. embrapa.br/en/home). The experimental research centre is located in the city of Concórdia (27° 14' 03" S—52° 01' 40" W), Santa Catarina state, Brazil. This line of broilers has been under development since 1992 and aims to: increase body weight and carcass yield; improve viability, fertility, hatchability, feed conversion, and reduce abdominal fat. The original population was randomly sampled and then 20 males and 100 females were mated to produce an initial popu-lation of approximately 1,500 animals.
The birds were housed collectively until 35 days of age and then, in order to evaluate feed conversion, were moved to individual cages from 35 to 41 days. The birds were banded for identification, and fed a three-phase diet; starter from the 1stto 21stday (21% crude protein and 3,150 kcal metabolizable energy), grower from the 22ndto 34thday (20% protein gross and 3,200 kcal metabolizable energy) and finisher from the 35stto 41stday (18.5% crude protein and 3,200 kcal metabolizable energy).
The birds were slaughtered at 42 days of age following a 6 hour fasting. Cervical dislocation was manually applied before bleeding of the neck. Blood samples were taken for DNA extrac-tion during bleeding. Approximately 2 mL of blood was collected in microtubes with 100 mL (10% v/v) of 0.5 M EDTA anticoagulant. The samples were immediately packed in ice and then stored in a freezer at -20°C.
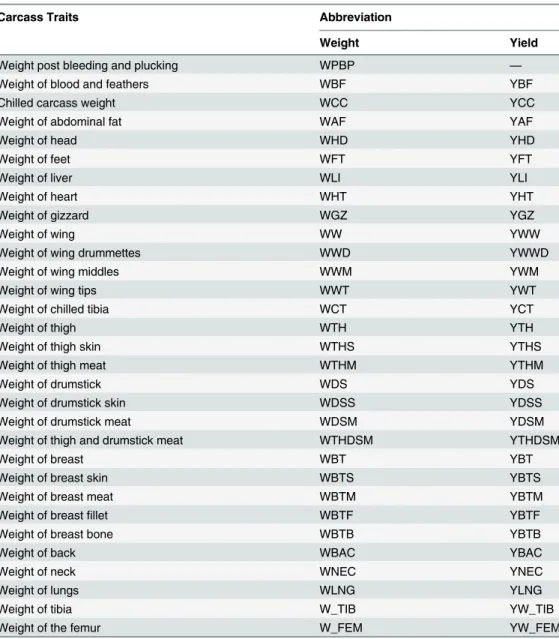
Eighty-five traits related to performance, carcass composition, organs and bone integrity were evaluated (Tables1and2). Yields were expressed as a percentage of the dressed weight relative to the 42 days live weight. An arcsin transformation was applied to the yield traits to normalize theirs distributions. Feed conversion ratio was calculated by dividing feed intake by weight gain in the period from 35 to 41 days of age.
After bleeding, the animals were scalded in a hot water bath (60°C for 45 s) and the feathers removed mechanically. The carcass weight was calculated by removing the feathers, blood, head, feet, and organs, except the lungs and kidneys. The carcass cuts (breast, drumsticks and thighs with bones and without skin, wings, neck, and back, which corresponds to the dorsal portion of the carcass) were individually weighed. Weight of muscle cuts, separated from skin and bones, and weight of skin with fat were also recorded.
Technologies Corporation). The bones were placed in the same position, with the ends resting on two supports spaced 30 mm. The probe travelled 20 mm after touching the sample at 2.00 mm/s test and pretest speed, and 20.00 mm/s post-test speed. The probe touched the sample with programmed weight force of 500 mg. This force was applied to the central area (diaphysis) to determine the flexural strength and rupture modulus. After breaking, the bone fragments were placed in plastic bags, labeled with the sample number and stored at 0°C for 24 hours to determine dry matter and ash.
To determine percent dry matter, the bone fragments were left at room temperature for about one hour. Subsequently, they were placed in pre-weighed porcelain crucible and kept in an oven at 105°C for 16 hours, and then, placed in a desiccator until they reach room temperature and Table 1. Carcass traits and corresponding abbreviations used for weight and yields recorded in the broiler line.
Carcass Traits Abbreviation
Weight Yield
Weight post bleeding and plucking WPBP —
Weight of blood and feathers WBF YBF
Chilled carcass weight WCC YCC
Weight of abdominal fat WAF YAF
Weight of head WHD YHD
Weight of feet WFT YFT
Weight of liver WLI YLI
Weight of heart WHT YHT
Weight of gizzard WGZ YGZ
Weight of wing WW YWW
Weight of wing drummettes WWD YWWD
Weight of wing middles WWM YWM
Weight of wing tips WWT YWT
Weight of chilled tibia WCT YCT
Weight of thigh WTH YTH
Weight of thigh skin WTHS YTHS
Weight of thigh meat WTHM YTHM
Weight of drumstick WDS YDS
Weight of drumstick skin WDSS YDSS
Weight of drumstick meat WDSM YDSM
Weight of thigh and drumstick meat WTHDSM YTHDSM
Weight of breast WBT YBT
Weight of breast skin WBTS YBTS
Weight of breast meat WBTM YBTM
Weight of breastfillet WBTF YBTF
Weight of breast bone WBTB YBTB
Weight of back WBAC YBAC
Weight of neck WNEC YNEC
Weight of lungs WLNG YLNG
Weight of tibia W_TIB YW_TIB
Weight of the femur W_FEM YW_FEM
Weight in grams and yield in %.
weighed. The dry matter percentage was determined as the ratio of the dry weight to the wet weight of the samples.
Ash was determined immediately after obtaining the dry matter, using the bone fragments. The samples were incinerated in a muffle for six hours. The initial temperature was 350°C for one hour and increased gradually to 450°C and 550°C for one hour and, finally, to 600°C for three hours. Then, the crucibles with the samples were left in the desiccator until reaching room temperature and then weighed. The ash percentage was determined by dividing ash weight by the dry weight of the sample.
Extraction and quantification of DNA
DNA extraction was performed using the DNAzol reagent (Invitrogen) according to manufac-turer recommendations. After extration, the DNA was resuspended in 150μL ultrapure water,
incubated at 37°C for one hour in a water-bath and stored in a freezer at -20°C. A spectropho-tometer (Eppendorf BioPhospectropho-tometer) was used to quantitate the DNA and then, the samples were diluted with ultrapure water to the concentration of 25 ng/μL.
Table 2. Bone integrity and bird performance traits recorded in the broiler line andcorresponding abbreviations used.
Trait Abbreviation
Bone integrity traits
Tibia length LG_TIB
Thickness of the tibia THK_TIB
Femur length LNG_FEM
Thickness of the femur THK_FEM
Curvature of the femur SCORE
Force required to break the femur FEM_FORCE
Length of the femoral break FEM_LNG
Area of the femoral break FEM_AREA
Force required to break the tibia TIB_FORCE
Length of the tibial break TIB_LNG
Break area of the tibia TIB_AREA
Dry matter content of the femur FEM_DM
Dry matter content of the tibia TIB_DM
Ash content of the femur FEM_ASH
Ash content of the tibia TIB_ASH
Performance traits
Weight at hatching WHTC
Weight at 21 days of age W21
Weight at 35 days of age W35
Weight at 41 days of age W41
Weight at 42 days of age W42
Feed intake 35 to 41 days of age FI35_41
Weight gain 35 to 41 days of age WG35_41
Feed conversion 35 to 41 days of age FC35_41
Gene amplification and genotyping
Specific regions of theAPOBandADIPOR1genes were amplified with primers for the identifi-cation of SNPs. One pair of primers, including regions of exons and introns, was designed for each gene (Table 3). To identify SNPs, gene fragments were sequenced on ABI 3130XL (Applied Biosystems) and subsequently analyzed with Phred/Phrap/Consed/PolyPhred software [27–
29]. One SNP per gene was chosen to be genotyped. The SNPs were selected based on the high-est sequencing quality and the highhigh-est informativeness, i.e. the most polymorphic ones. The PCR protocols for amplication of DNA fragments were standardized as described inTable 3.
To amplify DNA fragment ofAPOBgene, a PCR reaction was performed in 25μL
contain-ing 1X reaction buffer, 2.5 mM of MgCl2, 0.4 mM dNTPs, 0.24μM of each primer, 1.5 U of
Taq DNA Polymerase enzyme (Invitrogen, San Diego, CA), and 50 ng of genomic DNA, and finally adjusting the volume to 25μL by adding ultrapure water. A similar reaction was used
for the primerADIPOR1, but 1.6 mM MgCl2was used instead. The PCR reactions were carried
out in BigDye Terminator v3.1 Cycle Sequencing Kit (Applied Biosystems, Foster City, CA) using a touchdown PCR protocol under the following condition: denaturing at 94°C for 5 min-utes, followed by 35 cycles of denaturing at 94°C for 1 minute, annealing at 59°C for 1 minute and extension at 72°C for 1 minute. The final extension was performed at 72°C for 10 minutes. Electrophoresis using 1% agarose gel was done to visualize the final product.
After PCR, a cleavage reaction was performed with specific restriction enzymes. The NEB-cutter program [30] was used to identify the restriction sites and specific enzymes for the selected SNP. EnzymeMslIwas selected for the evaluation of the SNPs in fragment amplified by the primers forAPOB, whereas enzymeHhaIwas selected for analysis of the SNP in the fragment amplified by the primers forADIPOR1.
The cleavage protocol for each enzyme was:
MslI: Each reaction used 2μL of the PCR product with 1μL of 10X buffer; 1U enzymeMslI,
and ultrapure water was added to reach 10μL. The thermal cycler conditions were: one
cycle at 65°C for 3.5 hours, followed by one cycle at 80°C for 20 minutes.
HhaI: Each reaction used 2μL of PCR product in 2μL of 10X buffer; 1U enzymeHhaI, and
ultrapure water added to a final volume of 10μL. The reaction occurred in a water bath at a
temperature of 37°C overnight.
Finally, the digestion reaction was visualized using a 2% agarose gel stained with 0.01% ethidium bromide. The samples and molecular markers (100 bp DNA Ladder—Promega Cor-poration) were loaded on the gel and subjected to electric current at 100 V for about a half hour in 1X TBE (Tris-Borate-EDTA). A UV transilluminator was used to compare the sample band pattern to the 100 bp marker bands.
Both phenotypic and genotypic data used in this study are available upon request to Dr. Mônica Côrreia Ledur (Embrapa Swine and Poultry. Address: Rodovia BR-153, Km 110, Dis-trito de Tamanduá Caixa Postal: 21 CEP: 89700–000, Concórdia, Santa Catarina, Brazil).
Table 3. Primer sequence, GenBank accession number, chromosome position, and size of amplicons.
Primers Primer Sequence GenBank accession number Chromosome (position) Amplicon
APOB-F 5’-CTGCCAAAGACTTGCTGTTGGGTT-3’ NC_006090.3 GGA3 (101882031–101916285 bp) 1,099 bp
APOB-R 5’-TCTGTGAGGCGTGTAACCAAGTCA-3’
ADIPOR1-F 5’-CCATGCCACACAAATGTGGGTTCT-3’ NC_006113.3 GGA26 (1088478–1094154 bp) 1,023 bp
ADIPOR1-R 5’-TGATGTGACTGGAACTGCAGGGA-3’
Statistical analyses
Preliminary analyses, including descriptive statistcs, normality test and testing of fixed effects to be included in the models, were done using theUNIVARIATEandGLMprocedures in the Statistical Analysis System (SAS) software [31]. Outliers were identified using Box-plot and were removed from the data set. The descriptive statistics of the studied traits are inTable 4. Genotypic and allelic frequencies were calculated by counting the genotypes and alleles for each SNP and Hardy-Weinberg equilibrium was tested using a chi-square test at 5% signifi-cance level.
The association of SNPs with the traits was investigated using two different methods: Restricted maximum likelihood via ASREML [32] and Generalized quasi-likelihood scoring (GQLS; [33]).
Restricted maximum likelihood method. The ASREML software was used to fit the
fol-lowing univariate linear model for all the traits, which included additive and dominant effects of the SNP markers:
yijk¼mþsexjþinckþ
X
2l¼1
b1lx1lþ
X
2l¼1
b2lx2lþaiþeijk;
where:
yijkis observation for the trait on the ithanimal,
μis the overall mean,
sexjis the fixed effect of the jthsex (j = 1, 2),
inckis the fixed effect of the kthhatch (k = 1, 2, 3, 4, 5),
x1l,x2lare the recoded genotypes (-1, 0, or 1) and (0, 1 or 0) for the lthSNP, i.e. genotypes
AA, AT and TT of theAPOBgene and CC, CT and TT of theADIPOR1gene, respectively, β1l,β2lare the linear regression coefficients (additive and dominance effects, respectively) for the lthSNP,
aiis the random additive genetic (polygenic) effect of the ithanimal,
andeijkis the residual random effect for the ithanimal.
An alternate model was also fit using ASREML to directly estimate the allele substitution effect of the SNPs:
yijk¼mþsexjþinckþ
X
2l¼1
blxlþaiþeijk;
where:
yijkis observation for the trait on the ithanimal,
μis the overall mean,
sexjis the fixed effect of the jthsex (j = 1, 2),
inckis the fixed effect of the kthhatch (k = 1, 2, 3, 4, 5),
xlis is the number of copies of a given allele in the genotype of the lthSNP (counted as -1, 0,
1) for genotypes AA, AT and TT of theAPOBgene and for genotypes CC, CT and TT of the ADIPOR1gene, respectively,
βjis the linear regression coefficient (allele substitution effect) for the lthSNP, aiis the random additive genetic (polygenic) effect of the ithanimal,
andeijkis the residual random effect for the ithanimal.
Table 4. Descriptive statistics for the studied traits.
Trait1 N Mean2 SD CV (%) Minimum Maximum
WHTC 1448 47.66 3.70 7.77 37.40 61.80
W21 1426 648.43 133.91 20.65 256.00 1034.00
W35 1450 1730.96 202.59 11.70 776.00 2444.00
W41 1443 2219.20 251.91 11.35 1026.00 2922.00
W42 1452 2223.86 260.24 11.70 988.00 2971.00
FI35_41 1443 1091.45 152.48 13.97 508.00 1590.00
WG35_41 1439 488.77 106.57 21.80 128.00 802.00
FC35_41 1439 2.31 0.47 20.16 1.42 5.25
WPBP 1445 2055.89 247.42 12.03 901.00 2764.00
WBF 1441 168.55 26.37 15.65 82.00 293.00
WCC 1436 1639.06 202.05 12.33 661.20 2212.00
WAF 1435 47.36 14.08 29.73 2.50 94.00
WHD 1428 52.55 7.31 13.91 27.90 77.20
WFT 1424 74.66 13.71 18.36 34.30 110.10
WLI 1422 52.34 8.73 16.68 25.40 82.40
WHT 1421 12.40 2.15 17.35 6.30 19.70
WGZ 1423 32.00 6.04 18.86 17.80 56.10
WW 1422 167.40 20.00 11.95 72.00 236.40
WWD 1432 85.71 11.17 13.03 35.80 121.00
WWM 1425 61.91 7.98 12.89 26.20 87.80
WWT 1433 19.78 2.94 14.87 10.00 31.80
WCT 1432 55.65 10.24 18.40 25.40 85.40
WDS 1421 205.87 31.24 15.17 86.20 306.60
WDSS 1427 17.30 4.38 25.31 5.40 36.60
WDSM 1429 132.98 20.67 15.55 52.80 208.00
PFEM 1434 32.51 5.57 17.14 18.00 56.60
WTH 1430 46.23 9.77 21.14 11.60 87.60
WTHS 1427 310.49 46.11 14.85 113.60 464.40
WTHM 1431 231.75 37.78 16.30 81.40 351.20
WBT 1426 500.76 63.48 12.68 211.30 710.80
WBTS 1431 31.38 6.78 21.60 8.40 61.70
WBTM 1431 294.07 42.66 14.51 123.70 428.60
WBTF 1434 77.55 11.85 15.28 35.70 119.10
WBTB 1435 97.91 15.02 15.34 43.50 152.70
WBAC 1425 263.95 35.84 13.58 120.40 370.70
WNEC 1432 119.37 21.52 18.02 35.60 200.40
WLNG 1430 15.31 3.06 19.98 6.60 24.60
WTHDS 1414 516.41 73.98 14.33 200.20 736.60
WDSTHM 1426 364.69 55.91 15.33 137.20 529.40
W_TIB 673 11.75 2.11 17.99 7.14 17.82
W_FEM 672 8.51 1.37 16.08 4.41 12.68
LG_TIB 673 95.29 3.86 4.05 80.00 106.20
THK_TIB 673 8.76 0.92 10.51 6.00 12.90
THK_FEM 673 8.86 0.73 8.26 7.00 11.43
LNG_FEM 672 69.56 3.09 4.45 59.30 78.00
SCORE 673 1.13 0.34 29.94 1.00 2.00
FEM_FORCE 672 28.69 5.78 20.15 13.45 52.68
Generalized quasi-likelihood score method. The Generalized Quasi-Likelihood Score (GQLS) method developed by Feng et al. [33], which uses a logistic regression model to associ-ate the genotypes (treassoci-ated as the response variable) with the traits phenotypes adjusted for fixed effects (sex and hatching) was also used an alternative statistical method.
In the GQLS method a logistic regression is used to associate the expected frequency of a marker allele (μj) with the trait phenotypes (Xi):
mj ¼EðYijXiÞ ¼
eb0þb1Xi
1þeb0þb1Xi;
where:
β0is the intercept andβ1is the linera regression coefficient,
μjis expected allele frequence of the jthSNP,
Yiis proportion of the allele 1 in the observed genotype of the ithanimal for jthSNP,
Xiis the phenotypic observation of the ithanimal.
The GQLS method accounts for the relatioships among animals through the numerator relationship matrix [33].
The significance of statistical tests needs to be adjusted for multiple hypotheses test, such as in the case of a large number of traits tested in this study. Adjustments can be made by the Bon-ferroni correction [34]. However, Bonferroni adjustment assumes that all tests are indepen-dent. A principal component analysis of the correlation matrix among the 85 traits analyzed in this study was performed using the PRINCOMP procedure in SAS software [31]. The first 31 principle components explained 99% of the total variance. The comparison-wise significance level for Bonferroni adjusment was thenα/31, where 31 was considered the effective number of independent tests [35]. An experimental(trait)-wise significant level of 5% was considered to declare a significant association, while a 15% level was considered as a trend for association.
Results
The two SNPs were found segregating with intermediate allele frequencies and showed high heterozygosity in the broiler line considered (Table 5). The heterozygote frequency was 57.4% (762 animals) for the SNP in theAPOBgene and 56.5% (763 animals) for the SNP in the ADI-POR1gene. Test for Hardy-Weinberg equilibrium showed an excess of heterozygotes
Table 4. (Continued)
Trait1 N Mean2 SD CV (%) Minimum Maximum
FEM_LNG 672 2.97 1.15 38.83 1.51 15.74
FEM_AREA 672 42.69 17.33 40.60 11.20 135.74
TIB_FORCE 673 32.06 7.95 24.78 12.86 58.46
TIB_LNG 673 3.62 1.15 31.62 1.90 15.06
TIB_AREA 673 67.96 24.33 35.80 20.21 163.30
FEM_DM 673 51.74 3.53 6.82 43.29 62.86
TIB_DM 672 50.49 3.40 6.73 39.52 64.03
FEM_ASH 673 21.34 1.54 7.20 15.32 28.60
TIB_ASH 673 22.18 1.46 6.58 17.58 28.03
1The names of the traits were defined in Tables1and2.
2Means of weight (in grams), yields (in percentage), force (in kgf/mm2) and thickness (in cm).
N: number of animals; SD: standard deviations; CV: coefficient of variation.
(P<0.01), indicating that the population was not in Hardy-Weinberg equilibrium. For the APOBSNP, the T allele was more frequent than the A allele, while for theADIPOR1SNP, the C allele was more frequent than the T allele (Table 5).
The traits WAF, YWW, YBAC, WNEC, YBTB, and YNEC were not significantly affected by sex (P>0.05) and the traits LG_TIB, LNG_FEM, THK_FEM and TIB_ASH were not signifi-canty affected by hatch (P>0.05). All other traits were significantly affected by sex and hatch (P<0.05).
Tables6and7shows the results for traits for which at least a trend of association with SNPs inAPOBandADIPOR1genes was found (P<0.10) at a comparison-wise level. These Tables also present results adjusted for multiple tests. After Bonferroni correction, only the SNP in ADIPOR1gene was significantly associated (P<0.05) with two traits (YBTS and THK_FEM) and showed suggestive association (P<0.15) with WBTS and FEM_FORCE using the REML method (Table 6).
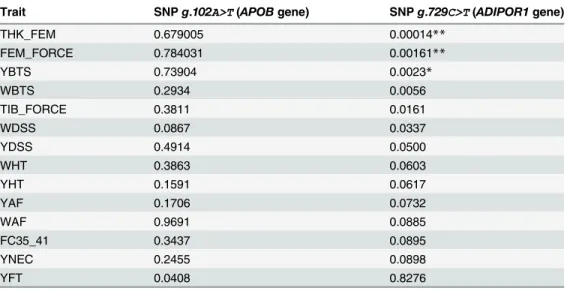
According to the analysis using the GQLS method, no significant associations with the SNP inAPOBgene were found too. The SNP in theADIPOR1gene remained associated with THAK_FEM, but also was significanty associated with FEM_FORCE (P<0.05), another bone integrity trait (Table 7).
Even though not significantly at an experimetal-wise level, several associations were found at a comparion wise level of 5%, including associations of the SNP inADIPOR1gene with TIB_FORCE, WDSS and YDSS (Tables6and7).
Discussion
Sex had no significant effect on abdominal fat, although Mignon-Grasteau et al. [36] reported that body weight selection contributes to an increase of sexual dimorphism. Fat depots are greater in females than in males, but this is caused mainly by the larger adipocytes found in females [37]. Differences between sexes for abdominal fat at 28, 35, 42 and 49 days were observed by Dalanezi et al. [38].
There were no reports in literature of sex effect on YWW, YBAC, WNEC, YBTB, and YNEC; and hatch effect on LG_TIB, LNG_FEM, THK_FEM and TIB_ASH traits.
The SNP in theADIPOR1gene showed a significant additive effect on YBTS and
THK_FEM, suggesting that this polymorphism may have a direct influence on fat deposition in the breast and bone integrity. This SNP showed an opposite additive effect on breast skin and in thickness of the femur (Table 6). This indicates that skin fat deposition in carcass cuts (breast) and bone quality may be altered in opposite directions if selection is conducted based on this SNP marker, what potentially might be beneficial, i.e. selecting for the favourable allele for bone integrity would lead to decrease in skin fat deposition. The suggestive asociations (P<0.15) of SNP in theADIPOR1gene with FEM_FORCE and WBTS also suggest that this gene may directly influence on fat deposition and bone integrity.
Table 5. Marker, number of animals (N), genotypic and allelic frequencies for the SNPs studied in the broiler line. Allelic and genotypic frequencies, percentages are between parentheses.
Marker N Genotype Allele
APOB g.102A>TSNP AA AT TT A T
1,328 188(14.1) 762(57.4) 378(28.5) 42.9 57.1
ADIPOR1 g.729C>TSNP CC CT TT C T
1,351 342(25.3) 763(56.5) 246(18.2) 53.6 46.4
Even though not significantly at an esperimetal-wise level associations of the SNP in the ADIPOR1gene with force required to break the tibia (TIB_FORCE), weight and yield of dram-stick skin (WDSS and YDSS) were observed, which corroborate with the significant associa-tions found with yield of breast skin (YBTS) and thickness of the femur (THK_FEM) and suggestive associations with weight of breast skin (WBTS) and force required to break the femur (FEM_FORCE).
No significant SNP association with live weights at different ages and with weights of vari-ous cuts was found. However, Hendricks et al. [20] found that young chickens (4 weeks old) had a set amount of plasma adiponectin and that age-related changes or fast growth could lead to the decline of circulating adiponectin levels.
Pisto et al. [39] reported that reduction in plasma adiponectin concentration is indicative of an increase in muscle fiber size. Fast-growing broilers have larger muscle fibers [40] and, there-fore, have a smaller amount of adiponectin in the blood. This may be the result of muscle Table 6. P-values (P) and estimates for additive (a) and dominant (d) effects on broilers traits from a genotypic model and from an allele substitu-tion (α) effect model with corresponding standard errors (se) for SNPs in theAPOBandADIPOR1genes, using restricted maximum likelihood method (traits are defined in Tables1and2).
Trait SNPg.102A>T(APOBgene) SNPg.729C>T(ADIPOR1gene)
Pa a(se) Pd d(se) Pα α(se) Pa a(se) Pd d(se) Pα α(se)
FI3541 0.176 0.014 20.47(8.25) 0.055 0.536 0.448 0.448
WDS 0.259 0.071 0.118 0.033 0.43(0.20) 0.883 0.030 0.43(0.20)
WBT 0.865 0.032 7.25(3.55) 0.775 0.535 0.756 0.486
WBTS 0.895 0.721 0.817 0.004* 0.88(0.04) 0.415 0.005 0.84(0.30)
WBTM 0.915 0.032 4.96(2.29) 0.569 0.918 0.457 0.896
THK_FEM 0.308 0.438 0.344 0.001** 0.143
(0.039)
0.041 -0.095 (0.046)
0.001** 0.1415 (0.0388)
FEM_FORCE 0.524 0.376 0.621 0.003* 1.072
(0.363)
0.569 0.004* 1.065
(0.363)
TIB_FORCE 0.269 0.067 -1.100
(0.596)
0.432 0.016 1.119
(0.460)
0.534 0.015 1.133
(0.462)
TIB_ASH 0.452 0.105 -0.1968
(0.1204)
0.603 0.229 0.047 0.222
(0.111)
0.213
YBF 0.088 0.0018
(0.0011)
0.094 -0.0020 (0.0012)
0.036 0.0022 (0.0011)
0.376 0.436 0.307
YCC 0.722 0.006 0.0031
(0.0011)
0.357 0.256 0.247 0.186
YDSM 0.090 -0.0008 (0.0005)
0.606 0.059 0.245 0.041 0.0010
(0.0005)
0.157
YDS 0.042 -0.0012 (0.0005)
0.440 0.022 -0.0012
(0.0005)
0.692 0.146 0.572
YW_FEM 0.459 0.403 0.372 0.327 0.028 0.0009
(0.0004)
0.200
YBTS 0.627 0.715 0.596 0.001** -0.0016
(0.0005)
0.191 0.002* -0.0016
(0.0005)
YBTM 0.941 0.028 0.0022
(0.001)
0.591 0.732 0.339 0.859
YBTF 0.469 0.033 0.0013
(0.0006)
0.788 0.907 0.924 0.930
**Significance at 5% experiment-wise level by Bonferroni correction.
*A trend of significance at 15% experiment-wise level by Bonferroni correction.
glucose uptake and nutrient deposition. Increasing dietary energy increases adiponectin gene expression in abdominal adipose tissue at 32 days of age, but there is no associated increase at 49 days of age [21]. This may explain the absence of an additive effect of SNPg.729C>Ton abdominal fat, if at 42 days of age the adiponectin concentration is lower, then it cannot have an effect on the deposition and/or metabolism of abdominal adipose tissue.
Studies in other species have observed relationships between adiponectin, adipose tissue and bone [41]. The exact way adiponectin works is not yet fully understood. However, it is known that other adipokines, such as leptin, which has a positive correlation with adipose deposition and metabolism, inhibits adiponectin production [25]. According to some authors, such as Sinsigalli et al. [42], Barbato et al. [24] and Gonzales et al. [43], the deposition of subcu-taneous and abdominal fat and skeletal disorders in broilers are associated with varying con-centrations of hormones. Furthermore, genes such asAPOBandADIPOR1and the neural control mechanisms of satiety and hunger that regulate feed intake also influence those traits.
The lack of association betweenADIPOR1and abdominal fat deposition may be due to its expression occurs at an early age, as reported in the literature [14,20,21] and, in this study, fat deposition was measured at 42 days of age. Another reason for the non association of ADI-POR1with abdominal fat may be due to the fact that this gene influences the deposition of dif-ferent fatty acids present in breast and drumstick fat. According Crespo and Garcia [44], abdominal fat contains more oleic acid, while the breast and thigh fat contains more stearic acid.
While the results of this study provided essential information and found that the SNP in the ADIPOR1gene was significantly associated with bone integrity and fat deposition in the breast its role in the chicken’s metabolism needs to be further studied before it can be used for genetic screening. The role of the adiponectin gene on metabolism must be better understood, as the intense selection pressure for increased body weight affects this hormone. Excess of adipose tis-sue increases the production of many adipokines that influence several bodily functions in birds.
Table 7. P-values for associations of SNPs in theAPOBandADIPOR1genes with broiler traits, using a Generalized Quasi-Likelihood Score method (traits are defined in Tables1and2).
Trait SNPg.102A>T(APOBgene) SNPg.729C>T(ADIPOR1gene)
THK_FEM 0.679005 0.00014**
FEM_FORCE 0.784031 0.00161**
YBTS 0.73904 0.0023*
WBTS 0.2934 0.0056
TIB_FORCE 0.3811 0.0161
WDSS 0.0867 0.0337
YDSS 0.4914 0.0500
WHT 0.3863 0.0603
YHT 0.1591 0.0617
YAF 0.1706 0.0732
WAF 0.9691 0.0885
FC35_41 0.3437 0.0895
YNEC 0.2455 0.0898
YFT 0.0408 0.8276
**Significance at 5% experiment-wise level by Bonferroni correction.
*A trend of significance at 15% experiment-wise level by Bonferroni correction.
The SNP in theADIPOR1gene is located in an intron region of the gene. According to Ninov et al. [45], when a SNP occurs in the intron region, it may not be involved directly with the associated trait, but may be connected to other polymorphims located in or around the coding and regulatory regions of the gene. This needs to be further investigated.
Conclusions
The SNPg.729C>Tin theADIPOR1gene was found associated with thickness of the femur and breast skin yield. Thus, theADIPOR1gene seems implicated in the metabolism and/or fat deposition and bone integrity in broilers. Further studies are warranted to elucidate if this SNP could be used as molecular genetic markers in broiler selection.
Acknowledgments
The authors would like to acknowledge Brazilian Agricultural Research Corporation Swine and Poultry (EMBRAPA) provided a financial support. Valdecy Aparecida Rocha Cruz was supported by fellowship from Coordination for the Improvement of Higher Education Person-nel (CAPES). Natalia Vinhal Grupioni was supported by fellowship from CAPES/EMBRAPA. Nedenia Bonvino Stafuzza was supported by postdoctoral fellowship from National Counsel of Technological and Scientific Development (CNPq). Rodrigo Pelicioni Savegnago was sup-ported by fellowship from São Paulo Research Foundation (FAPESP) (process n°2013/20091-0). Danísio Prado Munari was supported by productivity research fellowship from CNPq. The authors would also like to thank the Universidade Estadual Paulista“Júlio de Mesquita Filho” (UNESP), Campus de Jaboticabal, SP, Brazil and the University of Guelph for providing computational support for the statistical analyses.
Author Contributions
Conceived and designed the experiments: MCL JOP. Performed the experiments: JOP AMGI. Analyzed the data: VARC. Contributed reagents/materials/analysis tools: MS FSS. Wrote the paper: VARC. Results interpretation and manuscript revision: VARC DPM MS FSS MCL JOP AMGI RPS NBS NVG.
References
1. Wallis JW, Aerts J, Groenen MAM, Crooijmans RPMA, Layman D, Graves TA, et al. A physical map of the chicken genome. Nature. 2004; 432: 761–764. PMID:15592415
2. Crooijmans RPMA, Vrebalov J, Dijkhof RJM, Van Der Poel JJ, Groenen MA. Two-dimensional screen-ing of the wagenscreen-ingen chicken BAC library. Mamm Genome. 2000; 11: 360–363. PMID:10790534 3. Sawai H, Kim HL, Kuno K, Suzuki S, Gotoh H, Takada M, et al. The Origin and Genetic Variation of
Domestic Chickens with Special Reference to Jungle fowlsGallus g.gallusandG.varius. PLOS ONE. 2010; 5: e10639. doi:10.1371/journal.pone.0010639PMID:20502703
4. Chen X, Sullivan PF. Single nucleotide polymorphism genotyping: biochemistry, protocol, cost and throughput. Pharmacogenomics J. 2003; 3: 77–96. PMID:12746733
5. Jiang YL, Li N, Fan XZ, Xiao LR, Xiang RL, Hu XX, et al. Associations of T!A mutation in the promoter region of myostatin gene with birth weight in yorkshire pigs. Asian Australas J Anim Sci. 2002; 15: 1543–1545.
6. Li H, Deeb N, Zhou H, Mitchell AD, Ashwell CM, Lamont SJ. Chicken quantitative trait loci for growth and body composition associated with transforming growth factor-beta genes. Poult Sci. 2003; 82: 347–356. PMID:12705392
7. Zhang BZ, Lei MG, Deng CY, Xiong YH, Zuo B, Li FE. Association between PCR-RFLP polymorphism of the fifth intron in lipoprotein lipase gene and productive traits in pig resource family. Asian Australas J Anim Sci. 2005; 18: 458–462.
9. Meng HJ, Zhao G, Li ZH, Li H. Single nucleotide polymorphism on 81 peroxisome proliferators- acti-vated receptor genes associated with fatness traits in chicken. Asian Australas J Anim Sci. 2005; 18: 1221–1225.
10. Xu DQ, Xiong YZ, Liu M, Lan J, Ling XF, Deng CY, et al. Association analyses with carcass traits in the porcine KIAA1717 and HUMMLC2B genes. Asian Australas J Anim Sci. 2005; 18: 1519–1541. 11. Wong GK, Liu B, Wang J, Zhang Y, Yang X, Zhang Z, et al. A genetic variation map for chicken with 2.8
million single nucleotide polymorphisms. Nature. 2004; 432: 717–722. PMID:15592405
12. Hermier D, Forgez P, Chapman MJ. A density gradient study of the lipoprotein and apolipoprotein distri-bution in the chicken,Gallus domesticus. Biochim Biophys Acta. 1985; 836: 105–118. PMID:4027256 13. McLeod RS, Wang Y, Wang S, Rusiño LA, Links P, Yao Z. Apolipoprotein B sequence requirements for
hepatic very low density lipoprotein assembly. Evidence that hydrophobic sequences within apolipopro-tein B48 mediate lipid recruitment. J Biol Chem. 1996; 271: 445–455.
14. Zhang S, Li H, Shi H. Single marker and haplotype analysis of the chicken apolipoprotein B gene T123g and D9500D9- polymorphism reveals association with body growth and obesity. Poult Sci. 2006; 85: 178–184. PMID:16523611
15. Yamauchi T, Kamon J, Ito Y, Tsuchida A, Yokomizo T, Kita S, et al. Cloning of adiponectin receptors that mediate antidiabetic metabolic effects. Nature. 2003; 423: 762–769. PMID:12802337
16. Jin Z, Pu L, Sun L, Chen W, Nan N, Li H, et al. Identification of Susceptibility Variants in ADIPOR1Gene Associated with Type 2 Diabetes, Coronary Artery Disease and the Comorbidity of Type 2 Diabetes and Coronary Artery Disease. PLOS ONE. 2014; 9: e100339. doi:10.1371/journal.pone.0100339 PMID:24967709
17. Luo N, Chung H, Garvey WT, Fu Y. Overexpression of adiponectin receptor improves the phenotypes of tallyho diabetic mice. Diabetes. 2012; 61: A415.
18. Kershaw EE, Flier JS. Adipose Tissue as an Endocrine Organ. J Clin Endocrinol Metab. 2004; 89: 2548–2556. PMID:15181022
19. Maddineni S, Metzger S, Ocón O, Hendricks G 3rd, Ramachandran R. Adiponectin gene is expressed in multiple tissues in the chicken: food deprivation influences adiponectin messenger ribonucleic acid expression. Endocrinology. 2005; 146: 4250–4256. PMID:15976057
20. Hendricks GL 3rd, Hadley JA, Krzysik-Walker SM, Prabhu KS, Vasilatos-Younken R, Ramachandran R. Unique profile of chicken adiponectin, a predominantly heavy molecular weight multimer and rela-tionship to visceral adiposity. Endocrinology. 2009; 150: 3092–3100. doi:10.1210/en.2008-1558 PMID:19299452
21. Tahmoorespur M, Ghazanfari S, Nobari K. Evaluation of adiponectin gene expression in the abdominal adipose tissue of broiler chickens: feed restriction, dietary energy, and protein influences adiponectin messenger ribonucleic acid expresion. Poult Sci. 2010; 89: 2092–2100. doi:10.3382/ps.2010-00772 PMID:20852099
22. Wang HB, Li H, Wang QG, Zang XY, Wang SZ, Wang YX, et al. Profiling of chicken adipose tissue gene expression by genome array. BMC Genomics. 2007; 8: 193. PMID:17594506
23. Barbato GF. Genetic control of food intake in chickens. J Nutr. 1994; 124: 1341S–1348S. PMID: 8064382
24. Hood RL. The cellular basis for growth of the abdominal fat pad in broiler-type chickens. Poult Sci. 1982; 61: 117–121. PMID:7088775
25. Cao JJ. Effects of obesity on bone metabolism. J Orthop Surg Res. 2011; 6: 30. doi: 10.1186/1749-799X-6-30PMID:21676245
26. Libby P, Nathan D, Abraham K, Brunzell JD, Fradkin JE, Haffner SM, et al. Report of the National Heart, Lung, and Blood Institute-National Institute of Diabetes and Digestive and Kidney Diseases Working Group on Cardiovascular Complications of Type 1 Diabetes Mellitus. Circulation. 2005; 111: 3489–3493. PMID:15983263
27. Ewing B, Green P. Base-calling of automated using sequencer traces Phred. II, Error probabilities. Genome Res. 1998; 8: 186–194. PMID:9521922
28. Gordon D, Abajian C, Green P. Consed: A graphical tool for sequence finishing. Genome Res. 1998; 8: 195–202. PMID:9521923
29. Nickerson DA, Tobe VO, Taylor SL. PolyPhred: automating the detection and genotyping of single nucleotide substitutions using fluorescence-based resequencing. Nucleic Acids Res. 1997; 25: 2745–
2751. PMID:9207020
30. Vincze T, Posfai J, Roberts RJ. NEBcutter: A program to cleave DNA with restriction enzymes. Nucleic Acids Res. 2003; 31: 3688–3691. PMID:12824395
32. Gilmour AR, Gogel BJ, Cullis BR, Thompson R. ASReml User Guide Release 3.0 VSN International Ltd, Hemel Hempstead, HP1 1ES, UK 90p. 2009. Available:http://www.vsni.co.uk.
33. Feng BZ, Wong WWL, Gao X, Schenkel F. Generalized genetic association study with samples of related individuals. Ann Appl Stat. 2011; 5: 2109–2130.
34. Johnson RC, Nelson GW, Troyer JL, Lautenberger JA, Kessing BD, Winkler CA, et al. Accounting for multiple comparisons in a genome-wide association study (GWAS). BMC Genomics. 2010; 11: 724. doi:10.1186/1471-2164-11-724PMID:21176216
35. Gao X, Starmer J, Martin ER. A multiple testing correction method for genetic association studies using correlated single nucleotide polymorphisms. Genet Epidemiol. 2008; 32: 361–369. doi:10.1002/gepi. 20310PMID:18271029
36. Mignon-Grasteau S, Piles M, Varona L, Rochambeau H, Poivey JP, Blasco A, et al. Genetic analysis of growth curve parameters for male and female chickens resulting from selection on shape of growth curve. J Anim Sci. 2000; 78: 2515–2524. PMID:11048915
37. Vieira SL, Moran ET Jr. Broiler yields using chicks from egg weight extremes and diverse strains. J Appl Poult Res. 1998; 7: 339–346.
38. Dalanezi JA, Mendes AA, Garcia EA, Garcia RG, Moreira J, Paz ICLA. Efeito da idade da matriz sobre o desempenho e rendimento de carcaça de frangos de corte. Arq Bras Med Vet Zootec. 2005; 57: 250–260.
39. Pisto P, Santaniemi M, Turpeinen JP, Ukkola O, Kesäniemi YA. Adiponectin concentration in plasma is associated with muscle fiber size in healthy middle-aged men. Scand J Clin Lab Invest. 2012; 72: 395–
402. doi:10.3109/00365513.2012.687759PMID:22900744
40. Dransfield E, Sosnicki AA. Relationship between muscle growth and poultry meat quality. Poult Sci. 1999; 78: 743–746. PMID:10228972
41. Gonnelli S, Caffarelli C, Del Santo K, Cadirni A, Guerriero C, Lucani B, et al. The Relationship of Ghrelin and Adiponectin with Bone Mineral Density and Bone Turnover Markers in Elderly Men. Calcif Tissue Int. 2008; 83:55–60. doi:10.1007/s00223-008-9149-yPMID:18563283
42. Sinsigalli NA, Mcmurtry JP, Cherry JA, Siegel PB. Glucose tolerance, plasma insulin and immunore active glucagon in chickens selected for high and low body weight. The J Nutr. 1987; 117: 941–947. PMID:3295145
43. Gonzales E, Buyse J, Takita TS, Sartori JR, Decuypere E. Metabolic Disturbances in Male Broilers of Different Strains. 1. Performance, Mortality, and Right Ventricular Hypertrophy. Poult Sci. 1998; 77: 1646–1653. PMID:9835338
44. Ninov K, Ledur MC, Alves HJ, Rosário MF, Nones K, Coutinho LH. Investigation of leptin gene in broiler and layer chicken lines. Sci Agric. 2008; 65: 214–219.