www.ann-geophys.net/26/2825/2008/ © European Geosciences Union 2008
Annales
Geophysicae
The possible statistical relation of Pc1 pulsations to Earthquake
occurrence at low latitudes
J. Bortnik1, J. W. Cutler2, C. Dunson3, and T. E. Bleier3
1Dept. of Atmospheric and Oceanic Sciences, Room 7115 Math Sciences Bldg., UCLA, Los Angeles, CA 90095-1565, USA 2Department of Aerospace Engineering, 1320 Beal Ave., 3013 FXB Building, Ann Arbor, MI 48109-2140, USA
3QuakeFinder LLC., 250 Cambridge Ave., Suite 204, Palo Alto, CA. 94305, USA
Received: 4 April 2008 – Revised: 4 August 2008 – Accepted: 19 August 2008 – Published: 22 September 2008
Abstract. We examine the association between earthquakes and Pc1 pulsations observed at a low-latitude station in Park-field, California. The period under examination is∼7.5 years in total, from February 1999 to July 2006, and we use an automatic identification algorithm to extract information on Pc1 pulsations from the magnetometer data. These pulsa-tions are then statistically correlated to earthquakes from the USGS NEIC catalog within a radius of 200 km around the magnetometer, and M>3.0. Results indicate that there is an enhanced occurrence probability of Pc1 pulsations∼5–15 days in advance of the earthquakes, during the daytime. We quantify the statistical significance and show that such an en-hancement is unlikely to have occurred due to chance alone. We then examine the effect of declustering our earthquake catalog, and show that even though significance decreases, there is still a statistically significant daytime enhancement prior to the earthquakes. Finally, we select only daytime Pc1 pulsations as the fiducial time of our analysis, and show that earthquakes are∼3–5 times more likely to occur in the week following these pulsations, than normal. Comparing these re-sults to other events, it is preliminarily shown that the normal earthquake probability is unaffected by geomagnetic activity, or a random event sequence.
Keywords. Ionosphere (Mid-latitude ionosphere) – Magne-tospheric physics (Plasma waves and instabilities) – Radio science (Ionospheric propagation)
1 Introduction
Non-seismic precursors to earthquakes have been reported in the literature as early as the 1950s (Kalashnikov, 1954), and take on a variety of forms. Viewed as a whole, such Correspondence to:J. Bortnik
reported precursors can occupy almost any frequency range spanning from quasi-DC to visible light (e.g. Derr, 1973; Johnston, 1989; Parrot and Johnston, 1989; Park et al., 1993), occur over a range of timescales preceding the main shock spanning from minutes (Parrot and Lefeuvre, 1985) to years (Zhao and Qian, 1994), and exhibit a range of morpholo-gies which includes signal enhancement, attenuation, modu-lation, and spikes, in a bewildering variety of signals includ-ing electric, magnetic, and electromagnetic signals, resistiv-ity changes, anomalous ionospheric variations, radon gas re-lease, and others (e.g. Hayakawa et al., 2006, for a special issue dealing with recent progress in this area).
Perhaps it is not surprising then, that there have also been studies that report no correlation, or only occasional correla-tion between earthquakes and some of the phenomena previ-ously reported as precursors (Hendersen et al., 1993; Rodger et al., 1996, 1999; Clilverd et al., 1999). This lack of cor-relation could possibly be due to the fact that any potential precursors are strongly dependent on the local geology of the hypocenter (and hence appear differently in different re-gions, depths, and even times), they could be swamped by the natural background signal environment, may not occur in a repeatable way, or may not occur at all. To compli-cate matters further, even though many theoretical models to explain precursory phenomena have been proposed over the years (e.g. Brace et al., 1965; Nagata, 1970a, b; Hanks, 1974; Ishido and Mizutani, 1981; Dogloglou-Revelioti and Varot-sos, 1986; Morgan et al., 1989; Park et al., 1993; Molchanov et al., 2001; Pulinets and Boyarchuk, 2004; Freund, 2007) the mechanisms responsible for earthquake precursors are still understood rather poorly, making it difficult for exper-imentalists to conduct targeted observational campaigns.
Local time [hr]
Frequency [Hz]
5 10 15 20
0. 2 0. 4 0. 6 0. 8 1 1. 2 1. 4 1. 6 1. 8 2
log10(nT/Hz1/2)
−3 −2.8 −2.6 −2.4 −2.2 −2 −1.8 −1.6 −1.4 −1.2 −1
0 24
Parkfield M6.0 earthquake
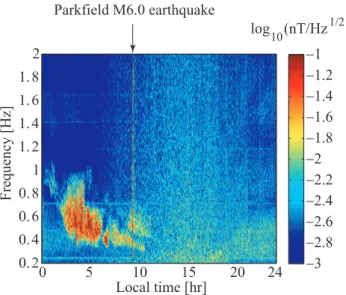
Fig. 1.Example of a Pc1 pulsation observed at the PKD search-coil magnetometer (see text) shortly before the M6.0 Parkfield earth-quake on 28 September 2004, 10:15:24 (PDT). The intense Pc1 pulsation is visible between 03:00–11:00 LT, andf=0.4−0.8 Hz. We note that local time is taken to be Pacific Standard Time (PST, i.e. UT−8) with no provision for daylight time adjustment.
observation (e.g. Fraser-Smith et al., 1990; Bernardi et al., 1991; Hayakawa and Molchanov, 2004; Hayakawa et al., 2007), and (ii) placing an instrument aboard an orbiting satel-lite, and thus observing the effects of numerous earthquakes (e.g. Larkina et al., 1983; Parrot and Lefeuvre, 1985; Parrot, 2006). The advantage of (i) over (ii), is that a specific re-gion can be observed continuously over a long time-period, and hence the natural background signal environment can be carefully assessed, and anomalous activity (potentially asso-ciated with earthquakes) more readily recognized. Another advantage is that the earthquakes in a given region would, presumably, all behave in a roughly similar manner (in terms of precursors), and hence some sort of repeatable precursory behavior might be identified. On the other hand, given the capricious nature of earthquakes, there might not ever be a large earthquake sufficiently close to the instrument to be in any way observable, or there may only be very few events if the instrument is operated for a long time. This naturally forces ground-based observationalists to conduct more event-based studies, which, while certainly suggestive, lack the as-surance of statistically significant repeatability. On the other hand, the advantage of (ii) is that the entire globe is essen-tially sampled for earthquakes on a daily basis, and hence many events could be observed in a relatively short period of time. The disadvantage of (ii) is that the satellite spends only a short period of time in any given location, so the earth-quakes are sampled only briefly from a variety of epicentral locations, possibly introducing large heterogeneity in precur-sory morphologies, and also earthquakes that might not ex-hibit any precursory behavior at all.
In an attempt to use the advantages of both approaches (long-term local characterization with a large number of events), in the present paper, we study a∼7.5 year record from a ground-based, search-coil magnetometer located in Parkfield, California, for possible association with earth-quakes. We focus our study on a particular signal type, Pc1 pulsations (Sect. 2), a common signal recorded at Park-field. We use an identification algorithm to automatically extract Pc1 pulsations (Bortnik et al., 2007) from our data (Sect. 3.1), which are then treated as point processes, and us-ing the statistical machinery of point processes, are related to earthquake occurrence within a certain radius of the mag-netometer (Sect. 4). We then attempt to quantify the signif-icance of our correlation (Sect. 5), and examine the effects upon this significance of declustering our earthquake cata-log (Sect. 6). We invert our superposed epoch analysis to calculate earthquake probability relative to Pc1 occurrence (Sect. 8), and summarize our conclusions (Sect. 9).
2 Background
An example of the signal type under study, a Pc1 pulsation, is shown in Fig. 1. It consists of a continuous magnetic pul-sation in the frequency rangef=0.2−5 Hz (defined as the Pc1 frequency band), usually lasting in the range of minutes to hours (Kangas et al., 1998). This pulsation began several hours prior to the M6.0 Parkfield earthquake that occurred on 28 September 2004 at 10:15:24 local time (PDT), shown in the figure as a vertical line at 09:15:24 (PST).
1970, p. 28), and concomitant minimum during the day. At low latitudes, Pc1 occurrence typically maximizes in the 2–7 days following the main phase of geomagnetic storms (Went-worth, 1964; Heackock and Kivinen, 1972). The number, frequency, and diurnal distribution of Pc1 pulsations also de-pends on a variety of factors including solar cycle phase, storm intensity, observation latitude, time after main phase, and pulsation type (structured/unstructured) (e.g. Kerttula et al., 2001a, b).
In this paper, we adopt as a hypothesis, the conceptual model that earthquake preparation processes alter the local ionosphere overhead, which in turn dramatically affects the transmission coefficient of the bottomside ionosphere (Field and Greifinger, 1965, 1966). This alteration leads to a change in the number and nature of Pc1 pulsations that leak through the ionosphere and are observed on the ground. The precur-sory effect of earthquakes on the local ionosphere overhead has been reported by a number of authors (e.g. Pulinets et al., 2003; Pulinets and Boyarchuk, 2004, for reviews), and since Pc1 transmission is very sensitive to bottomside char-acteristic, it can serve as a sensitive proxy to ionospheric modifications. Of course, this model is in no way defini-tive and any potential modification of Pc1 pulsations could occur in other ways, including being directly generated by strong electric currents near the hypocenter itself (Morgan et al., 1976; Ishido and Mizutani, 1981; Dogloglou-Revelioti and Varotsos, 1986; Freund, 2007).
3 Data description and Pc1 identification
3.1 Pc1 identification
To identify Pc1 pulsations, we use triaxial search-coil mag-netometer data recorded at Parkfield, California (desig-nated PKD), whose coordinates are: Geographic: (35.945◦, −120.542◦), CGM: (41.61◦, −56.8◦), dip: 60.2◦, declina-tion: 14.7◦, L-value: 1.77. We use data from the ∼ 7.5-year period, February 1999–July 2006. The Pc1 pulsations are automatically identified and characterized using a re-cently developed algorithm, described in detail by Bortnik et al. (2007). This algorithm consists of three broad steps:
1. Spectral peaks in a typical daily, dynamic spectrogram are identified, which exceed the daily background me-dian spectrum significantly (by a factor of∼10 in our case). Three key frequencies are recorded to describe each spectral peak: the bottom (fbotpk), top (ftoppk), and the frequency containing maximum wave power (fmaxpk ). 2. The spectral peaks in consecutive time-segments in the
dynamic spectrogram are grouped together to form in-dividual events. Spectral peaks need to satisfy a “spec-tral overlap” criterion, and be of a certain minimum du-ration (10 min in our case) to be counted as an event. Typical Pc1 events have durations from fractions of an
EMIC wave growth region
Ionosphere
L = 4
L = 6 Earth
1 2
(a)
3
Higher latitudes
Earth (b)
Hypocenter Surface effect
Iono-spheric effect
R Lower
latitudes
4 5
Fig. 2. A possible mechanism of Pc1 modulation by Earthquakes.
(a)The electromagnetic ion cyclotron (EMIC) wave is generated near the equatorial region in the magnetosphere (1), propagates roughly along the magnetic field line (2), enters the ionosphere at high latitudes (3) and propagates within the dense F-region of the ionosphere to low-latitudes.(b)During its meridional propaga-tion to low-latitudes (4), seismically active regions might affect the ionosphere in such a way as to change the bottomside transmission coefficient (5), resulting in anomalous Pc1 activity recorded at the receiver station R.
hour, to several hours, and spectral peaks shorter than 10 min are treated as be spurious noise in our analysis and discarded.
Local time [hours] 0 6 12 18 24
100 200 300 400
Time [days]
Local time [hours]
−300 −25 −20 −15 −10 −5 0 5 10
6 12 18 24
1 2 3 4 5 6
Number of Pc1
Relative probability
0 6 12 18 24
Local time [hr]
Num. Pc1
(a) (b)
(c)
0 400 800 1200 1600
DAY
Distance from PKD [km]
EQ magnitude
0 40 80 120 160 200 3
3.5 4 4.5 5 5.5 6
1 2 5 10 20 50 100
50 100 150 200 250 300
Number of Pc1
-2 -1 0 1 2 3 4 5
Rel. Prob.
(d)
(e)
(f)
Time [days]
−30 −25 −20 −15 −10 −5 0 5 10
Fig. 3. (a)Distribution of 8,193 Pc1 pulsations as a function of local time. (b)Distribution of 434 earthquakes during the period under consideration, as a function of magnitude, and distance from our search-coil. (c)Superposed epoch analysis of Pc1 events observed within−30 to+10 days of our 434 earthquakes, as a function of 1T and LT.(d)Relative probability of observing Pc1 pulsations in the same format as (c). (e)Number of Pc1 pulsations observed on the day side, 08:00–16:00 LT, corresponding to panel (c).(f)Same as (e), but corresponding to panel (d).
Although our Pc1 identification algorithm was developed for the full triaxial data set, and we have all three components available for the period under study, in the present work we have chosen to use only the two horizontal channels for Pc1 identification/characterization. This was done because we do not use polarization or orientation information in the present study (which would necessitate the vertical channel), and
re-sults in more robust Pc1 identification since the vertical coil is often more susceptible to local noises and contamination from underground reflections.
A total of 8,913 individual Pc1 events were identified in our∼7.5 year period, having a broad local-time (LT) occur-rence minimum at∼08:00–15:00, and maximum at∼23:00– 04:00. This is consistent with previous studies (Tepley, 1965) reported earlier (Bortnik et al., 2007) and shown in Fig. 3a. The mean duration of Pc1 events was ∼20 min, and fmaxpk ranged from 0.12–4.7 Hz, with a median and mean value of 0.44 and 0.8 Hz, respectively.
In this paper we present information only on Pc1 occur-rence, neglecting duration, frequency, and polarization infor-mation. The latter quantities were examined for any statisti-cal deviation from the norm, and none was found.
3.2 Earthquake catalog
In order to correlate Pc1 pulsations to nearby earthquakes, we used the United States’ Geological Survey (USGS) National Earthquake Information Center (NEIC) earthquake catalog (more information at http://neic.usgs.gov) to retrieve earth-quake events occurring over the same period as our magne-tometer data, and within a large radius (∼3000 km) surround-ing our magnetometer. In subsequent sections, only earth-quakes located within a radius of 200 km were used, but the inclusion of the larger initial radius was made in order to fa-cilitate declustering, discussed in Sect. 6.
4 Superposed epoch analysis
In order to examine the association between Pc1 occurrence and earthquakes, we perform a superposed epoch analy-sis spanning −30 days to +10 days about the earthquake time, comparable to a second-order moment in point-process statistics (e.g. Hsu and McPherron, 2002). For this purpose, we select earthquakes whose epicenters were within 200 km of the PKD search-coil, magnitudes larger than 3.0, and depth smaller than 50 km. This results in a list of 434 earth-quakes, spanning February 1999–May 2006, with a mini-mum and maximini-mum magnitudes of 3.1 and 6, median 3.5, minimum and maximum distances from PKD of 2.2 km and 200 km, median 72.6 km. The distribution of earthquakes is shown in Fig. 3b as a function of distance and magnitude, where it is evident that earthquake occurrence diminishes rapidly with increasing magnitude.
pronounced tendency of Pc1 pulsations to be observed in the night and dawn hours, due primarily to the larger degree of ionospheric attenuation experienced by Pc1 pulsations as they propagate from high latitudes to lower latitudes on the day side (e.g. Althouse and Davis, 1978; Jacobs, 1970, p. 28). From Fig. 3c there also appears to be no clear relation be-tween the earthquake time and Pc1 occurrence (although a slight decrease in events in the−2 to +2 days surrounding the earthquakes may be present).
While Fig. 3c is straightforward to interpret and shows im-portant absolute trends, it is nevertheless somewhat deficient in that it obscures how Pc1 occurrence behaves compared with its typical behavior. To address this issue, we derive the relative probability of Pc1 occurrence similar to Bortnik et al. (2008). First, the entire set of identified Pc1 pulsations is binned into 12 LT bins. The resulting histogram is shown in Fig. 3a, and is binned similarly in LT to the superposed epoch plot of Fig. 3c, and again underscores the strong diurnal vari-ation. The histogram in Fig. 3a is divided by the total number of days of instrument operation (corrected for any outages), to effectively obtain a long-term, daily occurrence probabil-ity of Pc1 pulsations. Similarly, the superposed epoch plot in Fig. 3c is normalized by the total number of earthquake events (434) to obtain a time-dependent probability of oc-currence, and then each column is normalized by the daily occurrence probability, resulting essentially in a distribution of Pc1 pulsation occurrence probability, as a function of1T and LT, relative to the long-term occurrence probability.
The resulting plot is shown in Fig. 3d, where it has now become evident that the relative probability of occurrence of Pc1 pulsations is significantly higher during the day time hours,∼5–15 days prior to the earthquake occurrence, by a factor of∼2–6. A few points should be noted about this fig-ure: firstly, the majority of values in the figure (especially near the night and dawn) are∼1, indicating that the occur-rence probability at those LT and1T bins is roughly similar to the long-term occurrence probability, and hence is likely unaffected by the earthquake events. Secondly, there is a clear difference in relative probability values prior to (neg-ative 1T), and post-earthquake occurrence (positive 1T). In the former region (1T <0), there is a clear increase in rel-ative occurrence probability, primarily in the daytime hours, whereas in the latter region (1T >0) the relative occurrence probability visibly drops to its long-term average. The rela-tive occurrence at1T <0 is not only large, but seems to be increasing as the earthquake approaches, reaching a maxi-mum at1T∼−5 days, and then decreasing again. Further-more, it is not only a matter of a few isolated1T-LT bins that have increased values, but a well-defined, connected re-gion of bins spanning the entire day side, over a number of consecutive days.
For clarity, we have integrated the number of Pc1 pulsa-tion in Fig. 3c from 08:00 to 16:00, and show the resulting line plot in Fig. 3e. Similarly, we averaged the relative oc-currence probability in Fig. 3d over the same LT interval and
show the line plot in Fig. 3f. In both panels (e) and (f), the increase of Pc1 pulsations during midday, ∼5–15 days ahead of the earthquake is clearly evident. We note that the 5-day timescale is consistent with the statistical ionospheric anomalies reported by Liu et al. (2006).
If we assume that this is a real, physical effect, it could be explained by the fact that during daytime hours the natural occurrence of Pc1 pulsations is relatively low, and hence if there is an addition of even a small number of Pc1 pulsations at all local times, it would show up as a much larger percent-age change during the daytime, than during the night. On the other hand, since we are dealing with a smaller number of Pc1 events during the day (although not as small as Fig. 3a might indicate, since we superpose 434 individual events), the increased probability observed at1T=−5 to−15 might be simply coincidental, and not physically significant. In the following section, we attempt to quantify the significance of the relative probability increase evident in Fig. 3d.
5 Tests of significance
The procedure for quantifying significance is illustrated in Fig. 4. In order to compare the probability of obtaining the results of Fig. 3d (reproduced in Fig. 4a) with pure chance, we generate a sequence of 434 events, distributed randomly during the Pc1 observation period (February 1999– July 2006), and perform the same analysis described in Sect. 4 above. The results are displayed in Fig. 4b, and show that the natural variation of relative probability is certainly higher during daytime hours, but is significantly smaller (<2) and more sporadic than the plot of Fig. 4a. As expected, there is no correlation of Pc1 occurrence probability with the ran-dom event sequence.
Next, we repeat the superposed epoch analysis with a ran-dom event sequence (as described above) 300 times, so that we are left with 300 plots like those of Fig. 4b. Since there is no correlation with the random event sequence, the values from every row of the random plots can be grouped together, giving us a sequence of (300×40=) 12 000 points for each of the 12 LT bins. It is these sequences which will be used to assess the significance of the results in Fig. 4a.
Time [days]
−30 −25 −20 −15 −10 −5 0 5 10
0 6 12 18 24
0 2 4 6 8 10
0 1 2 3 4 5 6
Local time [hours]
0 6 12 18 24
0 1 2 3 4 5 6
0 6 12 18 24
EQ (a) Earthquakes = 434
(b) Random events = 434
Relative prob.
Relative prob.
"Z"-value
(c) "Normalized" Earthquakes = 434
0 5 10 15 20 25 0
0.4 1 1.4
Local Time [days]
Std. Dev
Mean (d)
0 1 2 3
0 1000 3000 4000
Relative prob. 2000
0 1000 3000 4000
2000
Number of samples
µ = 0.985 σ = .0875 µ = 0.980 σ = 0.383
Relative prob.
(e)
(f)
Fig. 4. Significance test of Pc1 observations. (a)Relative probability of observing Pc1 pulsations with respect to earthquakes, (similar to Fig. 3d),(b) same as (a) with respect to 434 random events, (c)normalized relative probability(d) mean and standard deviation of random statistical sample,(e)histogram plot of random event distribution for LT=12:00–14:00 (highest variance), and(f)same as (e) for LT=00:00–02:00 (lowest variance).
turns out to be largest (σ=0.383), coincident with the mini-mum of Pc1 event occurrence in Fig. 3a. On the other hand, the mean is∼1 at all local times. We note that the choice of producing 300 random-event sequences was made so that the standard error of the mean would be∼0.01σ (i.e.σ/√N whereN=12 000). For reference, a 10-bar histogram of the Pc1 pulsation relative probability is plotted in Figs. 4e and f, corresponding to the highest and lowestσ LT bins, respec-tively.
Each of the columns of Fig. 4a is normalized by subtract-ing the appropriate LT mean, and dividsubtract-ing by the correspond-ing standard deviation (Fig. 4b), to give a plot of “Z” values as a function of LT and1T, i.e. relative probability of Pc1 occurrence, measured in standard deviations away from the mean. The results, shown in Fig. 4c, indicate that the day-time increase in Pc1 relative probability, at1T∼5 to 15 prior to the earthquake is very significant (Z>4σ) and is very un-likely due to chance. In addition to the daytime feature which was clear in Fig. 4a, there are additional regions of highZ that appear near the dusk and night sides, including a region
at1T <−27 which may or may not be associated with the
earthquake. Again, there is a clear difference in the Z val-ues between regions preceding the earthquake (1T <0) and those that occur after the earthquake (1T >0).
6 Effects of declustering
It has long been established that earthquakes tend to occur in well-defined clusters (Omori, 1895), which would affect the type of analysis presented above (since a single Pc1 pulsa-tion could be registered in associapulsa-tion with multiple, closely-spaced earthquakes). This effect could make the correlation appear far more significant than it actually is in reality, and further result in time-smearing.
DECLUSTER 2: 268 events, P = 0.8, Q = 40
0 0.5 1 1.5 2 2.5 3 DECLUSTER 1: 285 events, P = 0.95, Q = 10
0.5 1 1.5 2 2.5 Time [days]
Local time [hours]
NO DECLUSTER: 434 events
−30 −25 −20 −15 −10 −5 0 5 10 0
6 12 18 24
1 2 3 4 5 6
Time [days]
Local time [hours] 0−30 −25 −20 −15 −10 −5 0 5 10
6 12 18 24
Time [days]
Local time [hours] −300 −25 −20 −15 −10 −5 0 5 10
6 12 18 24
Relative probability
Relative probability
Relative probability
2 2.5 3 3.5 4
Time [days]
Local time [hours] −30 −250 −20 −15 −10 −5 0 5 10
6 12 18 24
Time [days]
Local time [hours] −300 −25 −20 −15 −10 −5 0 5 10
6 12 18 24
3 3.5 4 4.5 5 5.5 6
Time [days]
Local time [hours] −300 −25 −20 −15 −10 −5 0 5 10
6 12 18 24
2 2.5 3 3.5 4
"Z"-value
"Z"-value
"Z"-value
(a)
(c)
(e) (f)
(d) (b)
Fig. 5. Effect of declustering on significance. (a)No declustering (same as Fig. 4a),(b)significance of (a) (same as Fig. 4d),(c)typical declustering level, and(d)significance of (c),(e)aggressive declustering and(f)significance of (e).
probability plot of Figs. 3d and 4a, and panel (b) is the corre-sponding Z-value plot, similar to Fig. 4c but clipped between Z=3−6 to show only significant values.
In panel (c), we use the declustering algorithm with typi-cal values ofP=0.95 andQ=10, whereP andQdetermine the sizes of the spatial and temporal windows, respectively. The resulting earthquake list contains only 285 events, and the resulting distribution again shows a daytime maximum prior to the earthquake event. Comparing with panel (a), it is evident that the relative probability has decreased sub-stantially, showing that much of the correlation was due to the aftershocks. The region of high relative probability has shifted to slightly earlier times, now peaking in the region 1T∼10 to 20 days prior to the main shock. Also evident is the appearance of a slight drop in relative probability after the earthquake, at1T∼5 days. To assess the significance of the results in panel (c), we again compute the sequence of rela-tive probability values for each LT bin, this time using 285 random events for statistical uniformity, and repeating the procedure 300 times as before. The Anderson-Darling test is again applied to ensure normality. The normalized plot of
Z-values for the typical declustering parameters is shown in panel (d), where it is clear that there are regions of highZ, al-beit much lower than those in panel (b). We have clipped the color scale aboveZ=2, since 2σ roughly corresponds to the 5% significance level, so everything above it can be consid-ered significant. Interestingly, in panel (d) the region of high Zis not confined only to the day side, but extends across the entire LT range in the region of1T∼−20 to−10 days. We again note that there is a clear contrast in the Z values be-tween regions preceding the earthquake (1T <0) and those that occur after the earthquake (1T >0).
In the bottom row of Fig. 5, we perform a more aggressive declustering than normal, withP=0.8 andQ=40. The result-ing list of earthquakes contains 268 events, and the resultresult-ing relative probability plot and Z-value plot shown in panels (e) and (f) appear very similar to those of panels (c) and (d), respectively, with only minor differences. The region of in-creased Pc1 probability remains at roughly1T∼−15 to−10 days, and the contrast in Z-value behavior between1T <0
(a) 0-200 km, EQ: 434
0 6 12 18
24 (b) 200-400 km, EQ: 629
(c) 400-600, EQ: 855
0 6 12 18
24 (d) 600-800 km, EQ: 670
(e) 800-1000 km, EQ: 284
0 6 12 18
24 (f) 1000-1200 km, EQ: 280
(g) 1200-1400 km, EQ: 328
0 6 12 18
24 (h) 1400-1600 km, EQ: 202
Time [days] (i) 1600-1800 km, EQ: 364
-30 -20 -10 0 10
0 6 12 18 24
Time [days] (j) 1800-2000 km, EQ: 220
0 -20 -10 0 10
LT
0 2 4 6
Relative probability
Fig. 6. The effect of distance upon the relative occurrence prob-ability of Pc1 pulsations in relation with earthquakes. Radial dis-tance ranges increase in increments of 200 km from 0–200 km(a), to 1800–2000 km(j). The number of earthquakes is indicated in the title of each panel.
7 Effects of distance
To establish the spatial locality of our correlation, we exam-ine the effect of distance upon the relative occurrence proba-bility of Pc1 pulsations, relative to earthquakes in Fig. 6. In panel (a) we show the relative occurrence probability sim-ilar to Figs. 3d, 4a, and 5a, where earthquakes have only
been included in the radial range of 0−200 km around the PKD magnetometer. In subsequent panels, the radial range within which earthquakes are selected for the superposed epoch analysis is increased in increments of 200 km, from 200–400 km in panel (b) to 1800–2000 km in panel (j). Al-though there are spurious regions of enhanced relative prob-ability in many of the figures, such as panel (g) 1t∼−18 days and1t∼+10 days, or panel (i)1t∼+10 days, the rela-tive probability magnitudes are generally smaller than those in panel (a), and do not seem to show a systematic group-ing as do those in panel (a). It thus appears as though the enhancement of the Pc1 pulsations relative to the earthquake occurrence is limited to∼200 km around the magnetometer, or possibly slightly further as in panel (b). We do also note that the number of earthquakes within each radial range does vary, making the statistics within each panel non-uniform (al-though the variation is confined to a factor of∼2), so again we urge the reader to treat these results as being preliminary.
8 Earthquake probability
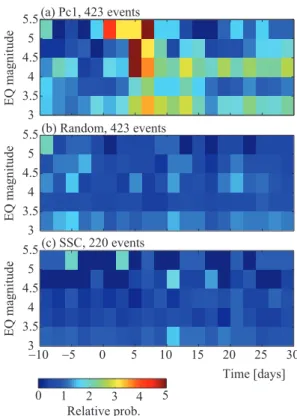
As a final analysis, we invert the superposed epoch procedure presented in Sect. 4, selecting only those Pc1 pulsations that occur between the local-times of 08:00 of 16:00 (giving 423 Pc1’s) as the fiducial times, and examining the probability of earthquake occurrence within a window of−10 days to+30 days about each midday Pc1 pulsation.
Earthquakes are binned as a function of time relative to the Pc1 pulsation (1TEQ), in 2-day bins, and magnitude, in 0.5 M bins, fromM=3.0 toM=5.5. After the initial distri-bution is obtained (analogous to Fig. 3c), it is normalized by the number of Pc1 pulsations, and number of days per bin (2 days/bin), resulting in a time-dependent occurrence prob-ability. The number of earthquakes in our observing period (February 1999–July 2006) is binned according to magni-tude (analogous to Fig. 3a) and divided by the number of observing days, to obtain a long-term daily occurrence prob-ability. The earthquake occurrence probability distribution is normalized column-wise by the daily occurrence probability, resulting in a relative probability of occurrence plot (analo-gous to Fig. 3d) which is shown in Fig. 7a. This figure indi-cates that, on average, the occurrence probability of a M4.0– M5.5 earthquake is roughly 5 times higher following a mid-day Pc1 pulsation, than it is normally (though the number of large earthquakes is rather low, cf. Fig. 3b). The occurrence probabilities of smaller earthquakes are also larger by factors of∼2–4 in the week following a midday Pc1 pulsation.
values are on the order of∼2, significantly lower than the values in panel (a).
Since it is well-known that Pc1 pulsations are associated with enhanced geomagnetic activity (Wentworth, 1964; Hea-cock and Kivinen, 1972; Bortnik et al., 2008), we test the possible connection between geomagnetic activity and earth-quakes directly. Shown in panel (c) is the result of a su-perposed epoch analysis, performed as above, but using a sequence of 220 storm sudden commencements (SSC’s) as the fiducial time. The results do not show any noticeable enhancement in the relative occurrence probability of earth-quakes associated with SSC’s. We have also used an au-tomatic algorithm to pick out 24 isolated storms directly from theDst index (Bortnik et al., 2008) and use the storm times as the fiducial times, performing the same superposed epoch analysis. The results (not shown), do not seem to show any correlation between geomagnetic storms and earth-quakes. We probed the connection betweenDst depressions and global seismicity further with a number of analyses (not shown), and again found no significant correlation.
The results presented in Fig. 7 suggest that even though Pc1 pulsations are strongly correlated with geomagnetic ac-tivity, and are also apparently well-correlated with earth-quakes, geomagnetic activity and earthquakes do not show any direct correlation. If the correlation of Pc1 pulsations and earthquakes is indeed real, as it appears to be, then those midday Pc1 pulsations that precede earthquakes probably originate from a source other than geomagnetic storms. The options which seem most likely are that the Pc1 pulsations are either generated within the earth, due to electric currents, or are generated by triggers other than geomagnetic storms, such as small storms, substorms, pressure pulses in the so-lar wind, or drifting fluxes of anisotropic protons from the plasmasheet (Olson and Lee, 1983; Kangas et al., 1986; En-gebretson et al., 2002) and it is indeed the modification of the bottomside ionosphere prior to the earthquake that alters the transmission of Pc1 pulsations from the ionosphere to the ground. As noted above, the timescales of Pc1 probability in-crease correspond to those of ionospheric modification (Liu et al., 2006), hinting at a possible connection.
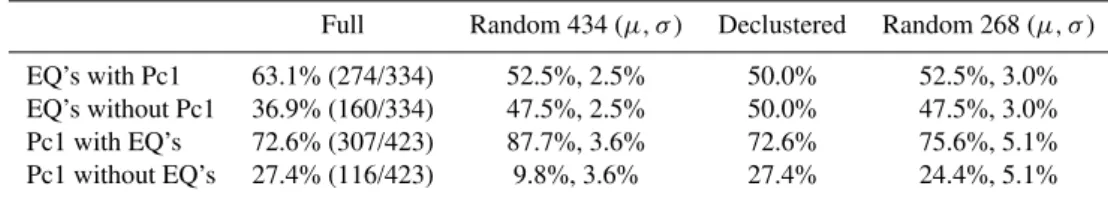
To assess whether the presence of midday Pc1 pulsations might be useful as a reliable indicator of imminent earth-quakes, we attempted to quantify the number of false posi-tive and negaposi-tive events. In order to do this, we again isolated only those Pc1 pulsations observed between 08:00 and 16:00, and counted the number of Pc1 pulsations that were followed by an earthquake within 2 weeks (within 200 km, M≥3) and vice versa. The results of this analysis are shown in Table 1, and indicate that roughly two thirds of Pc1 pulsations were followed by at least one earthquake event, a roughly similar fraction of earthquake events (274 of 434) were preceded by at least one Pc1 pulsation. For comparison, we performed a similar analysis on a random event sample of the same size as the earthquake list, repeated 300 times, and obtain an esti-mate for the mean and standard deviation (also shown in
Ta-EQ magnitude
3 3.5
4 4.5
5 5.5
Time [days]
−10 −5 0 5 10 15 20 25 30
(a) Pc1, 423 events
EQ magnitude
3 3.5
4 4.5
5 5.5
EQ magnitude
3 3.5
4 4.5
5 5.5
(b) Random, 423 events
(c) SSC, 220 events
0 1 2 3 4 5
Relative prob.
Fig. 7.Superposed epoch analysis of relative probability of observ-ing earthquakes, parameterized by time and earthquake magnitude, relative to(a)mid-day Pc1 events,(b)random event sequence, and
(c)Storm sudden commencements.
ble 1). While the random events occur roughly independently of Pc1 pulsations, it is interesting to note that it is quite likely (84%) to observe a random event, given a randomly selected midday Pc1 pulsation. This is most likely a consequence of the tendency of Pc1 pulsations to occur in clusters.
If the aggressively declustered earthquake catalog (e.g. Sect. 6, Fig. 5e, f) is used, results show that the number of earthquakes that is preceded by Pc1 events becomes com-parable to random events, and similarly for earthquakes that follow Pc1 pulsations. It appears that merely observing mid-day Pc1 pulsations does not significantly increase the likeli-hood that an earthquake will follow, but it is the total number of midday Pc1 pulsations which increase in advance of earth-quakes, as shown above.
9 Conclusions
Table 1.Percentage of midday Pc1 pulsations with, and without, an earthquake ensuing within 2 weeks, and vice versa. Columns correspond to the full earthquake catalog (M≥3, within 200 km), the meanµand standard deviationσof 300 similar random event samples.
Full Random 434 (µ, σ) Declustered Random 268 (µ, σ)
EQ’s with Pc1 63.1% (274/334) 52.5%, 2.5% 50.0% 52.5%, 3.0% EQ’s without Pc1 36.9% (160/334) 47.5%, 2.5% 50.0% 47.5%, 3.0% Pc1 with EQ’s 72.6% (307/423) 87.7%, 3.6% 72.6% 75.6%, 5.1% Pc1 without EQ’s 27.4% (116/423) 9.8%, 3.6% 27.4% 24.4%, 5.1%
pulsations were then statistically correlated to earthquakes from the USGS NEIC catalog within a radius of<200 km around the magnetometer, and M>3.0.
It was shown that the superposed epoch analysis by itself did not reveal any visible correlation between the Pc1 pul-sations and earthquakes. However, when the distribution of Pc1’s was normalized by the daily occurrence probability, an occurrence peak emerged on the day side, ∼5–15 days prior to the earthquake. The significance of this occurrence peak was tested by comparing it against random sequences of events. Results show that the Pc1 distribution, and precur-sory daytime maximum, are very significant, and are most probably not due to chance.
We then tested the effect of declustering our earthquake catalog and repeating the significance tests above. Two declustering analyses were analyzed, one for a typical re-moval of aftershocks, and one for an aggressive rere-moval. Results indicate that even though the significance levels did decrease substantially, there were nevertheless statistically significant regions of enhanced Pc1 occurrence several days ahead of the earthquakes. It is noteworthy that the Pc1 oc-currence prior to, and following earthquakes, always showed a dramatic difference.
Finally, we plotted the relative probability of earthquakes in response to daytime Pc1 pulsations, and compared against similar relative probability plots made against a random event sequence, a list of storm sudden commencements, and a list of isolated geomagnetic storms. It was shown that the earthquake probability only increased in response to day time Pc1 pulsations, by factors of∼3–5 depending on the magnitude of the earthquake. It was also interesting to note that there did not appear to be any significant correlation be-tween geomagnetic activity and earthquake occurrence, beg-ging the question: what was the source of the Pc1 pulsations, if not geomagnetic activity? One model is that preseismic activity might have led to ionospheric modifications which affected the propagation characteristics of (quiet-time) Pc1 pulsations, although other explanations are by no means ex-cluded by the present analysis alone.
Although the results presented herein are certainly sugges-tive, we nevertheless remain cautious in generalizing the con-clusions, until these results can be repeated with data from other periods and especially other (low-latitude) locations around the world. If these results are indeed found to be
re-peatable, a reliable discriminator would need to be developed to distinguish those Pc1 pulsations that precede earthquakes from those that do not, if such a method is to be useful in earthquake early warning systems.
Acknowledgements. This work was supported by QuakeFinder
LLC., Stellar Solutions Inc., the California Space Authority (CSA), and NASA grant NNG04GD16A. Magnetometer data was obtained from the Northern California Earthquake Data Center (NCEDC), contributed by the Berkeley Seismological Laboratory, University of California, Berkeley. The authors would like to thank Ce-leste V. Ford for her ongoing help and support.
Topical Editor M. Pinnock thanks two anonymous referees for their help in evaluating this paper.
References
Althouse, E. L. and Davis, J. R.: Five station observations of Pc1 micropulsation propagation, J. Geophys. Res., 83, 132–144, 1978.
Anderson, T. W. and Darling, D. A.: Asymptotic theory of certain “goodness-of-fit” criteria based on stochastic processes, Ann. Math. Stat., 23, 193–212, 1952.
Bernardi, A., Fraser-Smith, A. C., McGill, P. R., and Villard Jr., O. G.: ULF magnetic field measurements near the epicenter of the Ms 7.1 Loma Prieta earthquake, Phys. Earth Planet. Inter., 68, 45–63, 1991.
Bortnik, J., Cutler, J. W., Dunson, C., and Bleier, T. E.: An au-tomatic wave detection algorithm applied to Pc1 pulsations, J. Geophys. Res., 112, A04204, doi:10.1029/2006JA011900, 2007. Bortnik, J., Cutler, J. W., Dunson, C., Bleier, T. E., and McPher-ron, R. L.: Characteristics of low latitude Pc1 pulsations during geomagnetic storms, J. Geophys. Res., 113, A04201, doi:10.1029/2007JA012867, 2008.
Brace, W. F., Orange, A. S., and Madden, T. R.: The effect of pressure on the electrical resistivity of water-saturated crystalline rock, J. Geophys. Res., 70, 5669–5678, 1965.
Br¨aysy, T., Mursula, K., and Marklund, G.: Ion cyclotron waves during a great magnetic storm observed by Freja double-probe electric field instrument, J. Geophys. Res., 103(A3), 4145–4155, 1998.
Campbell, W. H. and Stiltner, E. C.: Some characteristics of geo-magnetic pulsations at frequencies near 1 c/s, Radio Sci. J. Res. NBS/USNC-URSI, 69D(8), 1117–1132, 1965.
Cornwall, J. M.: Cyclotron instabilities and electromagnetic emis-sion in the Ultra Low Frequency and Very Low Frequency ranges, J. Geophys. Res., 70(1), 61–69, 1965.
Derr, J. S.: Earthquake lights – review of observations and present theories, B. Seis. Soc. Am., 63(6), 2177–2187, 1973.
Dogloglou-Revelioti, E. and Varotsos, P.: Thermally stimulated cur-rents in rocks, J. Geophys., 59, 177–182, 1986.
Engebretson, M. J., Peterson, W. K., Posch, J. L., Klatt, M. R., Anderson, B. J., Russell, C. T., Singer, H. J., Arnoldy, R. L., and Fukunishi, H.: Observations of two types of Pc 1-2 pulsations in the outer dayside magnetosphere, J. Geophys. Res., 107(A12), 1451, doi:10.1029/2001JA000198, 2002.
Fraser, B. J.: Temporal variations in Pc1 geomagnetic micropulsa-tions, Plant. Space Sci., 16, 111–124, 1968.
Fraser, B. J. and Nguyen, T. S.: Is the plasmapause a preferred source region of electromagnetic ion cyclotron waves in the mag-netosphere?, J. Atmos. Sol. Terr. Phys., 63, 1225–1247, 2001. Fraser-Smith, A. C.: Some statistics on Pc1 geomagnetic
mi-cropulsation occurrence at middle latitudes: inverse relation with sunspot cycle and semiannual period, J. Geophys. Res., 75, 4735–4745, 1970.
Fraser-Smith, A. C., Bernardi, A., McGill, P. R., Ladd, M. E., Hel-liwell, R. A., and Villard Jr., O. G.: Low-frequency magnetic field measurements near the epicenter of the Ms 7.1 Loma Prieta earthquake, Geophys. Res. Lett., 17, 1465–1468, 1990. Field, E. C. and Greifinger, C.: Transmission of geomagnetic
mi-cropulsations through the ionosphere and lower exosphere, J. Geophys. Res., 70, 4885–4899, 1965.
Field, E. C. and Greifinger, C.: Equatorial transmission of geo-magnetic micropulsations through the ionosphere and lower ex-osphere, J. Geophys. Res., 71, 3223–3232, 1966.
Freund, F. T.: Pre-earthquake signals – Part I: Deviatoric stresses turn rocks into a source of electric currents, Nat. Hazards Earth Syst. Sci., 7, 535–541, 2007,
http://www.nat-hazards-earth-syst-sci.net/7/535/2007/.
Hanks, T. C.: Constraints on the dilatancy-diffusion model of the earthquake mechanism, J. Geophys. Res., 79, 3023–3026, 1974. Hayakawa, M. and Molchanov, O. A.: Achievements of NASDA’s earthquake remote sensing frontier project, TAO, 15(3), 311– 327, 2004.
Hayakwa, M., Pulinets, S., Parrot, M., and Molchanov, O. A.: Re-cent progress in seismo electromagnetics and related phenomena, Physics and Chemistry of the Earth, Parts A/B/C, 31(4–9) (spe-cial issue), 129–496, 2006.
Hayakawa, M., Hattori, K., and Ohta, K.: Monitoring of ULF (ultra-low-frequency) geomagnetic variations associated with earth-quakes, Sensors, 7, 1108–1122, 2007.
Heacock, R. R. and Kivinen: Relation of Pc1 micropulsations to the ring current and geomagnetic storms, J. Geophys. Res., 77(34), 6746–6760, 1972.
Hendersen, T. R., Sonwalkar, V. S., Helliwell, R. A., Inan, U. S., and Fraser-Smith, A. C.: A search for ELF/VLF emissions in-duced by earthquakes as observed in the ionosphere by the DE 2 satellite, J. Geophys. Res., 98, 9503–9514, 1993.
Hsu, T.-S. and McPherron, R. L.: An evaluation of the statistical significance of the association between northward turnings of the interplanetary magnetic field and substorm expansion onsets, J. Goephys. Res., 107(A11), 1398, doi:10.1029/2000JA000125, 2002.
Ishido, T. and Mizutani, M.: Experimental and theoretical basis of electrokinetic phenomena to rock-water systems and its applicaa-tions to geophysics, J. Geophys. Res., 86, 1763–1775, 1981. Jacobs, J. A.: Geomagnetic micropulsations, Springer-Verlag,
1970.
Johnson, J. R. and Cheng, C. Z.: Can ion cyclotron waves propagate to the ground?, Geophys. Res. Lett., 26(6), 671–674, 1999. Johnston, M. J. S.: Review of magnetic and electric field effects
near active faults and volcanos in the USA, Phys. Earth Planet. Inter., 57, 47–63, 1989.
Kalashnikov, A. D.: Potentialities of magnetometric methods for the problem of earthquake forerunners. Tr. Geofiz. Inst., Akad. Naul. SSSR., 25, 180–182, 1954.
Kangas, J., Guglielmi, A., and Pokhotelov, O.: Morphology and physics of short-period magnetic pulsations, Space Sci. Rev., 83, 435–512, 1998.
Larkina, V. I., Nalivayko, A. V., Gershenzon, N. I., Gokhberg, M. B., Liperovskiy, V. A., and Shalimov, S. L.: Observations of VLF emissions related with seismic activity, on the Interkosmos-19 satellite, Geomagn. Aeron., 23, 684–687, 1983.
Liu, J. Y., Chen, Y. I., Chuo, Y. J., and Chen, C. S.: A statistical investigation of preearthquake ionospheric anomaly, J. Geophys. Res., 111, A05304, doi:10.1029/2005JA011333, 2006.
Manchester, R. N.: Propagation of Pc1 micropulsations from high to low latitudes, J. Geophys. Res., 71, 3749–3754, 1966. Manchester, R. N.: Correction of Pc1 micropulsations at spaced
stations, J. Geophys. Res., 73(11), 3549–3556, 1968.
Molchanov, O., Kulchitsky, A., and Hayakawa, M.: Inductive seismo-electromagnetic effect in relation to seismogenic ULF emission, Nat. Hazards Earth Syst. Sci., 1, 61–67, 2001, http://www.nat-hazards-earth-syst-sci.net/1/61/2001/.
Morgan, F. D., Williams, E. R., and Madden, T. R.: Streaming po-tential properties of Westerly granite with applications, J. Geo-phys. Res., 94, 12 449–12 461, 1976.
Nagata, T.: The effect of a uniaxial compression on remnant mag-netizations of igneous rocks, Pure Appl. Geophys., 78, 100–109, 1970a.
Nagata, T.: Basic magnetic properties of rocks under the effect of mechanical stresses, Tectonophysics, 9, 167–195, 1970b. Olson, J. V. and Lee, L. C.: Pc1 wave generation by sudden
im-pulses, Planet. Space Sci., 31, 295–302, 1983.
Omori, F.: On the aftershocks of earthquakes, J. College Sci. Imper. Univ. Tokyo, 7, 111, 1895.
Park, S. K., Johnston, M. J. S., Madden, T. R., Morgan, D. F., and Morrison, H. F.: Electromagnetic precursors to earthquakes in the ULF band: A review of observations and mechanisms, Rev. Geophys., 31(2), 117–132, 1993.
Parrot, M. and Johnston, M. J. S. (Eds.): Seismoelectromagnetic effects, Phys. Earth Planet. Inter., 57, 1–177, 1989.
Parrot, M.: Special issue of plantary and space sci-ence ‘DEMETER’, Planet. Space Sci., 54, 411, doi:10.1016/j.pss.2005.10.012, 2006.
Parrot, M. and Lefeuvre, F.: Correlation between GEOS VLF emis-sions and earthquakes, Ann. Geophys., 3(6), 737–748, 1985. Parrot, M., Achache, J., Berthelier, J. J., Blanc, E., Deschamps, A.,
Lefeuvre, F., Menvielle, M., Plantet, J. L., Tarits, P., and Vil-lain, J. P.: High-frequency seismo-electromagnetic effects, Phys. Earth Plant. Inter., 77, 65–83, 1993.
V. Kh.: Main phenomenological features of ionospheric precur-sors of strong earthquakes, J. Atmos. Sol. Terr. Phys., 65, 1337– 1347, 2003.
Pulinets, S. A. and Boyarchuk, K. A.: Ionospheric precursors of earthquakes, Springer, Heidelberg, New York, 2004.
Reasenberg, P.: Second-order moment of central California seis-micity, 1969–1982, J. Geophys. Res., 90(B7), 5479–5495, 1985. Rodger, C. J., Thomson, N. R., and Dowden, R. L.: A search for ELF/VLF activity associated with earthquakes using ISI satellite data, J. Geophys. Res., 101(A6), 13 369–13 378, 1996.
Rodger, C. J., Clilverd, M. A., and Thomson, N. R.: Modeling subionospheric VLF signal perturbations associated with earth-quakes, Radio Sci., 34(5), 1177–1185, 1999.
Stephens, M. A.: EDF statistics for goodness of fit and some com-parisons, J. Am. Stat. Assoc., 69, 730–737, 1974.
Webster, D. J. and Fraser, B. J.: Source structure and dynamics of Pc 1 pulsations at low latitudes, Planet. Space Sci., 32(8), 935– 947, 1984.
Wentworth, R. C.: Enhancement of hydromagnetic emissions after geomagnetic storms, J. Geophys. Res., 69(11), 2291–2298, 1964. Zhao, Y. L. and Qian, F. Y.: Geoelectric precursors to strong