www.ann-geophys.net/27/3287/2009/
© Author(s) 2009. This work is distributed under the Creative Commons Attribution 3.0 License.
Annales
Geophysicae
Characterization of ultra low frequency (ULF) pulsations and the
investigation of their possible source
S. H. Mthembu1,2, S. B. Malinga2, A. D. M. Walker1, and L. Magnus2
1University of KwaZulu-Natal, Private Bag X54001, Durban, 4000, South Africa 2Hermanus Magnetic Observatory, P.O. Box 32, Hermanus, 7200, South Africa
Received: 6 November 2008 – Revised: 25 May 2009 – Accepted: 6 July 2009 – Published: 26 August 2009
Abstract. In this paper we present the results from the observation of ultra low frequency (ULF) pulsations in the Doppler velocity data from SuperDARN HF radar located at Goose Bay (61.94◦
N, 23.02◦
E, geomagnetic). Fourier spec-tral techniques were used to determine the specspec-tral content of the data and the results show Pc 5 ULF pulsations (with a frequency range of 1 to 4 mHz) where the magnetic field lines were oscillating at discrete frequencies of about 1.3 and 1.9 mHz. These pulsations are classified as field lines reso-nance (FLR) since the 1.9 mHz component exhibited an en-hancement in amplitude with an associated phase change of approximately 180◦
across a resonance latitude of 71.3◦
. The spatial and temporal structure of the ULF pulsations was ex-amined by investigating their instantaneous amplitude which was calculated as the amplitude of the analytic signal. The results presented a full field of view which exhibit pulsations activity simultaneously from all beams. This representation shows that the peak amplitude of the 1.9 mHz component was observed over the longitudinal range of 13◦
. The tempo-ral structure of the pulsations was investigated from the evo-lution of the 1.9 mHz component and the results showed that the ULF pulsations had a duration of about 1 h. Wavelet anal-ysis was used to investigate solar wind as a probable source of the observed ULF pulsations. The time delay compared well with the solar wind travel time estimates and the results suggest a possible link between the solar wind and the ob-served pulsations. The sudden change in dynamic pressure also proved to be a possible source of the observed ULF pul-sations.
Keywords. Magnetospheric physics (Magnetospheric con-figuration and dynamics; Planetary magnetospheres; Solar wind-magnetosphere interactions)
Correspondence to:S. H. Mthembu ([email protected])
1 Introduction
Ultra low frequency (ULF) pulsations are magnetohydrody-namic (MHD) waves that are excited on and propagate along and across the earth’s magnetic field within the magneto-sphere (Hughes, 1994). They were discovered more than 140 years ago by Stewart (1861), long before the postula-tion of the ionosphere and magnetosphere. Pc 5 ULF pulsa-tions which are characterized by frequencies of 1 to 4 mHz are constantly observed in the magnetosphere using satellites (Kepko and Spence, 2003), ground magnetometers (Sam-son et al., 1991) and HR radars (Walker et al., 1992; Fen-rich et al., 1995; Stephenson and Walker, 2002). Numer-ous papers have reported the observation of ULF pulsations with power at discrete frequencies nearf=1.3, 1.9, 2.7 and 3.4 mHz (Samson et al., 1991; Walker et al., 1992; Fenrich et al., 1995; Stephenson and Walker, 2002). This consis-tent observation of ULF pulsations at discrete frequencies is not yet fully understood. In trying to account for it, numer-ous authors have focused on investigating possible excitation mechanisms. While it has not been conclusively determined, a number of authors have postulated numerous possible exci-tation mechanisms such as Kelvin-Helmholz instability, cav-ity/waveguide mode and solar wind sources which are sum-marized below.
The lack of observational evidence of the cavity mode led Walker et al. (1992) to propose another new model that could be responsible for the excitation of the ULF pulsations. They assumed that the magnetospheric cavity is not closed but represents an open-ended waveguide with boundaries at the magnetopause and the turning point where the Alfv´en waves are reflected. This mechanism is similar to the one where solar wind excites ULF pulsations through Kelvin-Helmholtz instabilities. However, the difference is that the excited waves are reflected between the magnetopause and the turning point. During this reflection some of the energy can penetrate through the barrier and excite ULF pulsations in the inner magnetic fields. This model was supported by observations which revealed some correlations between so-lar wind speeds and the power of the Pc 5 ULF pulsations (Engebretson et al., 1992; Mathie and Mann, 2001).
Samson et al. (1991) noted that the observed frequencies of the ULF pulsations were very stable and reproducible. If we consider the cavity or waveguide mode picture we would require a cavity that has constant dimensions and unvarying properties. Due to the variability of magnetospheric proper-ties it is very difficult to attribute the observed stable frequen-cies to cavity modes. Walker (2002) proposed that the source of the observed frequencies seen in the field line resonances were the fast MHD waves incident on the bow shock from upstream solar wind. Observational evidence was provided independently by Stephenson and Walker (2002) as well as Kepko and Spence (2003). Stephenson and Walker (2002) did some correlation between HF radar data and satellite data while Kepko and Spence (2003) correlated magnetic field data with the solar wind data. All the authors found some correlations at frequencies which lie in the Pc 5 band in both data sets.
The reproducibility of ULF pulsation was addressed by Ziesolleck and McDiarmid (1995) by conducting a statistical study. From their results they found that ULF pulsations oc-cur with the same frequency at all latitudes but at difference frequencies from those observed by Samson et al. (1991). They actually proposed three new sets of discrete frequencies that were prevailing. Mathie et al. (1999) observed frequen-cies similar to those found by Samson et al. (1991) but they were unable to confirm their stability. Baker et al. (2003)
of the ULF pulsations and then we conclude in Sect. 5.
2 Instrumentation and data acquisition
The analysis was conducted using Doppler velocity data collected from HF radar which is located at Goose Bay (61.94◦
N, 23.02◦
E, geomagnetic). The data was collected on the 11 November 2002 during the time interval 06:00 to 08:00 Universal Time (UT) at 120 s intervals. This radar is part of the SuperDARN HF radars which is a collabora-tive network of HF radars that monitor ionospheric plasma convection over the Northern and Southern auroral region. A typical SuperDARN HF radar consist of 16 booms each supporting a log-periodic antenna. Signals from these anten-nas are phased using an electronically-controlled time-delay phasing matrix that allows the beam to be steered into 16 dif-ferent directions. The width of each beam depends on the radar operating frequency, and ranges from 2.5◦ at 20 MHz
to 6◦at 8 MHz. The nominal sector covered by one complete
scan of the HF radar is about 52◦
. The dwelling time of the beam in one direction is about 7 s resulting in a time resolu-tion of one complete scan being 120 s and the field of view being about 2000×2000 km2. The analysis of the returned signal from the irregularities allow the determination of the line of sight Doppler velocity, the backscatter power, and the spectral width up to 75 range gates along each beam with 45 km range gates.
3 Results and discussion
The investigation of ULF pulsations started by scanning through range-time summary plots of line-of-sight Doppler velocity from which alternating bands of positive and nega-tive velocity were observed as shown in Fig. 1. The ULF pul-sations activity was observed for about an hour from 06:50 to 07:50 UT with a strongest activity from 07:00 to 07:45 UT which spanned a 6◦
latitudinal range from about 70◦
to 76◦
. The choice of the beam to be used depends on what is be-ing investigated. For instance, in this case the 180◦
Fig. 1. The summary plot of line-of-sight Doppler velocity col-lected from beam 2 of the Goose on the 11 November 2002.
with the magnetic meridian was chosen. For Goose Bay we chose beam 2 as it meets this requirement.
3.1 Amplitude spectra
Before any analysis, linear interpolation of the velocity data was performed to fill in small (<10 points) data gaps for data window with at least 70% available data. Thus this re-striction limited our analysis to about 68◦
to 74◦
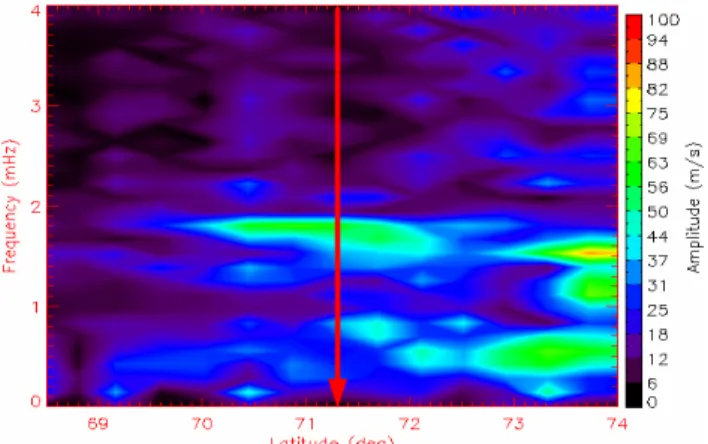
latitude. On the 11 November 2002 the Goose Bay radar was oper-ating under normal mode taking samples at 120 s intervals yielding a Nyquist frequency of 4.15 mHz which is greater than the maximum frequency of interest (4 mHz). The data window was 2 h yielding frequency resolution of 0.14 mHz which is suitable to resolve the frequencies of interest (1.3 and 1.9 mHz). The Fourier transform was used to calculate the amplitude spectra of the data so as to determine which spectral components are present. Calculations were done for a number of latitudes and the spectra are shown in Fig. 2.
The spectra in Fig. 2 show distinct peaks near 0.6, 1.3, 1.5 and 1.9 mHz. The component near 1.3 and 1.9 mHz are among the common discrete frequencies observed by Sam-son et al. (1991), Walker et al. (1992), Fenrich et al. (1995), Stephenson and Walker (2002) as well as Kepko and Spence (2003). Cavity and waveguide modes are advocated as a pos-sible source of these components. In these models the mag-netosphere is presumed to be a cavity that can resonate at discrete frequencies in response to sudden change in solar wind pressure (Kivelson and Southwood, 1985). The repro-ducibility of these components remains a puzzle since it sug-gests that the structure of the magnetospheric cavity is not changing whereas it is changing daily. Ziesolleck and Mc-Diarmid (1995) as well as Baker et al. (2003) independently conducted a statistical study addressing the reproducibility of ULF pulsations. Ziesolleck and McDiarmid (1995) found that ULF pulsations occurred with the same frequency at all latitudes but at different frequencies from those observed by
Fig. 2. The amplitude spectra of the line-of-sight Doppler veloc-ity calculated using Goose Bay data collected on the 11 November 2002 from beam 2. The frequency resolution is 0.14 mHz and the red line indicates a resonance latitude.
Samson at al. (1991). The results of Baker et al. (2003) also failed to confirm the reproducibility and the stability of ULF pulsations.
Spectral component that are less than 1 mHz for instance the 0.6 mHz component observed here, are not commonly observed. However, this observation is similar to that of Walker et al. (1992) who observed a spectral component near 0.8 mHz. These components could not be attributed to either cavity or waveguide mode because of the con-straint on two properties that determine the lowest theoret-ical frequency. The size of the magnetospheric cavity and the internal wave speed places the lower limit of the mag-netospheric oscillation at approximately 1 mHz. Walker et al. (1992) suggested that these components can arise as a result of Kelvin-Helmholtz instability. Further analysis has been done on these components and it turned out that they contained FLR characteristics (Walker et al., 1992). From our analysis we could not check for such characteristics be-cause 0.6 mHz component appeared toward the end of the observation window due to poor quality data beyond the lat-itude window. The 1.3 and 1.5 mHz component could not be analyzed for the same reason. The less common 1.5 mHz component which was also observed by Fenrich et al. (1995) is normally observed in the presence of the common discrete frequencies indicating that there may be a relationship be-tween them. Ziesolleck and McDiarmid (1994) suggested that they are possibly sideband near the fundamental spectral components caused by large amplitude modulation of wave trains.
3.2 Analytic signal and field line resonance (FLR)
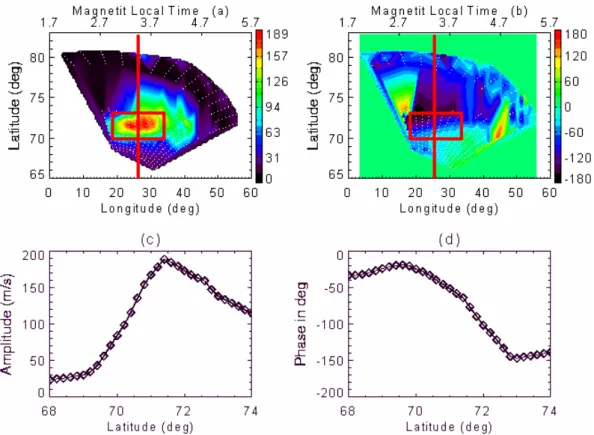
Fig. 3.The instantaneous amplitude(a)and phase(b)of the 1.9 mHz component as a function of latitude from Goose Bay data calculated as the amplitude and phase of the analytic signal respectively. The length of the signal is 2 h sampled at 120 s intervals. Panels(c)and (d)represent the cut through the instantaneous amplitude and phase at 7.3 UT (where amplitude is maximum) indicated by dark lines in panels (a) and (b). Panel (c) shows an enhancement in amplitude of this component across the resonance latitude of 71.3◦while panel (d)
shows a 180 phase change across the resonant latitude.
filtered using a filter with a centre frequency of 1.9 mHz and the bandpass of 0.4 mHz. This width was narrow enough to minimize the contribution from neighbouring spectral ponents yet wide enough not to force the resonance com-ponent to appear stable. The temporal information of the 1.9 mHz component was obtained through the calculation of instantaneous amplitude and phase i.e. the amplitude and phase of the analytic signal. The contour plots of these spec-tra are shown in Fig. 3a and b.
Figure 3a shows the evolution of amplitude of the 1.9 mHz component with time as well as its latitudinal structure. From the figure it can be seen that this component had a duration of about 1 h and the latitudinal coverage of about 3◦
with a peak activity lasting for 30 min over a latitudinal range of about 2◦
geomagnetic. ULF pulsations with a latitudinal structure similar to these were also observed by Fenrich et al. (1995). Figure 3b shows the variation of the phase of this component with time and latitude. It is observed that the phase decreased from low to high latitude for exampled the phase is about
−50◦(at latitude of 68.5◦)and it is about−250◦(at latitude
of 74◦)
yielding the phase change of about 200◦
.
The contour plots in Fig. 3a and b does not only show the time evolution of the 1.9 mHz component, they also show FLR characteristics of this component. Large oscillations are observed over a narrow latitude range from 71◦
to 72◦
. The phase change of approximately 180◦
is observed in Fig. 3b
across the resonance latitude of 71.3◦
. These features be-come even more apparent when considering a cut through the contour plots of instantaneous amplitude and phase of the spectral component at 7.3 UT illustrated by a dark line in Fig. 3a and b. This time is chosen because it coincided with peak spectral energy. The behaviour of the amplitude and phase as a function of latitude is shown in Fig. 3c and d respectively. Figure 3c clearly shows that the amplitude of the 1.9 mHz component increases slowly with latitude from 68.5◦
and peaks at resonance latitude of 71.3◦
and then decreases again. Across this resonance latitude the phase changes by approximately 200◦
Fig. 4.The snapshot of the amplitude(a)and phase(b)of the 1.9 mHz frequency component from Goose Bay data from beams 1 to 15 (left to right) taken at 7.3 UT. The white dots represent the field of view of the radar. The red rectangles in (a) show an enhancement in amplitude near the resonant latitude of 71.3◦while the rectangle in (b) shows the 180ophase change. Panels(c)and(d)show the amplitude and phase
spectra of this component at 7.3 UT along 25◦longitude. These figures further emphasize the FLR characteristics obtained by making a cut through plots (a) and (b) illustrated by red lines.
amplitude at the resonanceL-shell should be accompanied by a phase change of approximately 180◦
. This behaviour is the result of the fact thatL-shells nearer the earth have high frequencies than the driver and lead it in phase and those that are near magnetosphere have low frequencies than the driver and lag it in phase.
3.3 Spatial structure of the ULF pulsations
So far the investigation of the 1.9 mHz component has been done over a narrow range of longitude along one beam. A more detailed characterization was conducted through a multi-beam analysis. This was done to establish the FLR characteristics over the longer range of longitudes. The behaviour of this component is presented as a snapshot at 7.3 UT, a time of maximum spectral activity for most of the beams. The contour plots of the amplitude and phase spec-tra computed from the velocity data are shown in Fig. 4a and b. Essentially these plots show a snapshot of the instanta-neous amplitude and phase of the 1.9 mHz component in all the beams of the Goose Bay HF radar at 7.3 UT. The white dots in the figures show the field of view of the radars and the directions of the beams given by the coordinates of
geomag-netic longitude and latitude. Goose Bay data from beam 0 was not plotted because there was an error in the data. Thus, Fig. 4a and b show data from beam 1 (leftmost) to beam 15 (rightmost).
The observation shows that on the 11 November 2002 at 7.3 UT a certain driver with a frequency approximately 1.9 mHz excited the field lines and it matched the character-istic frequency of the magnetic field lines near the resonance latitude of 71.3◦. Support for this emanates from the
ampli-tude enhancement of the 1.9 mHz spectral component near this latitude (Fig. 4a). Walker et al. (1992) assume that if the earth’s magnetic field lines have a dipole configuration with unvarying magnetospheric properties, this behaviour would be observed in all field lines emanating from a certain L-shell. To the contrary, this behaviour is only observed over 13◦
longitudinal range from about 20◦
due to the fact that the properties of the magnetosphere are variable. On top of that the earth’s magnetic field is not a dipole configuration but is compressed on the day side and elongated on the night side. Figure 4b shows the phase change of approximately 180◦
Fig. 5.The snap shots of the instantaneous amplitude of the 1.9 spectral component observed by the Goose Bay HF radar every after 8 min from 6.83 to 7.90 UT. The figure shows that this component was observed from 6.8 to 7.8 UT giving the temporal extent of about an hour.
As it was done for the single beam, FLR features become even more apparent by considering the cuts through the in-stantaneous amplitude and phase spectra of this component along longitude near 25◦
across different latitude. The cuts are illustrated by the red lines in Fig. 4a and b and this longi-tude is chosen from the range where the amplilongi-tude is maxi-mum and the results are shown in Fig. 4c and d. These figures are plotted from latitude of 68◦to 74◦because there are no
data above and below these ranges. Compared to Fig. 3c and d which show the latitude profile of the amplitude and phase of the 1.9 mHz spectral component at 7.3 UT along beam 2 (near 18◦
longitude), Fig. 4c and d show similar spectra plot-ted at the same time but along the longitude of 25◦
. The amplitudes in Fig. 3a (∼120 m/s) and Fig. 4a (∼200 m/s) are not equal, nevertheless they still peak at the same latitude of 71.3◦
. This difference in amplitude may be attributed to the difference in plasma density around each magnetic field such that the greater the density around the field lines the lower the amplitude. Figure 4b shows that the phase change of∼180◦
is still observed along the longitude of 25◦
.
Figure 4a and b does not only show a spatial structure of the 1.9 spectral component but also the magnetic local time (MLT). The amplitude spectrum shows that the maximum ac-tivity of the pulsations was observed on the nightside (around 3 in the morning).The nightside auroral Pc 5 pulsations were also observed by Ruohoniemi et al. (1991) and Samson et
al. (1991). These pulsations have been interpreted as FLR excited by quantized compressional modes.
3.4 Temporal extent of ULF pulsations
The time evolution of the 1.9 mHz component was investi-gated over the whole radar’s field of view in Goose Bay. For this purpose the instantaneous amplitude of this component was calculated and plotted in Fig. 5. These figures show the snap shots of the amplitude of the component taken every 8 min from 6.8 to 7.9 UT by Goose Bay HF radar.
Figure 5 shows that the 1.9 mHz component was seen in the data from beams 1 to 9 of Goose Bay HF radar as shown by the peak amplitude. This figure shows that this component was observed from about 6.8 UT having a longitudinal extent of about 25◦from 20◦to about 45◦. This longitudinal range
decreases with increasing time such that at 7.9 UT this range was about 10◦
from 20◦
to 30◦
. The intensity of this peak increased with time such that at 6.8 UT the amplitude was
4 Possible source of the ULF pulsations
The probable source of the ULF pulsations that receive much attention lately is the solar wind. Walker (2002) proposed that the MHD waves incident on the bow shock from up-stream solar wind may be responsible for the ULF pulsations seen on the ground. Correlation analysis was conducted be-tween thex-component of the solar wind data from WIND satellite and HF radar data in order to investigate the above mentioned hypothesis. Two data sets from WIND satellites were used, the first one is the OMNI data from the URL http://omniweb.gsfc.nasa.gov/omsc min.html. This data, as provided from the website, is already time shifted from the location of the satellite to the location of the bow shock nose. The second data set is from CDAweb from the URL http://cdaweb.gsfc.nasa.gov/istp public/ and this data is not time-shifted. Thex-component of the velocity was chosen because solar wind velocity is the greatest in thex-direction and also greater than the group velocity of the MHD waves in the solar wind. Thus the group velocity in the sun-earth line is approximately in thex-direction. For the time shifted data the signal observed at the ground need not to be time shifted whereas for the un-shifted data the signal observed at the ground should be delayed by a time approximately equal to the travel time of the solar wind from the satellite to the earth. On the day of the event WIND satellite was located at (102, −29, 0.5)RE in GSE coordinates and the average
speed of thex-component of the solar wind was 458 km s−1 and thus the travel time of the solar wind to the earth was
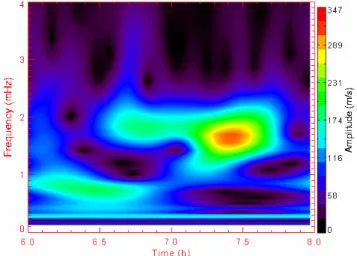
∼24 min. The wavelet transform of thex-component of the
velocity data from the WIND satellite and the line-of-sight velocity data from beam 2 of the Goose Bay radar at the resonance latitude of 71.3◦
were computed and the spectra are shown in Figs. 6 and 7, respectively. Figure 7a shows the spectra for the shifted solar wind data and Fig. 7b shows spectra for the non-shifted data, respectively. The 1.9 mHz component was observed by the WIND satellite as well as Goose Bay radar on the ground. From Figs. 6 and 7a it can be seen that the time delay between the component measured by the WIND satellite and the component observed on the ground is about 30 min which is close to the travel time of the solar wind computed above. The time delay measured from Figs. 6 and 7b is small (few min) and probably is the time taken for the disturbance to travel from the bow shock nose to the magnetosphere.
The results presented in Figs. 6 and 7 add some weight to the proposal by Walker (2002) that the frequencies of the ULF pulsations observed on the ground at least on the day of the event, were possibly excited by the MHD waves in the solar wind.
The dynamic pressure was also investigated as a possible mechanism of the observed ULF pulsations. In Fig. 8 the top panel shows the time series of the HF radar velocity data fil-tered around 1.9 mHz. The time series are shifted upward by certain factor and the arrow in the figure shows the
magni-Fig. 6. The wavelet amplitude spectra of the line-of-sight velocity from beam 2 of the Goose Bay data at resonance latitude of 71.3◦.
The figure shows the 1.9 mHz component observed at about 7.4 UT and the amplitudes have arbitrary units.
tude of the velocity. The time- latitude dispersion observed in Fig. 1 can also be observed in this figure. The bottom panel shows the dynamic pressure deduce from the data from WIND satellite. According to Kim et al. (2002), the sud-den increase in dynamic pressure hits the magnetopause and the magnetosphere compresses and launches broadband fast mode waves. The bottom panel of Fig. 8 shows a sudden in-crease in the dynamic pressure at 6.28 UT and at 6.62 UT. The velocity time series shows enhancement in amplitude which starts around 6.50 UT and again at 7.1 UT. The time delay between first peak in bottom panel at 6.28 and the hancement in velocity amplitude is 13 min (for the first en-hancement) and 49 min (for the second enen-hancement). These time delays do not correspond with the travel time (24 min) of the solar wind from location of the satellite to the earth. This suggests that this pressure pulse is not responsible for the observed ULF pulsations. The peak at 6.62 UT in the dy-namic pressure could not be responsible for the activity in the velocity at 6.5 UT. The time delay between this peak and the enhancement in the velocity at 7.1 UT is about 26 min which corresponds with the travel time of the solar wind from wind satellite to the earth. This indicates a possibility that the sud-den increase in the dynamic pressure at 6.62 UT excited the ULF pulsations which were observed by the HF radar 26 min later.
Fig. 7.The wavelet amplitude spectra of the x-component of the velocity data collected by instruments onboard the WIND satellite. Panels(a) and(b)show the 1.9 mHz component observed at about 6.9 h form the non-shifted data (CDAweb data) and at 7.3 h from the time-shifted data (OMNI data) respectively. The amplitudes have arbitrary units.
100 m/s
Fig. 8. The top panel shows the HF radar velocity time series at different latitudes while the arrow on the right shows the magnitude of velocity. The two ellipses highlight the velocity enhancement. The bottom panel is the dynamic pressure deduced from data from WIND satellite.
of the time series which contains few successive occurrences of ringing will result in the average phase structure as a func-tion of latitude that has been attributed to steady field line resonance, but this does not imply that the magnetosphere has attained the steady oscillation.
5 Conclusion
Data analysis techniques such as Fourier transform and wavelet transform were used to conduct the analysis of Doppler velocity data collected by Goose Bay HF radar on 11 November 2002. The analysis aimed at investigating Pc 5 ULF pulsations and their probable source
Fourier transform was used to determine the spectral con-tent of the data from beam 2 and the results showed the pres-ences of Pc 5 ULF pulsations with frequencies at 0.6, 1.3 1.5 and 1.9 mHz similar to those that were observed by Sam-son et al. (1991), Walker et al. (1992), Fenrich et al. (1995), Stephenson and Walker (2002), Kepko and Spence (2003). The frequency resolution was about 0.1 mHz which was suit-able to resolve frequencies of interest.
the stability of pulsations. Although a substantial amount of work has been done in the characterisation of Pc 5 ULF pul-sations, the issue of their stability and reproducibility is not yet fully resolved.
In addition to the discrete frequencies, the less common spectral component near 1.5 mHz was observed. Fenrich et al. (1995) noted that the less common spectral components in the range 1.5–1.6 mHz are usually observed in the pres-ence of discrete frequencies which could imply the existpres-ence of relationship between them. This suggestion was seconded by Ziesolleck and McDiarmid (1994) and suggested that they are possibly sideband near the fundamental spectral compo-nents caused by large amplitude modulation of wave trains.
The analytic signal was used to investigate the FLR char-acteristics of the 1.9 mHz spectral component. An enhance-ment in amplitude of about 120 m/s over a narrow range of latitude near the resonance latitude of 71.3◦and an associated
phase change of about 180◦
was observed. Geographically the magnetic field lines can be considered to be set into os-cillation by a certain driver with a well defined frequency of approximately 1.9 mHz (Walker et al., 1992). The field lines from latitudes near 71.3◦
are considered to have a charac-teristic frequency matching that of the driver and thus oscil-lated with large resonance amplitudes. And as for the phase change, it is assumed that field lines from latitudes that are lower than the resonance latitudes were oscillating at high frequency and thus were leading in phase while those from higher latitudes were oscillating at low frequencies and thus were lagging in phase. Thus the observed ULF pulsations meet the requirements of being the FLR.
The multi-beam analysis was conducted to establish FLR characteristic over a larger longitudinal range. Following up on the assumption by Walker et al. (1992), if the earth’s mag-netic field lines have a dipole configuration with unvarying magnetospheric properties, the enhancement in amplitude would be observed in all field lines emanating from a partic-ularL-shell. However, in our observation this enhancement is only observed over∼13◦longitude from about 20◦ span
along a particular latitude circle. This could be attributed to the fact that magnetospheric properties are variable. More over the earth’s magnetic field do not have a dipole config-uration but is compressed on the day side and elongated on the night side.
Correlation analysis between HF radar and solar wind data was done to investigate the probable link between the ob-served ULF pulsations and the solar wind. From the wavelet analysis, the time delay computed from the spectra of so-lar wind and the HF radar velocity data correspond with the travel time of the solar wind from the position of the satel-lite to earth surface. The dynamic pressure also appeared to be a possible source of these ULF pulsations. The time delay between the dynamic pressure pulses and the ULF pulsations activity corresponds well with the solar wind travel time from the WIND satellite to earth as shown in Fig. 8. This gives cre-dence to the proposal by Walker (2000) that the frequencies
of the FLRs observed on the ground could be excited by the MHD waves in the solar wind.
The MLT of the ULF pulsations was investigated and it turned out that the pulsations were observed on the night-side. The nightside ULF pulsations which are believed to be FLR excited by quantized compressional modes were also observed by Ruohoniemi et al. (1991) and Samson et al. (1991). The temporal coverage of the ULF pulsations was investigated by calculating the instantaneous amplitude of the 1.9 mHz component. The results showed the peak am-plitude was observed from 6.8 to 7.9 UT yielding a persis-tence of about 1 h. Similar duration was also observed by Walker et al. (1992) and Fenrich et al. (1995).
Acknowledgements. The author would like to sincerely thank Her-manus Magnetic Observatory (HMO) for financial assistance, Johns Hopkins University Applied Physics Laboratory HF radar for the Goose Bay data.
Topical Editor I. A. Daglis thanks K. Takahashi and another anonymous referee for their help in evaluating this paper.
References
Baker, G., Donovan, E. F., and Jackel, B. J.: A comprehensive sur-vey of auroral latitude Pc 5 pulsation characteristics, J. Geophys. Res., 108(A10), 1384, doi:10.1029/2002JA009801,2003. Chen, L. and Hasegawa, A.: A theory of long-period magnetic
pul-sation, 1, Steady state excitation of field line resonance, J. Geo-phys. Res., 79, 1024–1032, 1974.
Dungey, J. M.: Electrodynamics of the outer atmosphere, Pa. State Ionos. Res. Lab., University Park, Sci. Rep., 69, 1954.
Engebreston, M., Glassmeire, K. H., Stellmacher, M., and Hughes, W. J.: The dependence of high-latitude Pc 5 wave power on solar wind velocity and on the phase of high speed solar wind streams, J. Geophs. Res., 103, 26271–26271, 1998.
Fenrich, F. R., Samson, J. C., Sofko, G., and Greenwald, R. A.: ULF high- and low-m field line resonances observed with the Super Dual Auroral Radar Network, J. Geophys. Res., 100(A11), 21535–21548, doi:10.1029/95JA02024, 1995.
Francia, P. and Villante, U.: Some evidence of ground power en-hancements at frequencies of global magnetospheric modes at low latitude, Ann. Geophys., 15, 17–23, 1997,
http://www.ann-geophys.net/15/17/1997/.
Greenwald, R. A., Beker, K. B., Dudeney, J. R., Pinnock, M., Jones, T. B., Thomas, E. C., Villain, J. P., Cerisier J. C., Senior, C., Hanuise, C., Hunsucker, R. D., Sofko, G., Koehler, J., Nielsen, E., Pellinen, R., Walker, A. D. M., Sato, N., and Yamagishi, H.: DARN/SUPERDARN, A global view of the dynamics of high-latitude convection, Space Sci. Rev., 71, 761–796, 1995. Hughes, W. J.: Magnetospheric ULF Waves: A tutorial with a
his-torical perspective, Geophys. Monograph, 81, 1–11, 1994. Kepko, L. and Spence, H. E.: Observations of discrete,
global magnetospheric oscillations directly driven by solar wind density variations, J. Geophys. Res., 108(A6), 1257, doi:10.1029/2002JA009676, 2003.
106(A12), 29783–29796, 10.1029/2001JA000002, 2001. Nos´e, M., Iyemori, T., Nakabe, S., Nagai, T., Matsumoto, H., and
Goka, T.: ULF pulsations observed by the ETS-VI satellite: Substorm associated azimuthal Pc 4 pulsations on the nightside, Earth Planet Sci., 50, 63–80, 1998.
Provan, G. and Yeoman, T. K.: A comparison of field-line reso-nances observed at the Goose Bay and Wick radars, Ann. Geo-phys., 15, 231–235, 1997,
http://www.ann-geophys.net/15/231/1997/.
Samson, J. C., Greenwald, R. A., Ruohoniemi, J. M., Hughes, T. J., and Wallis, D. D.: Magnetometer data and radar observations of magnetohydrodynamic cavity modes in the Earth’s magneto-sphere, Can. J. Phys., 69, 929–937, 1991.
Sibeck, D. G., Lopez, R. E., and Baumjohann, W.: Solar wind dy-namic pressure variations and transient magnetospheric signa-tures, Geophys. Res. Lett., 16, 13–16, 1989.
A., and Samson, J. C.: Spatial and temporal behaviour of ULF pulsations observed by the Goose Bay HF radar, J. Geophys. Res., 97(A8), 12187–12202, doi:10.1029/92JA00329, 1992. Walker, A. D. M.: The SHARE Radar at SANAE, Antarctica, South
African J. Science, 98, 257–268, 2002.