International Journal of Computer Networks & Communications (IJCNC) Vol.8, No.1, January 2016
INFRASTRUCTURE OF SERVICES FOR A SMART CITY
USING CLOUD ENVIRONMENT
Jorge F Hernandez
1, Victor M Larios
1, Manuel Avalos
1and Ignacio Silva-Lepe
21
Department of Information Systems, CUCEA, UDG Guadalajara, Mexico 2
Thomas J. Watson Research Center, Yorktown Heights, NY USA Research, New York, USA
A
BSTRACTSustainability, appropriate use of natural resources and providing a better quality of life for citizens has become a prerequisite to change the traditional concept of a smart city. A smart city needs to use latest generation Information Technologies, IT, and hardware to improve services and data, to offer to create a balanced environment between the ecosystem and inhabitants. This paper analyses the advantages of using a private cloud architecture to share hardware and software resources when it is required. Our case study is Guadalajara, which has nine municipalities and each one monitor’s air quality. Each municipality has a set of servers to process information independently and consists of information systems for the transmission and storage of data with other municipalities. We analysed the behaviour of the carbon footprint during the years1999-2013 and we observed a pattern in each season. Thus our proposal requires municipalities to use a cloud-based solution that allows managing and consolidating infrastructure to minimize maintenance costs and electricity consumption to reduce carbon footprint generated by the city.
K
EYWORDSSmart Cities; Cloud Architectures; Cost Estimation; City Services
1.
I
NTRODUCTIONImproving the services offered by a city and promoting a balance between the environmental sustainability and citizen’s quality of life has become an important goal of what we define today as Smart Cities [1]. IT offer a convenient way to connect processes in a city, optimize resources for the benefit of communities and forecast dynamics of the urban environment to better adapt solutions towards the well-being of citizens. However, citizens in smart cities have to deal with the physical and digital dimension.
During the living activities in the urban fabric, inhabitants have a unique identity to access and engage services such as energy, water, communication, and transport, among others. In addition, cities need to offer secure digital platforms for their inhabitants and IT infrastructure becomes vital in terms of communication and processing capabilities and availability. One solution to adapt and scale to the cities services demand is to shift city IT departments to the Cloud Computing paradigm [8]. Cloud computing has become a most used options in information systems because it can optimize, organize and maintain software services and hardware across the Internet [12].
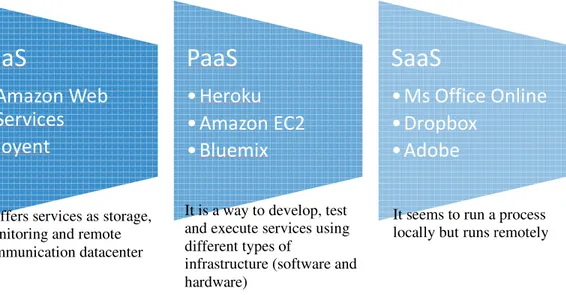
International Journal of Computer The Cloud allows grouping vario better and efficient management services. First, we have the Infras using hardware resources and this demand. Second is the Platform without the complexity of maintain e-government service portals. Th software in processes such as an companies offer these types of clo
Fig 1. E A key aspect of the cloud is the us is a software application that emu limited to execute some task.Clou and principles among suppliers resources based on a “pay as you service, platform or software licen
A service as a process for a Smar Cloud computing proposes benefit etc. Hence, this technology off services.This paper is based on th to share the experience of best pra only a city but also a metropolita observed and analysed that each cluster of servers, routers and in current state, the data centers on e interconnected and sharing inform
Our proposal is to consolidate m metropolitan area with the exis architecture allows the acquisition a few minutes. To better understa we introduce a Use Case that is b
IaaS
• Amazon Web
Services
• Joyent
It offers services as storage, monitoring and remote communication datacenter
ter Networks & Communications (IJCNC) Vol.8, No.1, Jan ious types of hardware and to merge them into a sing
nt. Hence, Cloud Computing can work in three c astructure as a Service (IaaS) which provides of virtu his category can offer sensors, storage or processing c rm as a Service (PaaS) where users can run Web taining and running the associated infrastructure, this i Third, Software as a Service (SaaS) where licenses analytics can be used on demand. In the Fig 1,we
loud computing service.
. Examples of services in Cloud Computing
use of virtual machines to achieve its elasticity; a virt mulates be a real computer with software and hardw loud computing provides a set of principles establishi s and customers. An important aspect of Cloud is ou go” basis, in which the customer must pay for the
ense is executed/used on a cloud provider.
art City may need hardware, software or a combinati efits of elasticity, resilience, performance, productivity offers a better strategy for city governments to the Guadalajara Smart City project selected as IEEE practices for smart cities worldwide. Moreover, Guada
tan area composed of seven interconnected municipal h municipality has a traditional IT infrastructure con intranet access to communicate with other municipa each municipality are isolated infrastructure because rmation and processing capabilities for the metropolita
municipal infrastructure by setting up a private cl isting infrastructure.The benefits of using a cloud ion of any hardware configuration (supported by virtu stand how Cloud Infrastructure can bring value for S based on historical data about pollution in the metrop
PaaS
• Heroku
• Amazon EC2
• Bluemix
SaaS
• Ms Office On
• Dropbox
• Adobe
It is a way to develop, test and execute services using different types of
infrastructure (software and hardware)
It seems to run a locally but runs r
anuary 2016 ngle entity for categories of tualization for capacities on b applications s is critical for es for critical e show some
irtual machine dware features shing the rules is the use of the time that a
ation of them. ity, scalability o manage IT E pilot project dalajara is not alities and we onsisting of a palities. In its se they are not itan area.
International Journal of Computer Networks & Communications (IJCNC) Vol.8, No.1, January 2016 an alert system executed in the cloud can inform citizens when bad conditions can expose them to health threats. In Fig 2 we can see the core of the city which is deployed on a typical cloud computing architecture, in which a set of mobile devices or computers are interacting with users continuously to figure out how an alert system for city services can work on the cloud.
Fig. 2 A cloud infrastructure supporting City Services
2.
P
ROBLEMS
TATEMENTIn the previous section, we discussed the benefits of Cloud Computing in its different layers (IaaS, PaaS, and SaaS) for Smart Cities. We also referred to the case of Guadalajara Smart City looking to shift from traditional IT infrastructure to a cloud computing environment to deal with the city dynamics.
We should mention that an additional important project is the interconnection of all government offices with optical fiber as per the project Connected Mexico, which offers to municipalities the conditions to share their IT infrastructure as a cloud entity.
In Mexico, it is possible to process data outside the environment where they occur, i.e., each municipality can analyse data of citizens in another municipality; if and only if the citizen is informed how it will be used his personal data, thanks transparency and access to information law [11].
Current challenges in data centers include identifying the best practices to support a cloud-computing environment. Thus, we propose basic building blocks for this to migrate the traditional IT datacenters to a private cloud as shown in Fig 3.The hardware layer represents the physical resources (routers, computers, switches, hard drives, RAM memory, video cards, etc.) owned by the IT Municipal Datacenters.
The second layer is the Virtualization, which enables create virtual machines when a process required it, with its own resources and its own operating system. The third layer has the software tools to complete integrate layers one and two.
International Journal of Computer
Fig. 3 L For managing virtual machines CloudStack, Xen, among others minimize licensing costs noneth machines.
We can identify the Administrat machine in the cloud and to perfo or software, delete, or create a ne type of module to support a bette cloud service categories already ex
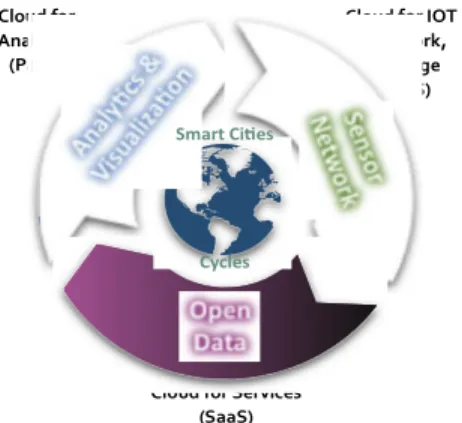
The city deploys sensors and actu global management, security and to be curated and stored in the o curate and provide storage as w complexity of Open Data reposito a SaaS service to use licenses on d
One of the key elements of Sm different government offices offe action allows avoiding duplicated provide solutions
Fig. 4 In order to provide more efficien different indicators. Moreover, a S performance and where to invest t
Metrics for smart cities need to h indicators for example in Cohen’ Clou Anal (Pa
ter Networks & Communications (IJCNC) Vol.8, No.1, Jan
Layers in a cloud computing environment
s can use applications such as OpenStack, VMwa rs. Government entities usually use open source theless; they could use paid software to manage
ator as the process of monitoring the behaviour of rform operations such as: increase or decrease resourc new virtual machine. OpenStack Dashboard is an op tter management.Given the layers in Fig. 3, Fig. 4 sho
explained fit into the Smart Cities cycles.
ctuators that can be connected to the cloud as an IaaS d capacity to scale on demand. In particular, sensors p open data city repository. Cloud PaaS is the most well as processing capabilities for analytics. To de
itories, specialized software for analytics should be us n demand.
mart Cities[4] is to break the silos of information ffering to share all in a common open data city p ted efforts and investments to understand the city dy
. 4 Smart City Cycles related to the cloud
ent services, it is possible to correlate information d a Smart City needs to have a strategy for metrics to un
t to reach its sustainability.
have Key Performance Indicators (KPIs) as well as n’s Wheel there is a section called: Smart Gov, wh
Hardware Virtualization Administrator
Cloud for IOT - Network,
Storage (IaaS)
Cloud for Services
(SaaS) ud for
lytics aaS) Se n so r N e tw o rk Ana ly cs &
Vis ualiz aon Open Data
Smart Ci es
Cycles
anuary 2016
ware vSphere, e solutions to e their virtual
f each virtual rces hardware option for this hows how the
aS, offering a s produce data st indicated to deal with the used requiring
on among the platform.This dynamics and
datasets from understand its
International Journal of Computer Networks & Communications (IJCNC) Vol.8, No.1, January 2016 infrastructure, this option could generate alternative metrics such as latency, multitenancy and others.This means that Smart Cities should work with a holistic vision integrating KPIs [5] and indicators to understand city dynamics and decide how the services should adapt. This concept is based on a systemic approach where a city is a System of Systems or can be modelled and understood as a Complex System.
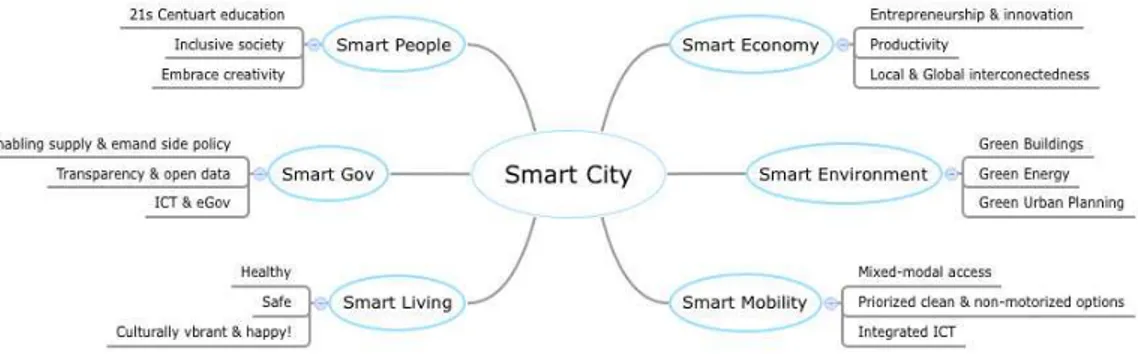
For this reason, the city should decide how to select KPIs and indicators. Given our work at the IEEE Smart Cities initiative, the model used is shown in Fig. 5 based in the Cohen Wheel. The model proposes five important KPIs related to Smart Economy, Smart Government, Smart People, Smart Living, Smart Mobility and Smart Environment [2][3]. Each KPI has a subset of actions and indicators in a secondary ring. It depends on the amount of sources of information available to feed indicators to be provided by the city, there could be more outer rings, which themselves induce more external rings.
This means that the more the city deploys sensor/actuator networks, the more rings that will appear, resulting in more accurate models to analyse the behaviours and dynamics of the city. That is the reason to have a good cloud strategy in order to scale the KPIs, Indicators and Actions management [6]. Hence, the Smart City project in Guadalajara, following the principles of Metrics based in the Cohen Wheel KPIs, requires an architecture to migrate the metropolitan area of Guadalajara to the cloud. This is the main problem and challenge presented in this paper.
A new issue to introduce is that the metropolitan area of Guadalajara, and for every city that is composed of interconnected municipalities, each one has autonomous infrastructure and budgets. Since all municipalities are interconnected, a challenge is to connect all data centers respecting their autonomy them. A proposed solution is to create a private cloud to support the three types of cloud services. As a use case to create a methodology to estimate the performance and cost of the private cloud integration among the interconnected municipalities, we identified sensors, open data and processing requirements as an example that can be used as reference for all KPIs of the Smart City in Guadalajara.
The sensors are real devices in the city creating datasets of air pollution in various zones of the city. The created datasets are stored in an open web service, and we propose a system that analyses the air pollution data flows to identify harmful pollution levels in zones of the metropolitan area to provide actions for the benefit of citizens (alarms, transport re-routing, etc.). The contribution of this paper is to process and analyse the information produced by an alert system. The system will be fully supported by the Cloud resulting in a consolidation of infrastructure across municipalities in the metropolitan area.
International Journal of Computer Networks & Communications (IJCNC) Vol.8, No.1, January 2016 Finally, we propose a methodology to estimate costs of cloud services, which is based in the current municipalities data center infrastructure modelled and extended with a plug in created for the Cloud Simulation Tool Cloudsim [7].
3.
M
ETHODOLOGYWe use Java framework to simulate the behaviour of acloud, CloudSim. CloudSim’s goal is to provide a generalized and extensible simulation framework that enables modelling, simulation, and experimentation of emerging Cloud computing infrastructures and application services, allowing its users to focus on specific system design issues that they want to investigate, without getting concerned with the low-level details related to Cloud-based infrastructure and services. CloudSim can simulate jobs to analysis the behaviour in a cloud computing system. A job is a process in executing during a certain time and using resources as hardware or software to complete its job.
There are software or applications that can get these data because it would be very difficult run on a specific machine or cluster a lot of jobs. Hebrew University made this action and designed a cluster of jobs. Each job represents an activity that was realized in a specific time with a specific configuration of hardware and it was saved in a file called: Metacentrum. The Metacentrum file contains the record of workloads on parallel computers [1]. These data were sent as an input to Cloud Sim to start the process of simulating. Firstly, it was necessary to understand the fields of the MetaCentrum file to know how we would use it. We found the specification of the file [2] and we selected the following fields to make our simulation:
• Submit time
• Wait time
• Run time
• Used memory
• Requested memory
• Status
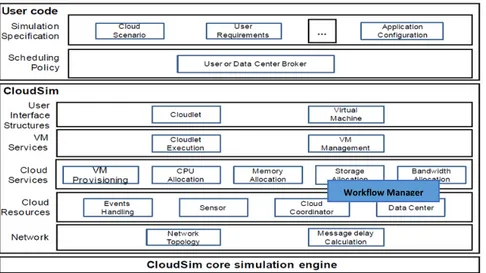
We used Metacentrum with Cloudsim tools to understand the behaviour and the way in which these processes are distributed using CloudSim environment. Thus we decided to create our own schedule process, each data center must share resources when a process or administrator request to respond immediately, then we added a module to Cloudsim to perform this task, see Fig 6.
International Journal of Computer The hardware and software se municipally. Also we created a p warning to the general manager workflowand priority process of e
Also, an additional goal of our si implementing theservice using t preventive andcorrectivemaintena environments that are necessaries
1. Physical configuration:
service (i.e. hard disk, m
2. Software configuration:
operating system, databas 3. Supplies: items that the
electrical power, cables providers).
This aggrupation allowed us to un made an equation as follows:
where:
ω = a service/process
Ψ = the total amount required reso
Ω = a specific used resource from
ϕ = fixed cost of used resource fin
λ = execution time of each resourc
µ = execution time needed to com Υ= sub process of ω
Τ= the total sub process of ω M (Ω) = maintenance cost of θ
Using this formula, we can time. We decided to use a rec process/service that required a dis formula is used to specify the ec resources(hardware) used in a serv
Each municipality has its autonom accomplish the tasks. With this versus another for each municipa for the same service.
Using this formula, we can guara For example, if a provider “X” ha
ter Networks & Communications (IJCNC) Vol.8, No.1, Jan settings were established by actual use condition a process that consumed all resources of a data cente er and reallocate more resources to other datacenter f each datacentre to take more resources.
simulation was to generate an equation to createthe a thecloud, we consideredaspects such aspaymentof nance, and keyandsupport staff. We decidedto group es to get the real cost of a specific service. These grou
it represents the required configuration to execute c , memory ram, video target, bandwidth, kind of net
it refers to the set of programs that the service ase, file system, simulation programs and parallelism the provider needs to active the mentioned above s les, air conditioning, license fees, space, staff, paym
understand the elements to be evaluated in each proces
sources
m physical or software configuration finished by the provider
urce
mplete all the process
n obtain the cost computation of each resource i recursive function to recover the used resources o distribution of its job (parallel tasks). The primary
economic cost in each process to have a log of all ervice.
omy to decide what kind of software and hardware is equation we could also determine the efficiency o
pality to identify the fastest execution and best low p
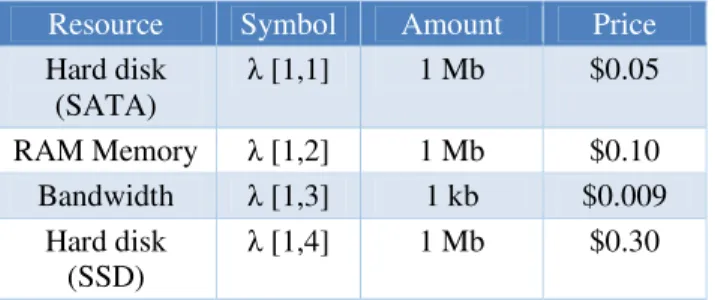
arantee the cost computation of each resource in a sp has a price listing as is showed in Table 1.
anuary 2016 ions for each
nter to send a ters, checking
e actual costof tof electricity, p the different oups were:
e correctly the etwork). ice needs (i.e. ism).
services (i.e. yment to other
cess and we
e in a specific of a certain ry goal of our ll the physical
is needed to of a process price service
International Journal of Computer Networks & Communications (IJCNC) Vol.8, No.1, January 2016
Resource Symbol Amount Price
Hard disk (SATA)
λ [1,1] 1 Mb $0.05
RAM Memory λ [1,2] 1 Mb $0.10 Bandwidth λ [1,3] 1 kb $0.009
Hard disk (SSD)
λ [1,4] 1 Mb $0.30
Table 1. Cost of use per each resource established by “X” user
Our equation may compute the cost for a specific user and in a specific time (ω). Consequently (α,β, θ) ε Ω. The Cost = λ (Ω) + λ (ϕ) ∧Σ (α) + Σ (β) = Ψ∧Σ (Ψ) = µ. The formula determines the cost of each Ω in a specify time λ and when the process has ended, returns µ.
We also decide to use a recursive function to recover the used resources of a specific process/service that required distributing his job. The M (Ω) factor represents a minimum cost of the maintenance services used. It could be applied or not. This value is added by the provider.
For example, if a final user operates over one month his service with the provider “X”, the computed cost could be obtained. In the Table 2, the table shows the days in which the final user required to use his application. ω is a process put by the user. Ψ has 4 values because they are 4 services, the application needs to execute.
Date Used resources Price Nov/01/2015 λ [1,1] =0
λ [1,2] =0
λ [1,3] =0
λ [1,4] =0
µ = 0 Υ = 0
0.0
Nov/15/2015
λ [1,1] =120
λ [1,2] =10
λ [1,3] =0
λ [1,4] =0
µ = 3 segs Υ = 0
$89.90
Nov/23/2015 λ [1,1] =160
λ [1,2] =200
λ [1,3] =100
λ [1,4] =0
µ = 1000 segs
Υ = 0
$157.84
Nov/30/2015 λ [1,1] =130
λ [1,2] =10
λ [1,3] =30
λ [1,4] =0
µ = 30 segs Υ = 0
$69.89
C2ost = Computed Cost Total $317.63
International Journal of Computer *Prices are in dollars
Therefore, we can observe that the his application in a period of time this issue, also it did not have a re
4.
E
XPERIMENTALF
RAMEGuadalajara is located in weste according to the National Institute [9] in 2008. It is one of the three and demographic region.
Fig. The city is formed by 9 municip Juanacatlan, Ixtlahuacan de los M structure the metropolitan area o monitoring air quality 24 hours a animals. The Metropolitan Index standard for gauging air quality dioxide (SO2), nitrogen dioxide micrometers (PM10). IMECA is environmental pollution. IMECA in the Table 3.
Ta
1
Image taken from: https://commons.wikimed
IMECA
0 – 50
51 – 10 101 – 1
151 – 2 >201
ter Networks & Communications (IJCNC) Vol.8, No.1, Jan
the final user will have to pay $317.63 for the days of e. In this case M (Ω) = 0 because the provider does recursion algorithm which it is represented by k = 0.
EWORK
stern Mexico; it has a current population of abou ute of Statistics and Geography (INEGI for its initials ree main cities in Mexico for its economic growth, te
ig. 7 Metropolitan area of Guadalajara1
cipalities: Guadalajara, Zapopan, Tonala, Tlaquepaqu s Membrillos y Tlajomulco de Zuñiga. In Fig. 7, w of Guadalajara. Since 1995, the city of Guadalaja a day, to make recommendations to care health of its x of Air Quality [10] (IMECA in Spanish) is a Mex since 1988. It reports chemicals such as: ozone de (NO2),carbon monoxide (CO) and particulate le
is used as a reference for all the states of Mexico A has a set of ranges for activing notifications, whic
Table 3. Classification pollution levels
edia.org/wiki/File:Mapa_ZMG.svg
CA Air quality level
0 Good
100 Regular
150 Bad
200 Very Bad Extremely Bad
anuary 2016
of consume of s not consider
out 4,299,000 als in Spanish) , technological
que, El Salto, we show the ajara has been ts citizens and exican official e (O3), sulfur less than 10 co to measure
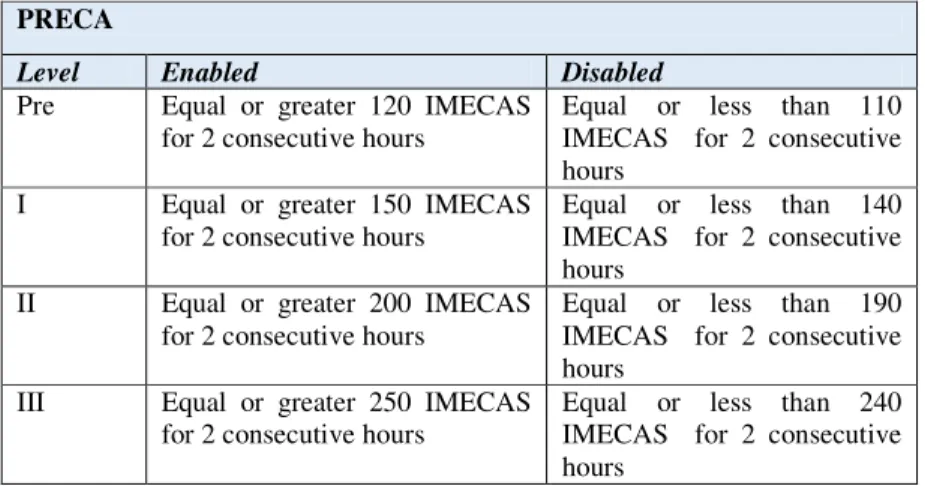
International Journal of Computer Networks & Communications (IJCNC) Vol.8, No.1, January 2016 When the range of pollution is above 120 IMECAS, it may cause respiratory problems for some people, mainly children and the elderly. However, if the range is greater than 200 IMECAS a contingency plan is activated: the PRECA (Emergency Response Plan Contingency and Atmospheric Jalisco), which contains various levels, see Table 4.Guadalajara has registered as an open dataset, the information collected about pollution levels from 1996 to 2013, it is in a excel format and files contain data for each metropolitan area and its levels of pollution sensed per day and time (0 - 23 hours).
Table 4. Levels of activation and deactivation of PRECA
Registered contaminants are: O3, NO, NO2, NOx, SO2, CO, PM10, direction and wind speed and temperature. In our case study, we considered the use of CO as a contaminant, because most Guadalajara inhabitants are in direct contact with it. The CO is an odourless and invisible toxin, thus constant attention is required to monitor its level and to detect when it is higher than environmental health standards in Mexico, to activate contingency plans for the population. The extracted information on the levels of contamination of the ZMG, which is in Excel format, it was migrated to a MySQL database, we normalized the information and we analysed the behaviour of the contamination by zone based on hours, days, months and seasons.
Next, we configured each municipality with its data center and additionally interconnected one by one, to have a communication link between each one and further we connected with the state government which control each municipality, this entity can recover data that requires of a municipality and visualize areas of the city where require more use resources, e.g. process to detect and synchronize traffic signals and wait times when there is an accident or special event, etc. Because municipalities are connected to each other, the decisions of each municipally are informed immediately to all others, as well as the actions decided by the state government, and this is shown in Figure 8.
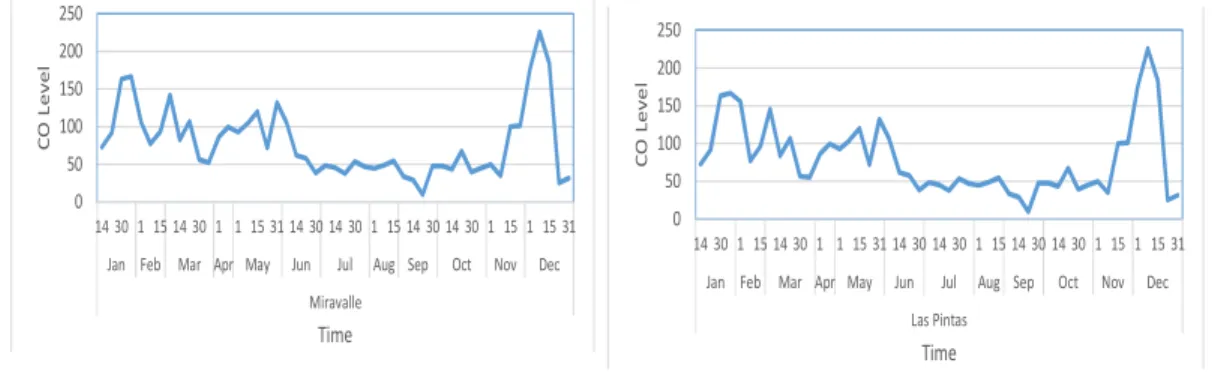
In Figs. 9 to 11, we can observe the behaviour of contamination of three major areas of Guadalajara, where we no increase in pollution levels at the beginning of January, May and December.
PRECA
Level Enabled Disabled
Pre Equal or greater 120 IMECAS for 2 consecutive hours
Equal or less than 110 IMECAS for 2 consecutive hours
I Equal or greater 150 IMECAS for 2 consecutive hours
Equal or less than 140 IMECAS for 2 consecutive hours
II Equal or greater 200 IMECAS for 2 consecutive hours
Equal or less than 190 IMECAS for 2 consecutive hours
III Equal or greater 250 IMECAS for 2 consecutive hours
International Journal of Computer Networks & Communications (IJCNC) Vol.8, No.1, January 2016
Fig 8. Municipalities connected with state government
A decrease in the months of August and September. These factors should be for the rainy season and the reincorporation of students and teachers to their schools. We noted that there is a relationship between the work and school activities with the emission of pollutants, with this premise determined in 3 phases: 1 = low level, 2 = intermediate level and 3 = maximum level. We mapped these levels with an alert system (we did it) to inform to the citizens and to initiate a feedback process to provide recommendations and avoid crossing by this zone.
Fig. 9 Co Levels in Las Miravalle 2013 Fig.10 Co Levels in Las Pintas 2013
Fig. 11 Co Levels in Tlaquepaque 2013
0 20 40 60 80 100 120
1 15 31 14 1 15 14 30 14 30 1 15 1 15 31 14 30 1 15 1 15 1 15 31
Jan Feb Mar Apr May Jun Jul Aug Sep OctNov Dec
Tlaquepaque
C
O
L
e
v
e
l
Time 0 50 100 150 200 250
14 30 1 15 14 30 1 1 15 31 14 30 14 30 1 15 14 30 14 30 1 15 1 15 31
Jan Feb Mar Apr May Jun Jul Aug Sep Oct Nov Dec
Las Pintas
C
O
L
e
v
e
l
Time
0 50 100 150 200 250
14 30 1 15 14 30 1 1 15 31 14 30 14 30 1 15 14 30 14 30 1 15 1 15 31
Jan Feb Mar Apr May Jun Jul Aug Sep Oct Nov Dec
Miravalle
C
O
L
e
v
e
l
Time
International Journal of Computer Networks & Communications (IJCNC) Vol.8, No.1, January 2016 These levels allow us to identify when a municipality zone needs to share resources among others through the private cloud to manage services. When a level is in phase 1, the municipality may process its information by itself, in phase 2, it could need the assistance of one or more municipalities to improve response time, and the last phase this municipality requests the intervention of others to process the high demand for information to be processed in the shortest possible time.Once the simulation has been performed, we create nine datacenters with hardware features provided by each zone also. The purpose of representing the nine municipalities in a cloud environment, it is to verify that sharing the resources of each infrastructure, improving quality of service to the city, maintenance costs are optimize and the purchase of computer equipment benefits all municipalities and not just one. That is reason, we generated a mechanism to share resources between each area and we built a coordinator agent, which monitors the workload of each area to grant access to other data centers when is necessary.
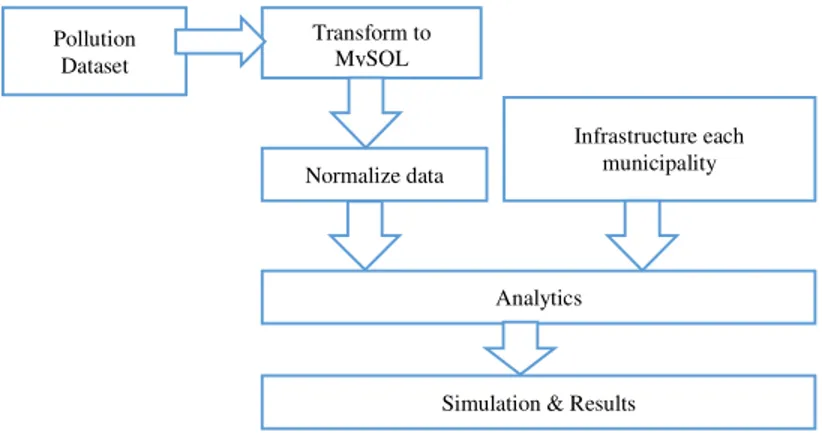
After we configured a datacenter with the following characteristics: 16 Memory Ram, 4 Tb Hard Drive, Two Xeon X3430 processors and multi-node optical fiber with 100 Mbps transfer rate. This configuration represents the average of resources that a municipality has. The application was executed in two phases: the first, it was using the traditional scheme of each municipality and phase two: it used a cloud-based scheme. In the Fig. 12 we show the workflow, we did for this extraction, interpretation and results obtained.
Fig. 12 Workflow process
5.
R
ESULTA
NALISYSIn Fig 13, we show on the left side the number of milliseconds that a service took to execute during a certain time in a traditional scheme ,and on the right side the result of our proposal where we suggested use of resources using a private cloud. A considerable decrease is observed and thus electric power consumption was reduced and the cost of use is lower than with other scheme.
The type of service used in this experiment was on monitoring air quality, which 15 minutes an IMECA value was recorded for each municipally, in the Fig 13, it shows some peaks, and it is caused when we sent the information to the dependencies of government to alert a level of contamination that exceeded the allowed limit and we noted a time range where there is more traffic and response time must almost be faster to take preventive measures.
This result proves that the traditional IT system of processing a service with the resources that a municipally has, increases the response time of a service or attention. However, if we use cloud computing solution to connect these entities to share data or resources, the execution time decreases and the response of a services is faster than IT traditional.
Pollution Dataset
Transform to MySQL
Normalize data
Infrastructure each municipality
Analytics
International Journal of Computer Networks & Communications (IJCNC) Vol.8, No.1, January 2016
Fig. 13 Traditional IT vs Private Cloud
6.
C
ONCLUDINGR
EMARKSA
NDP
ERSPECTIVESHistorical data of pollution levels helped to determine the system of events that should be present in the city to inform and organize services for each zone. For example, when pollution levels are high, systems could report to citizenship through their smart phones of this situation and suggest changes in their routine. Thus begins a process of feedback where the user could request new routes to arrive his destination not passing by contaminated areas.
These kind of services are useful for smart cities. Cloud computing allows enhancing resources and adapt to new hardware equipment that may be present in a data center and to share its resources with other areas. As a future work, we could use Docker containers to perform in situ the information that is enclosed within a metropolitan area instead of moving it to another location for processing.
Docker allows the creation, implementation and execution of applications by using containers. The containers provide a mechanism to package an application with all the components you need, such as libraries and other facilities, and group them into one package. Using Docker, the municipalities will apply only hardware resources and information of each municipally is processed through itself and it is not necessity to move another place to do that.
This article showed how the interconnection between municipalities in the metropolitan area of Guadalajara, allows for integration between each to optimize resources and minimize the cost of buying and maintaining hardware and software.The goal is to use the advantages of cloud computing to consolidate infrastructure and services to improve the quality of life of citizens.
ACKNOWLEDGEMENTS
International Journal of Computer Networks & Communications (IJCNC) Vol.8, No.1, January 2016
REFERENCES
[1] M. Batty, K. W. Axhausen, F. Giannotti, A. Pozdnoukhov, A. Bazzani, M. Wachowicz, G. Ouzounis, and Y. Portugali, “Smart cities of the future,” The European Physical Journal Special Topics, vol. 214, no. 1, pp. 481–518, Nov. 2012.
[2] H. Schaffers, N. Komninos, M. Pallot, B. Trousse, M. Nilsson, and A. Oliveira, “Smart Cities and the Future Internet: Towards Cooperation Frameworks for Open Innovation.,” Future Internet Assembly, vol. 6656, no. 31, pp. 431–446, 2011.
[3] “Smart city Framework. Guide to establishing strategies for smart cities and communities,” BSI British Standards, London.
[4] N. Komninos, H. Schaffers, and M. Pallot, “Developing a Policy road map for Smart Cities and the future internet,” eChallenges e-2011 …, 2011.
[5] C. Harrison and I. A. Donnelly, “A Theory of Smart Cities,” Proceedings of the 55th Annual Meeting of the ISSS - 2011, Hull, UK, vol. 55, no. 1, Sep. 2011.
[6] G. J. Peek and P. Troxler, “City in Transition: Urban Open Innovation Environments as a Radical Innovation,” programm.corp.at
[7] Rodrigo N. Calheiros, Rajiv Ranjan, Anton Beloglazov, Cesar A. F. De Rose, and Rajkumar Buyya, "CloudSim: A Toolkit for Modeling and Simulation of Cloud Computing Environments and Evaluation of Resource Provisioning Algorithms, Software: Practice and Experience (SPE)", Volume 41, Number 1, Pages: 23-50, ISSN: 0038-0644, Wiley Press, New York, USA, January, 2011
[8] Rajkumar Buyya, James Broberg, Andrzej M. Goscinski , "Cloud Computing: Principles and Paradigms", Wiley Editorial, March 2011
[9] Instituto Nacional de Estadística Geografía e Informática, http://www.inegi.org.mx/ [10] Secretaria de Medio Ambiente, htp://siga.jalisco.gob.mx/
[11] Ley Federal de Transparencia y Acceso a la Información Pública, http://www.diputados.gob.mx/LeyesBiblio/pdf/244_140714.pdf, Junio 2002
[12] George Reese, Cloud Application Architectures: Building Applications and Infrastructure in the Cloud, O’Reilly Media, 2009
AUTHORS
Jorge F. Hernandez, he was born in Guadalajara, Jalisco, in 1975. He received the B.E. degree in computation engineering from the University of Guadalajara, Mexico, in 1998, and the Master in Computer Science in 2000 from Cinvestav. In 2004, he joined the Department of Computer Science, University of Guadalajara, as a teacher. He had published 4 articles in different congress and he had been thesis advisor in bachelor and master level. In 2012, he was admit- ted in CUCEA to study Postgrade IT and he is working with cloud computing to estimate cost and planning time processing.
Víctor M. Larios, has received his PhD and a DEA (French version of a MS program) in Computer Science at the Technological University of Compiègne, France and a BA in Electronics Engineering at the ITESO University in Guadalajara, Mexico. He works at the University of Guadalajara (UDG) as Professor Researcher and as consultant directed the Guadalajara Ciudad Creativa Digital Science and Technology program during 2013. His research insteres are related to distributed systems, visual simultaitons and smart cities. He is a Senior IEEE member and current chair of the Computer Chapter at the IEEE Guadalajara Section at Region 9. His role in the IEEE-CCD Smart Cities initiative is to lead the working groups.
International Journal of Computer Networks & Communications (IJCNC) Vol.8, No.1, January 2016 Ignacio Silva-Lepe is a Research Staff Member at IBM. His areas of interest include