FEDERAL UNIVERSITY OF PAR ´A INSTITUTE OF TECHNOLOGY
ELECTRICAL ENGINEERING GRADUATE PROGRAM
WORK TITLE
Clustering-Driven Equipment Deployment Planner
and Analyzer for Wireless Non-Mobile Networks
Applied to Smart Grid Scenarios
AUTHOR’S NAME
Ladislav Vrbsk´
y
DM 13/2018
UFPA / ITEC / PPGEE Guam´a University Campus
FEDERAL UNIVERSITY OF PAR ´A INSTITUTE OF TECHNOLOGY
ELECTRICAL ENGINEERING GRADUATE PROGRAM
AUTHOR’S NAME
Ladislav Vrbsk´
y
WORK TITLE
Clustering-Driven Equipment Deployment Planner
and Analyzer for Wireless Non-Mobile Networks
Applied to Smart Grid Scenarios
DM 13/2018
UFPA / ITEC / PPGEE Guam´a University Campus
INSTITUTE OF TECHNOLOGY
ELECTRICAL ENGINEERING GRADUATE PROGRAM
AUTHOR’S NAME
Ladislav Vrbsk´
y
WORK TITLE
Clustering-Driven Equipment Deployment Planner
and Analyzer for Wireless Non-Mobile Networks
Applied to Smart Grid Scenarios
Master’s Thesis submitted for evaluation of the Examination Committee of Elec-trical Engineering Graduate Program of UFPA as a requirement for obtainment of title Master of Electrical Engineering in the area of Applied Computing.
UFPA / ITEC / PPGEE Guam´a University Campus
Dados Internacionais de Catalogação - na – Publicação (CIP)
Sistema de Bibliotecas da UFPA
____________________________________________________________
Vrbsk
ý
, Ladislav, 1992-
Clustering-driven equipment deployment planner and analyzer for wireless
non-mobile networks applied to smart grid scenarios / Ladislav Vrbsk
ý
. - 2018.
Orientador: Marcelino Silva da Silva
Dissertação (mestrado) - Universidade Federal do Pará, Instituto
de Tecnologia, Programa de Pós-Graduação em Engenharia Elétrica, Belém,
2018.
1. Cluster (sistema de computador) – análise. 2. Mineração de dados
(computação). 3. Comunicação sem fio – modelos matemáticos. I. Título.
CDD 23. ed. 004.35
“Waste no more time arguing about what a good man should be.
Be one.”
Acknowledgments
First and foremost, to my amazing parents, who selflessly supported me with all they got, guided me through life as they know best, and gave me the opportunity to focus on the important, such as my education. To this I am very grateful and having such solid base is what enabled me to focus.
To my wife and our daughter, who both made me a better, more focused and driven. My wife’s support was essential for a successful completion of this work. Having a family to take care of helped me to push through hard times and tiresome work, and to withstand more.
To all remaining family members, both in Czech and Brazil, for all kinds of support, local or remote, and the faith they have had in me over the many years.
To friends I made during my life wherever I went, who brightened my days with lots of fun and memories I will always remember.
To sports, especially baseball, where I found much joy. To coaches and players I met, and games I played, who made me a good team player, taught me lessons I will cherish for the rest of my life.
To professors and fellow researchers at labs LPO and LPRAD, who helped me to overcome the language barrier, as well as to understand new concepts and ideas, and created a lab environment pleasing to work in.
To educational systems, professors, and advisors of Brazil, USA, and especially Czech Republic, that made me an educated man generally, as well as in my fields of focus. They provided high-quality education and taught me persistence, resilience, and others.
To CNPq for the financial support that was provided to me, even though I am a foreigner. This aid gave me incentives to focus on my studies in Brazil, which led to a successful completion of the Master’s education period.
Contents
List of Figures v
List of Tables vii
Glossary ix
1 Introduction 1
1.1 Motivation and Problem Definition . . . 1
1.2 Objectives . . . 4
1.3 Work Organization . . . 5
2 Smart Grid 8 2.1 Initial Considerations . . . 8
2.2 Smart Grid Communication . . . 9
2.3 Smart Grid Standards . . . 10
2.4 Device Standardization . . . 13
2.4.1 IEC 61850 . . . 13
2.4.2 Intelligent Electronic Device . . . 15
2.4.3 Distribution Feeder . . . 15
2.5 Final Considerations . . . 16
3 Clustering 17 3.1 Initial Considerations . . . 17
3.1.1 The Role of Data . . . 17
3.1.2 Supervised Learning . . . 18
3.1.2.1 Classification . . . 18
3.1.2.3 Overfitting . . . 21
3.1.3 Unsupervised Learning . . . 22
3.2 Clustering . . . 23
3.2.1 K-means . . . 23
3.2.2 K-medoids . . . 25
3.2.3 Agglomerative Hierarchical Clustering . . . 26
3.2.4 Affinity Propagation . . . 27
3.3 Final Considerations . . . 29
4 Related Work 30 4.1 Initial Considerations . . . 30
4.2 Related Work . . . 31
4.3 Final Considerations . . . 33
5 Proposed Methodology 35 5.1 Initial Considerations . . . 35
5.2 Motivation and Objective . . . 35
5.3 Scenario Definition . . . 36
5.3.1 Subscriber Configuration . . . 37
5.3.2 Network Configuration . . . 38
5.4 Methodology Components . . . 39
5.4.1 Clustering . . . 39
5.4.2 Graph Topology and Delay Calculation . . . 40
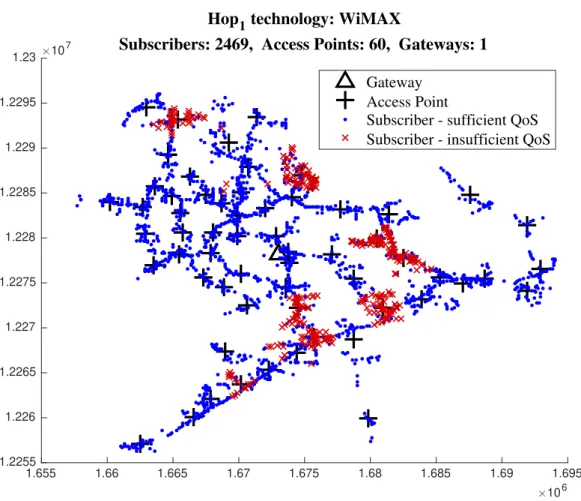
5.4.3 Results and Visualization . . . 41
5.4.4 Restricted Mode . . . 42
5.5 Final Considerations . . . 43
6 Case Study 44 6.1 Initial Considerations . . . 44
6.2 Common Configuration . . . 45
6.2.1 Coordinates . . . 45
6.2.2 Communication Patterns . . . 45
6.2.3 Restricted Mode . . . 46
6.3 Scenarios . . . 47
6.3.1 Scenario A . . . 47
6.3.2 Scenario B . . . 48
6.3.3 Scenario C . . . 50
6.4 Single-Level Model Configuration . . . 51
6.4.1 Model Preparation . . . 51
6.4.1.1 Clustering Configuration . . . 51
6.4.2 Results . . . 52
6.4.2.1 Scenario A . . . 52
6.4.2.2 Scenario C . . . 53
6.4.2.3 Summary of Results . . . 53
6.5 Two-Level Model Configuration . . . 55
6.5.1 Communication Network . . . 55
6.5.2 Antennas . . . 55
6.5.3 Time Division Duplex . . . 56
6.5.4 Delay Calculation . . . 57
6.5.5 Clustering . . . 57
6.6 Two-Level Model Case Study . . . 58
6.6.1 Scenario A . . . 58
6.6.2 Scenario B . . . 59
6.6.3 Scenario C . . . 60
6.6.4 Summary of Results . . . 61
6.7 Final Considerations . . . 62
7 Conclusions, Contributions, Future Work 75 7.1 Conclusions . . . 75
7.2 Contributions . . . 76
7.3 Future Work . . . 77
A SINR Calculation 87
List of Figures
2.1 Sample distribution feeder. [Kersting, 2012] . . . 16
3.1 An example of classifying a data set into two classes using Support Vector Machines algorithm. Solid red line in the middle represents the separation hyperplane, i.e. the final classificator for the current problem. . . 19
3.2 Example of an Artificial Neural Network structure for a three-class classifi-cation problem. Four nodes in the input layer mean there are four features or dimensions taken as input for every datapoint. . . 20
3.3 Example of regression analysis performed over a set of datapoints. . . 21
3.4 Clustering example. . . 24
5.1 Communication structure of the proposed methodology. . . 37
5.2 Example of a result visualization, showing access point and gateway posi-tions as well as 2469 network subscribers and their QoS state. . . 42
6.1 13 feeders of Scenario A [Kersting, 2001]. In [Silva, 2014] the node at the top is used as an access point and is excluded from the scenario in this thesis. 48 6.2 European Low Voltage Test Feeder coordinates used for ScenarioB [IEEE PES, 2015]. . . 49
6.3 Scenario of around 8500 feeders, 2469 of which were used in ScenarioC [Ar-ritt and Dugan, 2010]. . . 50
6.4 Example result of network cell positions relative to subscribers as chosen by the two-layer model for Scenario A. . . 59
6.5 Resulting positions of network equipment relative to the 906 subscribers of Scenario B. QoS satisfaction results are given for a regular mode of upstream communication with 12 : 3 TDD ratio. . . 67
of Scenario B. QoS satisfaction results are given for a restricted mode of upstream communication with 12 : 3 TDD ratio. . . 68 6.7 Resulting positions of network equipment relative to the 2469 subscribers
of Scenario C. QoS satisfaction results are given for a regular mode of upstream communication with 10 : 5 TDD ratio. . . 73 6.8 Resulting positions of network equipment relative to the 2469 subscribers
of Scenario C. QoS satisfaction results are given for a restricted mode of upstream communication with 10 : 5 TDD ratio. . . 74
List of Tables
1.1 Analogy between the internet and evolving smart grid. [Emmanuel and Rayudu, 2016] . . . 3
2.1 A Brief Comparison between the Existing Grid and the Smart Grid [Farhangi, 2010], [Fang et al., 2012] . . . 11 2.2 Overview of Smart Grid Standards [Gungor et al., 2011b] . . . 14
6.1 Details of message classes, defined using PICOMs. Adapted from [IEC 61850, 2003]. . . 46 6.2 Message sizes, including protocol overhead, and maximum delays per
com-munication category. . . 47 6.3 Coordinates of 12 nodes from Scenario A. . . 49 6.4 Smart grid applications assigned to the 12 nodes of Scenario A. Each
application defines the communication patterns according to Table 6.2 . . . 52 6.5 QoS results of Agglomerative Hierarchical Clustering and affinity
propaga-tion clustering algorithms. Values represent units of IEDs with sufficient (Attended) and insufficient (Not Attended) QoS. . . 54 6.6 Parameters of wireless technologies and their values. . . 55 6.7 Values of wireless network equipment parameters. . . 56 6.8 Parameters describing the communication environment that influences
sig-nal propagation. . . 58 6.9 Number of IEDs with insufficient QoS in Scenario B (906 IEDs) for TDD
ratio 7 : 8. In all cases, WiMAX is the communication technology used in hop2. . . 63
ratio 10 : 5. In all cases, WiMAX is the communication technology used in hop2. . . 64 6.11 Number of IEDs with insufficient QoS in Scenario B (906 IEDs) for TDD
ratio 12 : 3. In all cases, WiMAX is the communication technology used in hop2. . . 65 6.12 Number of IEDs with insufficient QoS in Scenario B (906 IEDs) for TDD
ratio 14 : 1. In all cases, WiMAX is the communication technology used in hop2. . . 66 6.13 Number of IEDs with insufficient QoS in ScenarioC (2469 IEDs) for TDD
ratio 7 : 8. In all cases, WiMAX is the communication technology used in hop2. . . 69 6.14 Number of IEDs with insufficient QoS in ScenarioC (2469 IEDs) for TDD
ratio 10 : 5. In all cases, WiMAX is the communication technology used in hop2. . . 70 6.15 Number of IEDs with insufficient QoS in ScenarioC (2469 IEDs) for TDD
ratio 12 : 3. In all cases, WiMAX is the communication technology used in hop2. . . 71 6.16 Number of IEDs with insufficient QoS in ScenarioC (2469 IEDs) for TDD
ratio 14 : 1. In all cases, WiMAX is the communication technology used in hop2. . . 72
Glossary
3GPP Third Generation Partnership Project
AAM Advanced Asset Management
ADO Advanced Distribution Operation
AI Artificial Intelligence
AHC Agglomerative Hierarchical Clustering
AMI Advanced Metering Infrastructure
ANSI American National Standards Institute
AP Access Point
ATO Advanced Transmission Operation
BS Base Station
CAPEX Capital Expenditure
CH Cluster Head
CIGRE International Council on Large Electric Systems
D&D Design and Development
DECC UK Department of Energy and Climate Change
DNP3 Distributed Network Protocol 3.0
DOE US Department of Energy
GAT Generate and Test
GDP Gross Domestic Product
GS Greedy Search
HAN Home Area Network
IDCA Intelligent Deployment and clustering Algorithm
IEC International Electro technical Commission
IED Intelligent Electronic Device
IEEE Institute of Electrical and Electronics Engineers
IP Internet Protocol
IPv6 Internet Protocol version 6
ISO International Organization for Standardization
ITU International Telecommunication Union
JISC Joint Information Systems Committee
KATS Korean Agency for Technology and Standards
ML Machine Learning
NIST National Institute of Standards and Technology
OFDMA Orthogonal Frequency-Division Multiple Access
OPEX Operating Expenditure
PAM Partitioning Around Medoids
PCA Principal Component Analysis
PES Power & Energy SocietyTM
PICOM Piece of Information for Communication
PLC Power Line Communication
QoS Quality of Service
R&D Research and Development
RTP Real Time Protocol
SA Simulated Annealing
SCADA Supervisory Control and Data Acquisition
SF-SSCC CEN-CENELEC-ETSI Sector Forum on Smart and Sustainable Cities and Communities
SINR Signal-to-interference-plus-noise ratio
SVD Singular Value Decomposition
SVM Support Vector Machines
TDD Time Division Duplex
UDP User Datagram Protocol
UMTS Universal Mobile Telecommunications System
UTRA-TDD UMTS Terrestrial Radio Access - Time Divison Duplexing
WiMAX Worldwide Interoperability for Microwave Access
WSN Wireless Sensor Network
Abstract
The modern power grids, known as smart grids, rely on various advancements, one of them being the introduction of bi-directional communication. In some cases, data exchanged in the network is of critical importance. The data transmissions need to meet specific delay limits set by the regulatory agencies in order for the smart grid to function properly. Meeting these standards allows the use of new applications of monitoring, control and system protection, resulting in a more efficient, stable and environment-friendly system. This thesis presents a methodology for analysis and planning of wireless communication networks for smart grid, which uses a clustering algorithm to determine the optimal positions of the routers and gateways of the network to be installed. After, it calculates the delay for each Intelligent Eletronic Device that is a network subscriber. This way, an analysis can be made to obtain the Quality of Service requested for a specific network setup in a specific scenario. The results obtained in the performed case study show that it is possible to achieve a network topology that satisfies the maximum delay requirements of 100 % of its subscribers, using WiMAX or a combination of Wi-Fi and WiMAX. Also, the thesis explores a restricted communication mode that can temporarily suspend the transferences of non-critical data. In most scenario configurations, the restricted mode delivers all the data within the maximum delay. The software implementation of the proposed model is made publicly available under open-source license, so that anyone, including researchers, or private and public companies, can take advantage of it. The model presented in this thesis is customizable, allowing the use of other technologies and be used with other networks, including scenarios that are not related to smart grid.
Resumo
Os modernos sistemas el´etricos de potˆencia, conhecidos como smart grids, contam com v´arios avan¸cos, sendo um deles a introdu¸c˜ao de comunica¸c˜ao bidirecional. Em alguns casos, os dados trocados na rede s˜ao de importˆancia cr´ıtica. As transmiss˜oes de dados devem atender aos limites de atraso espec´ıficos estabelecidos pelas agˆencias reguladoras para que o smart grid funcione corretamente. O cumprimento desses padr˜oes permite o uso de novas aplica¸c˜oes de monitoramento, controle e prote¸c˜ao do sistema, que resul-tam em um sistema el´etrico mais eficiente, est´avel e ecol´ogico. Esta tese apresenta uma metodologia para an´alise e planejamento de redes de comunica¸c˜ao sem fio para smart grid que usa um algoritmo de clusteriza¸c˜ao para determinar as posi¸c˜oes ideais dos pon-tos de acesso e gateways da rede a serem instalados. Depois, calcula o atraso para cada dispositivo eletrˆonico inteligente que atua como o assinante da rede. Desta forma, uma an´alise pode ser feita para obter a Qualidade de Servi¸co almejada para uma determinada configura¸c˜ao de rede espec´ıfica em um cen´ario espec´ıfico. Os resultados obtidos no estudo de caso realizado mostram, que ´e poss´ıvel alcan¸car uma topologia de rede, que satisfa¸ca os requisitos de atraso m´aximo de 100 % dos seus assinantes, usando WiMAX ou uma combina¸c˜ao de Wi-Fi e WiMAX. Al´em disso, a tese explora um modo de comunica¸c˜ao restrito que pode suspender temporariamente as transferˆencias de dados n˜ao cr´ıticos. Na maioria das configura¸c˜oes de cen´ario, o modo restrito entrega todos os dados dentro do prazo m´aximo. A implementa¸c˜ao do software do modelo proposto ´e disponibilizada pub-licamente sob licen¸ca open-source, para que qualquer pessoa, incluindo pesquisadores, ou empresas privadas e p´ublicas, possa aproveit´a-lo. O modelo apresentado nesta dis-serta¸c˜ao ´e customiz´avel, permitindo o uso de outras tecnologias e ser usado com outras redes, inclusive para cen´arios que n˜ao s˜ao relacionados aosmart grid.
Chapter 1
Introduction
1.1
Motivation and Problem Definition
Electricity has long been a major driving force for development of the modern world, boosting world economy and innovation. Until today, however, fossil fuels still remain the major energy source [DOE, 2018; WWF, 2010]. Rising concerns on greenhouse gas emissions, increasing electricity prices and diminishing fossil fuels have also called for the modernizations of the power grid [Erol-Kantarci and Mouftah, 2015]. According to data from [World Bank, 2017], the overall global dependency on fossil fuels in all of energy consumption (not restricted to electricity) has been stagnant at 81 % between 1990 and 2013. Further, global CO2 emissions rose 60 % over the same period. This is mainly caused by growing countries, where major focus in regards to energy is its cost. Further, the overall energy consumption has been steadily increasing, meaning the gross amount of fossil fuel consumption has been growing as well.
Companies and governments alike push the transition towards renewable energy usage. As an example of the clean energy initiative, Google Inc. has recently reported on twitter1 about its investments in renewable energy sources, which bring the total capacity of the company to over 3 gigawatts, which is about as much as all of the company’s services used in 2017.
1https://twitter.com/Google/status/936279094605504513
2 A modern approach to the existing power grid and the electricity lifecycle itself, called smart grid, has been one of the key research topics of in the energy sector, especially in the past decade since its first appearance in an official document, the Energy Indepen-dence and Security Act of 2007 [EISA, 2007], released by the United States Congress. The vision of smart grid is a general evolution of the whole electrical grid towards more stable, efficient, and environmentally friendly system.
The importance of smart grid is also visible from the financial perspective. Na-tional Institute of Standards and Technology (NIST) reports about the The US invest-ments in [NIST 3.0, 2014], that every US$1 million of direct spending into the smart grid
sector increased the Gross Domestic Product (GDP) by US$2.5 to US$2.6 million. Since
the GDP multiplier is higher than many other potential forms of government investment, it makes smart grid a favorable investment product. Furthermore, smart grid deployment positively impacted employment and labor income throughout the US economy [DOE, 2013]. The reliability of smart grid is quite important, since the prevention of faults caus-ing outages cost US$25 billion to US$180 billion annually to the US economy [Kabalci,
2016].
Other technology that has become more and more part of our everyday lives is data communication. Since the dawn of the Internet in 1960’s our society has been making great leaps in technological development. Without a doubt, the Internet has accelerated progresses in various fields by interconnecting people and data around the globe, which has made sharing knowledge that much easier. In the modern society, we increasingly rely on the Internet as it has become incorporated to the way we work and enjoy our leisure time. The exchange of data has been used in a vast majority of fields and applications.
Table 1.1: Analogy between the internet and evolving smart grid. [Emmanuel and Rayudu, 2016]
Network characteristic Internet Network Smart grid network
Content Data (IP packet) Data and power
Network type Heterogeneous and complex Heterogeneous and complex
System architecture Hierarchical, distributed Hierarchical, distributed
and decentralized and decentralized
Transmission flow type Bidirectional flow of data Bidirectional flow of data and power
Protocol E.g., TCP/IP, HTTP, SMTP. E.g., Modbus, DNP3, IP,
DNP3 over TCP/IP.
Vulnerability/security risk Cyber and physical Cyber and physical
QoS requirements Transparency and accessibility Priority, critical and Latency
Network philosophy Ubiquitous, adaptive Ubiquitous, adaptive
and self-healing and self-healing
Description Network of networks Network of networks
Services range Multi-service Single service
Storage cost Low High
Resource management Distributed Distributed
Scalability Rapid and cheaper Slow and expensive
Standards RFCs by IETF E.g., IEC/ANSI/IEEE
of communication in smart grids is bi-directional and needs to meet certain specifications depending on a given smart grid application.
The communication patterns of smart grid applications are quite different from that of browsing or streaming applications that are widely used in other parts of our lives. As a result, the Quality of Service (QoS) requirements of smart grid applications differ from these traditional Internet applications, and so should the communication networks themselves. Yet, the communication networks themselves have not been structured to meet those needs.
4 It is stated in [Fan et al., 2013] that smart grid traffic needs to reiterate its tra-ditional research topics, namely resource allocation, routing and QoS. In [Taranetz and Rupp, 2012] for instance, future data traffic forecasts and power outage scenarios are made to define requirements of communication network capacity. And [Erol-Kantarci and Mouftah, 2015] reports, that optimal energy efficient network design in a smart grid environment has not yet been explored as well.
However, a gap is observed in the development of methodologies for optimal plan-ning of data network for smart grid, considering the constrains of the different kinds of smart grid applications. An interesting work is presented in [Xing et al., 2016], where the authors applied graph theory to model the problem of optimal location of power-line communication (PLC) access points (APs) to connect end nodes with a service provider through PLC. Since this is an NP-hard problem, the author employed a genetic algorithm to get feasible solutions. The main constrain observed in the paper is sum of communica-tion delays. However, in this work, the objective is to reduce the total accumulated delay and the QoS requirement to each one of the subscribers is not observed.
In a similar direction, this thesis presents a problem formulation, using graph theory, to model the search problem of optimal topology of data network. The delay con-strains for each network subscriber are considered. The term QoS can generally reference various factors of communication. The rest of this work uses the term QoS to denote specifically the delay component of QoS.
1.2
Objectives
equipment on the QoS of subscribers in a given scenario. To construct the methodology, the effectiveness of clustering techniques for this problem will first be studied.
Using sample scenarios and a software implementation of the methodology, case studies will be performed. Given the resulting QoS from the case study, an analysis will be carried out to validate the suitability of the used communication network configuration for the given scenario.
Specifically, this thesis has the following primary objectives:
• Study the communication patterns and requirements in smart grid systems;
• Perform various tests using a methodology that uses one type of network equipment,
with the objective of comparing the performance and suitability of clustering tech-niques for network cell deployment. Next, to indicate which clustering algorithm is the most appropriate in this application;
• Develop a methodology that uses two types of network equipment: access points
and gateways and uses a clustering technique suggested by the analysis from the previous objective;
• Perform a QoS analysis of both models in the form of a scenario-based case study.
The hypothesis given in this work is that it is possible to analyze capabilities of wireless network solutions for non-mobile communication networks, such as those of smart grid, in terms of delay-based QoS. Such calculations could then be performed in various configurations of the network to observe the behavior of the total QoS when the cofigurations change.
1.3
Work Organization
6 problem and analyze the results. Finally, the last chapter concludes the work and proposes possible future work in the area. The following paragraphs offer a more detailed view of the aforementioned chapters.
Chapter 2 presents the global concept of smart grid. General definition is presented in this chapter, together with specific details about communication, standardization efforts and devices present in the network.
Clustering and specific clustering methods related to this research are defined in chapter 3. First, however, a broader view of a related subfield of Artificial Intelligence (AI) is given, to help the reader understand the role of clustering.
In chapter 4, the work related to the objectives and focus of this thesis is discussed. Previous research that this thesis expands on is presented as well.
Chapter 5 formulates the specific proposed methodology and the approach towards solving the outlined problem, and those related to it. The structure, along with the key parts of the methodology, is described in this chapter as well. This methodology uses clustering technique to plan the topology of the data network and a graph model to calculate the communication delay of each subscriber.
Chapter 6 is dedicated to studying the performance of the proposed methodology, where the clustering technique is applied in two different ways. First, a study of four clustering algorithms is performed, to assess the algorithm that is the best fit for the proposed methodology. One layer of network equipment is considered for this study. Individual positions of the equipment for every scenario is determined by a clustering algorithm. Second, in every scenario, two layers of network equipment, that relay the communication, are considered. Equipment positions in each layer are obtained by the most suited algorithm, identified in the first step, i.e., the clustering algorithm is applied twice per scenario. The performance analysis is carried out using a suite of use cases, also outlined in the chapter. Both models are evaluated, using a variety of configurations over three different smart grid scenarios, concluded by an overall discussion to summarize the model performance.
Chapter 2
Smart Grid
2.1
Initial Considerations
This chapter introduces key concepts of smart grid, especially those that are related to this thesis. Starting with motivation and a general proposal in this section, the rest of the chapter is mostly dedicated to parts of smart grid associated to communication.
The challenges of today’s electricity grid, also calledpower grid, include generation diversification, optimal deployment of expensive assets, demand response, energy conser-vation. Further, reduction of the industry’s overall carbon footprint is a great issue, as major electric energy source are fossil fuels, which leads to high greenhouse gas emissions. Moreover, only one-third of fuel energy is converted into electricity, without recovering the waste heat [Farhangi, 2010; DOE, 2018; WWF, 2010; Erol-Kantarci and Mouftah, 2015].
With the aforementioned challenges and the increased usage and society’s depen-dency on electricity, as well as its increasing price, the evolution of the grid is necessary. The power grid system is undergoing a global innovation process towards a modern, effi-cient and environment-friendly, next-generation grid, called smart grid. This moderniza-tion is one of the most outstanding technological milestones and opportunities of the 21st century, similar to the internet evolution [Fang et al., 2012]. NIST, outlines the potential benefits and requirements of the smart grid in [NIST 3.0, 2014] using data from [DOE, 2012]:
• Enabling informed participation by customers;
• Accommodating all generation and storage options;
• Enabling new products, services, and markets;
• Providing power quality for the range of needs;
• Optimizing asset utilization and operating efficiency;
• Operating resiliently to disturbances, attacks, and natural disasters.
2.2
Smart Grid Communication
Smart grid uses two-way flows of electricity and information to create an automated and distributed advanced energy delivery network [Fang et al., 2012]. Because of this, many applications are being upgraded and developed to help manage the changing system. Smart grid application requirements, in terms of QoS and the ability of the existing communication technologies to meet those requirements, have been discussed in [Yan et al., 2013; Gungor et al., 2013]. In a report for United States Department of Energy (DOE), [NETL, 2008] defines four cardinal landmarks, which provide a guide to the realization of the smart grid. They include:
• Advanced Metering Infrastructure (AMI), which empowers and motivates the
cus-tomer and establishes commmunications to the loads, i.e. the devices connected an energy source;
• Advanced Distribution Operation (ADO), which enables self-healing;
• Advanced Transmission Operation (ATO), which addresses congestion;
• Advanced Asset Management (AAM), which supports asset optimization for
im-proved efficiency.
10
• Smart infrastructure system,
• Smart management system,
• Smart protection system.
AMI is a key achievement of smart grid that other applications rely on. In short, an AMI system is used to measure, acquire, and analyze the data about energy consumption and power quality of each consumer [Kabalci, 2016]. It is a two-way communication network comprised of a number of integrated technologies and applications: smart meters, sensors, wide-area communications infrastructure, home (local) area networks (HANs), Meter Data Management Systems, and Operational Gateways [NETL, 2008; Mahmood et al., 2015].
In case of applications responsible for control and measurement, sensors and actu-ators throughout the network exchange information with the server. The most important uses of this communication are [Bakken et al., 2011]: (i) state estimation; (ii) wide-area system protection; (iii) wide-area situational awareness; and (iv) post-event analysis.
Many of these applications involve end-to-end data exchange between energy providers, energy consumers, and field devices [Sooriyabandara and Ekanayake, 2010], including sensors, actuators, energy meters, control, phasor measurement units, energy storages, Intelligent electronic devices (IEDs). IEDs, for instance, are part of last mile communication, each one installed at site of an electric feeder, further refered to as feeder.
2.3
Smart Grid Standards
The communication constraints of smart grid applications differ from those of a traditional Internet use. It is therefore critical that the standardization of smart grid communication takes place so that the smart grid can become a reality [Gungor et al., 2011a]. A brief comparison between the existing energy grid and smart grid is outlined in Table 2.1.
hard-Table 2.1: A Brief Comparison between the Existing Grid and the Smart Grid [Farhangi, 2010], [Fang et al., 2012]
Existing Grid Smart Grid Electromechanical Digital
One-way communication Two-way communication Centralized generation Distributed generation Few sensors Sensors throughout Manual monitoring Self-monitoring Manual restoration Self-healing
Failures and blackouts Adaptive and islanding Limited control Pervasive control Few customer choices Many customer choices
ware has been suffering [Gungor et al., 2011b]. Moreover, the focus of the smart grid dif-fers with region. Fortunately, many regional standardizations have been developed [Silva, 2014].
In Europe for instance, according to [ETP, 2010], the future electricity networks must be:
• Flexible: fulfilling customers’ needs whilst responding to the changes and challenges
ahead;
• Accessible: granting connection access to all network users, particularly for
renew-able power sources and high efficiency local generation with zero or low carbon emissions;
• Reliable: assuring and improving security and quality of supply, consistent with the
demands of the digital age with resilience to hazards and uncertainties;
• Economic: providing best value through innovation, efficient energy management
and ’level playing field’ competition and regulation.
12 that reason, the standard prioritizes definition of cybersecurity, network communications, and seven key functionalities critical to ongoing and near-term deployments of smart grid technologies and services: (i) Demand response and consumer energy efficiency; (ii) Wide-area situational awareness; (iii) Distributed Energy Resources; (iv) Energy Storage; (v) Electric transportation; (vi) AMI; and (vii) Distribution grid management.
Seamless interoperability, robust information security, increased safety of new prod-ucts and systems, compact set of protocols and communication exchange are some of the objectives that can be achieved with smart grid standardization efforts [Gungor et al., 2011a]. Smart grid activities in Research and Development (R&D) and Design and De-velopment (D&D) are driven by researchers, government grants, and regulatory organs around the globe. According to [Silva, 2014] and [Gungor et al., 2011b], some of the most recognized standard development organizations are:
• NIST;
• DOE;
• European Technology Platform (ETP);
• UK Department of Energy and Climate Change (DECC);
• American National Standards Institute (ANSI);
• International Electro technical Commission (IEC);
• Institute of Electrical and Electronics Engineers (IEEE);
• International Organization for Standardization (ISO);
• International Telecommunication Union (ITU);
• Third Generation Partnership Project (3GPP);
• Korean Agency for Technology and Standards (KATS);
• Joint Information Systems Committee (JISC);
• CEN-CENELEC-ETSI Sector Forum on Smart and Sustainable Cities and
Table 2.2 gives a brief overview of smart grid standards, all of which are briefly discussed in [Gungor et al., 2011b]. Finally, [Fang et al., 2012; Fan et al., 2013; Chatz-imisios et al., 2013] also survey several major smart grid standardization roadmaps and studies in different countries.
2.4
Device Standardization
Supervisory Control and Data Acquisition (SCADA) is a traditional system built for measuring substation current and voltage using remote terminal units, and current and voltage transformers [Budka et al., 2014]. With the advent of smart grid, these devices are being replaced by IEDs, discussed below. Another common type of device used in smart grid is smart meter, a two-way communication device that measures energy consumption at the appliances (electricity, gas, water or heat) [Fan et al., 2013].
2.4.1
IEC 61850
In [IEC 61850, 2003] NIST defined the IEC 61850, which is one of the key standards in achieving interoperability in the smart grid environment [NIST 1.0, 2010] and the standard has since been accepted in the smart grid framework worldwide for common information exchange among IEDs within power substations [Guo et al., 2016]. The standard itself was released by International Electrotechnical Commission (IEC) in [IEC 61850, 2003] and defines communication parameters of various electric substation control and monitoring applications.
14
Table 2.2: Overview of Smart Grid Standards [Gungor et al., 2011b]
Type/Name of Standards
Details Application
IEC 61970 and IEC 61969
Providing Common Information Model: IEC 61970 works in the transmission domain and IEC 61969 works in the distribution domain
Energy management systems
IEC 61850 Flexible, future proofing, open standard, communication between devices in transmission, distribution and substation automation systems
Substation Automation
IEC 60870-6 /TASE.2
Data exchange between utility control centers, utilities, power pools, regional control centers
Inter-control center communications IEC 62351
Parts 1-8
Defining cyber security for the communication protocols
Information Security Systems
IEEE P2030 A Guide for smart grid inter-operability of energy technology and IT operation with the electric power system
Customer-side applications
IEEE P1901 High speed power line communications In-home multimedia, utility
and smart grid applications ITU-T G.9955
and G.9956
ITU-T G.9955 and G.9956 contain the physical layer specification and the data link layer specification
Distribution Automation, AMI
OpenADR Dynamic pricing, Demand Response Price Responsive and
Load Control
BACnet Scalable system communications at customer side Building automation
HomePlug Powerline technology to connect the smart appliances to HAN
HAN
HomePlug Green PHY
Specification developed as a low power, cost-optimized power line networking specification standard for smart grid applications
HAN
U-SNAP Providing manny communication protocols to connect
HAN devices to smart meters
HAN
ISA 100.11a Open standard for wireless systems Industrial Automation
SAE J2293 Standard for the electrical energy transfer from electric utility to Electric Vehicles
Electric Vehicle Supply Equipment ANSI C12.22 Data network communications are supported and
C12.19 tables are transported
AMI
ANSI C12.18 Data structures transportation via the infrared optical port
AMI
ANSI C12.19 Flexible metering model for common data structures and industry ”vocabulary” for meter data
communications
AMI
Z-Wave Alternative solution to ZigBee that handles the interference with 802.11/b/g
HAN
M-Bus European standard and providing the requirements
for remotely reading all kinds of utility meters
AMI
PRIME Open, global standard for multi-vendor interoperability AMI
G3-PLC Providing interoperability, cyber security, and robustness
AMI
SAE J2836 Supporting use cases for Plug-in Electric Vehicles communication
Electric Vehicle
SAE J2847 Supports communication messages between Plug-in Electric Vehicles and grid components
2.4.2
Intelligent Electronic Device
According to the IEC 61850 standard [IEC 61850, 2003], the IEDs refer to microprocessor-based controllers of power system equipment [Gellings, 2011]. An IED can provide multiple protective and control functions previously performed by a group of devices, like remote terminal unit or current transformer. This reduces the complexity of device topology in the substation [Gellings, 2011; Budka et al., 2014]. In 2011, IEDs using IEC 61850 were beginning to be deployed by utilities [Liu et al., 2011] and it is estimated that well over 80 % of substations will be using them by 2030 [Gellings, 2011].
IEDs are part of last mile communication and can be placed close to sensors or actuators to be monitored [IEEE 1815, 2012], or at the distribution feeder [Gong and Guzm´an, 2011]. To communicate with the server, today’s IEDs can take advantage of the already installed leading SCADA protocol suites, which include the traditional Distributed Network Protocol 3.0 (DNP3) and the more recently installed IEC 61850 standard, among others [McGranaghan et al., 2008; Curtis, 2005; Emmanuel and Rayudu, 2016].
2.4.3
Distribution Feeder
Apart from smart metering communication, another important part of smart grid is the energy distribution system itself. One of its key components is a distribution feeder or just feeder. Modern feeders can be equipped with IEDs especially to provide protection and to report the quality of energy in the system. An example diagram of three-phase feeder is shown in Fig. 2.1. Feeder is an important element, because it guides the development of the data network for smart grids, including applications and data network topology.
16
Figure 2.1: Sample distribution feeder. [Kersting, 2012]
2.5
Final Considerations
Chapter 3
Clustering
3.1
Initial Considerations
Machine Learning (ML) is a field of AI, which itself is a subfield of Computer Science. It is a concept of making computers learn based on provided data, called training data. ML program is meant to study and learn from the observed data. It creates some mathematical model of knowledge, which is after used to extract some information about the observed data. The popularity and importance of ML in a variety of sectors has been growing, especially in the past decade. ML comprises of Supervised Learning, Unsupervised Learning and Reinforcement Learning. Before proceeding to the topic of clustering, this chapter also briefly introduces Supervised and Unsupervised Learning in general.
3.1.1
The Role of Data
Both Supervised and Unsupervised Learning are data-driven, meaning they learn based on the observed data using some algorithm. The result is a decision model, defined by the data. This is the main differentiator from traditional programming approach, where models are usually defined by a set of rules, created by humans. The goal of ML is for the model to find rules automatically based on the provided data.
18 It is important for data to be ’good’ in various aspects, because the final model can only get as good as the underlying training data. Good data is well representative of the domain, range, as well as the noise in the data, is unbiased, does not contain irrelevant data or duplicates, and does not contain errors, such as typos, to name some of the most important ones. For this reason, raw data usually needs to be ’cleaned’ and preprocessed before it is used for learning.
3.1.2
Supervised Learning
In the case of Supervised Learning, one is able to observe the results of the training data, i.e. the data is labeled. A Supervised Learning algorithm creates a model to approximate the real functionY =f(X)+ǫ that generated the labelsY of the input data samplesX with some error ǫ. This process is also called fitting a function f. Supervised Learning is divided into two categories, classification and regression.
For the process of learning, data is separated into: testing data and training data, which is often further split between pure training data and validation data. The model learns only based on the training data set, while the levels of obtained knowledge and performance of the final trained model are analyzed using the testing data, which is excluded from the learning process.
3.1.2.1 Classification
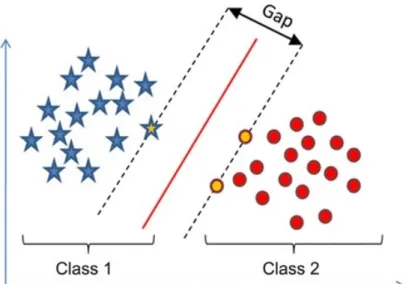
Figure 3.1: An example of classifying a data set into two classes using Support Vector Machines algorithm. Solid red line in the middle represents the separation hyperplane, i.e. the final classificator for the current problem.
Other classification types belong to the class of multi-class classification, where a set of possible outcomes is predefined and the ML algorithm aims to choose one of the possible outcomes or classes. This applies for applications like image recognition, where one might be interested in detecting the presence of more than one class in an image. An example of an Artificial Neural Network for multi-class classification is presented in fig. 3.2.
In both of the above classification types a softmax function is often applied on the results of data classification. Softmax transforms a set m of C arbitrary real value measurementsmi into probabilities σ(m)i for each of the C classes as
σ(m)i = e mi
PC c=1emc
. (3.1)
The class detection probability of i-th class for a sample with original measurements in vectorm can then be expressed by the probability σ(m)i, where
C X
i=1
20
Figure 3.2: Example of an Artificial Neural Network structure for a three-class classification problem. Four nodes in the input layer mean there are four features or dimensions taken as input for every datapoint.
3.1.2.2 Regression
Figure 3.3: Example of regression analysis performed over a set of datapoints.
A linear regression model can map the response variable y to k variables x1, x2, . . . , xk in a multiple linear regression model, so that
y=β0+β1x1+β2x2+· · ·+βkxk+ǫ , (3.3)
whereβ0 is the intercept,βi, i > 0 is the slope for thei-th variable, andǫ is the error that is to be minimized. Note that the linear regression model is linear in parameters βi, not in variablesxi. It is also important to note that a regression model alone, however strong empirical relationship it may show, does not imply a cause-and-effect relationship between variables [Montgomery et al., 2012], studied with the help of the Pearson coefficient, for example.
3.1.2.3 Overfitting
22 obtained knowledge for previously unseen data. An overfitted model yields very good results on training data, but its performance suffers when applied to testing data. When training error is much lower than testing error, the model is likely to be overfitted.
The problem of outliers is closely related to overfitting. Outliers are data samples that show abnormal or unexpected behavior (such as the value of its class label), with respect to the rest of the data. It is expected for the model to either take special measures regarding outliers or have problems returning correct results for them. Generally, such errors are allowed to occur for the purpose of combating overfitting. If a model learns to return correct results even for existing outliers, the model is likely to be overfitted.
It is desired to find a model that fits the functionf very well, but not necessarily perfectly, applying the concept of Occam’s Razor. The concept suggests that the model should not aim to be overly precise if it would mean a significant complexity increase.
3.1.3
Unsupervised Learning
Information can also be extracted from data that is not paired with results, i.e. from unlabeled data. This can happen both when mapping data to correct results is impossible, and when the correct results are previously unknown. This means that no measurement of the model accuracy can be performed. It also means that instead of separating testing from training data, all data is used for learning.
3.2
Clustering
The main part of Unsupervised Learning is clustering, also known as clusterization or cluster analysis. Its objective is to separate data into clusters. The desired final model maximizes similarity for data within clusters and minimizes similarity for data in different clusters.
The goal of clustering is to group similar data together, while separating dissimilar ones by partitioning into clusters (groups, subsets or categories). That is to create clus-ters considering the internal homogeneity and the external separation. Clustering highly depends on the distance measure used [Xu and Wunsch, 2005; Everitt et al., 2001; Pavan and Pelillo, 2003]. In the case of most clustering algorithms, the resulting clusters are represented by cluster heads (CHs), also called prototypes. An example of clustering is shown in fig. 3.4.
There are many clustering algorithms and their own variations for specific prob-lem types. These algorithms belong to clustering model types, such as centroid models, connectivity models, neural models, or density models.
Applications of clustering include object recognition in computer vision, image segmentation and in bioinformatics, for example, sequence analysis. The main clustering methods used in this thesis are presented below. Therefore, let n, k and τ denote the number of samples, number of clusters and number of algorithm iterations, respectively.
3.2.1
K-means
Introduced in 1957 and also known as the Lloyd’s algorithm, k-means is a basic example of centroid models. It assigns a single prototype vector to each cluster. The position of the CH minimizes the sum of squared Euclidean distances between data and their cluster’s CH by setting the vector in the mean of its cluster. The number of clusters
24
(a) Set of two-dimensional data samples used as input.
(b) Hypothetical division of the data set into 3 clusters.
(c) Example of final positions of 3 cluster heads and the separation into clusters chosen by a clustering algorithm.
Algorithm 1 K-means algorithm
1: Input:
2: X - the set of observations
3: K - the desired number of cluster heads
4: Output: 5: {CHk}K
k=1 - the set of cluster heads
6: {Ck}K
k=1 - the clustering (partitioning) of the data, where each data point is assigned to exactly one Ci
7: procedure K means(X, K)
8: 1. Initialize the cluster heads
9: for k ←1to K do
10: CHk ←initialize randomly
11: repeat
12: for k ←1 toK do ⊲ assign to closest cluster
13: Ck ← {x∈X :∀j,kx−CHkk2 ≤ kx−CHjk2}
14: for k ←1 toK do ⊲ update the cluster heads
15: if|Ck|>0then
16: CHk← 1
|Ck|
P x∈Ck
x
17: else
18: CHk← re-initialize
19: until ∀k :Ckτ+1 =Cτ
k ⊲ convergence reached
Common technique used with k-means is re-initialization. It increases the proba-bility of finding global minima by choosing different initial CH values. However, it cannot be guaranteed that the algorithm finds the global optimum. As to initialization, one of the strategies to set the initial CH vectors is to draw the vectors from the set of obser-vations without repeating the draws. The time complexity of k-means is relatively low atO(nKτ). Its disadvantage is the inability to handle categorical data and the fact that the algorithm is not suited for non-convex cluster shapes.
3.2.2
K-medoids
26 is closest to the cluster mean, thus minimizing the absolute error [Aggarwal and Reddy, 2016]. The value of the integerk is a required input parameter for the algorithm.
Compared to k-means, k-medoids is more robust by being less sensitive to outliers and extreme values. This is compensated by the algorithm’s rather high time complexity of O(K(n−K)2).
Algorithm 2 K-medoids algorithm
1: Input:
2: X - the set of observations
3: K - the desired number of cluster heads
4: Output:
5: {CHk}K
k=1 - the set of cluster heads
6: {Ck}K
k=1 - the clustering (partitioning) of the data, where each data point is assigned to exactly one Ci
7: procedure K medoids(X, K)
8: 1. Initialize the cluster heads
9: for k ←1to K do
10: CHk ←initialize randomly
11: 2. Iterate
12: repeat
13: for k ←1 toK do ⊲ assign to closest cluster
14: Ck ← {x∈X :∀j,kx−CHkk2 ≤ kx−CHjk2}
15: Randomly select a nonrepresentative example xi.
16: Compute the total cost S of swapping the representative example m with xi.
17: IfS < 0, then swapm withxi to form the new set of representative examples.
18: until ∀k :Ckτ+1 =Cτ
k ⊲ convergence reached
3.2.3
Agglomerative Hierarchical Clustering
There are two types of hierarchical clustering: agglomerative and divisive [Jain and Dubes, 1988]. Divisive opts for a top-down approach, where initially all observations are in one common cluster. The algorithm then selects a cluster for division, divides it into two, and repeats these steps until every observation is in its own cluster.
algo-rithm continues merging while updating a dissimilarity matrix until all the observations are in the only cluster remaining [Aggarwal and Reddy, 2016].
There are various linkage types one can use when dividing or merging, i.e. linking, the clusters and in fact any valid distance measure can be used. The most common ones for this application include minimum, maximum, mean or weighted mean distance between the elements of the clusters, and Ward’s method. Ward’s method minimizes the inner squared distance of the clusters being merged, resulting in the lowest increase of variance upon merging.
AHC and other hierarchical algorithms often represent the resulting cluster struc-ture as a dendrogram (a tree of clusters). It demonstrates the division or merge performed at each level of the algorithm and shows the resulting clusters for a dendrogram cut at any level. In the case of AHC, cutting the graph at level l results in n−l clusters and the algorithm can also be stopped once the desired level is reached. The time complexity of AHC is at least O(n2).
Algorithm 3 Agglomerative Hierarchical Clustering
1: Input:
2: X - the set of observations
3: Output:
4: Dendrogram representing clusters for each k ∈ {1. . . n}.
5: procedure AHC(X)
6: 1. Compute the dissimilarities between all examples fromX and store them in the dissimilarity matrix
7: 2. Iterate
8: repeat
9: Merge clusters as Ca∪b =Ca∪Cb
10: Insert a new row and column containing the distances
between the new cluster Ca∪b and the remaining clusters.
11: until One maximal cluster remains.
3.2.4
Affinity Propagation
28 propagation does not receive the integer k as a parameter. Although the value of k can be influenced by the diagonal of the given similarity matrix, the number of clusters is decided by the algorithm [Cheng and Day, 2014].
Algorithm 4 Affinity Propagation
1: Input:
2: X - the set of observations
3: s - the similarity matrix storing at si,j how similar is xi to xj,∀i6=j ∈ {1. . . n}, while si,i stores the preference ofxi becoming an exemplar ∀i∈ {1. . . n}.
4: Output: 5: {CHk}K
k=1 - the set of cluster heads
6: {Ck}K
k=1 - the clustering (partitioning) of the data, where each data point is assigned to exactly one Ci
7: procedure AffinityPropagation(X)
8: 1. Initialize availabilitiesa(i, k) to zero ∀i, k
9: 2. Iterate 10: repeat
11: Update all the responsibilities given the availabilities
12: Update all the availabilities given the responsibilities
13: Combine availabilities and responsibilities to obtain the exemplar decisions
14: until Termination criterion is met.
Before the algorithm is executed, the numerical preferences of each observation becoming a prototype are chosen and passed as an argument to the algorithm. Setting all preferences to the median of all data points is often applied in practice.
The algorithm itself has a time complexity ofO(n2τ) and can be thought as about as passing messages between pairs of data points. These messages express the suitability of one sample to be the exemplar of the other. The message values are being iteratively updated until the communication converges to a final set of clustering prototypes.
3.3
Final Considerations
Chapter 4
Related Work
4.1
Initial Considerations
In the recent years, two interconnected works were published that have the ob-jective of optimizing QoS in a data network in smart grids. Both of them use PLC as a communication technology and a standardized scenario with 13 users to study the results. The types of the equipment and their position are also equal.
First, [Silva, 2014] studies the effect of the network topology on the communication QoS in a smart grid scenario using an analytical model. The network has pre-defined communication equipment and their available positions. A search is performed in the space of topologies using a genetic algorithm, where every chromosome represents one topology. The best of the found topologies satisfies the QoS requirements of 10 out of 12 users. The author uses a restriction of communication, which considers only a subset of messages to be transferred, thus lowering the network traffic. In this case, the network reaches a total QoS of 100 %. Two more analitical models are also introduced, that are used to perform an optimization, using a Markov Decision Process, to determine the optimal policy for controlling the use of a shared data rate.
In [J´ulio, 2015], the state space of possible topologies was searched using a genetic algorithm and Dinitz’s max flow algorithm was used to calculate the maximum flow in the network graph. The obtained results show that in most cases, a suboptimal topology is found, resulting in 2 out of 12 users with exceeded time delays. Another topology
with 100 % is also found; however, with less frequency. The work also compares the result to those using a brute-force approach, also analyzing the execution time. The author suggests that the work can be utilized by future research by using the same graph model and substituting other transmission technologies, such as mesh Wi-Fi, Worldwide Interoperability for Microwave Access (WiMAX) and optical networks.
In a similar direction, this thesis presents a problem formulation using graph theory to model the search problem of optimal topology of data network. This thesis also shares the objective of minimizing the total QoS of the network in a given scenario. To compare the works better, one of the scenarios used in this thesis, denoted as ScenarioA, is equal to the one both of these publications used.
4.2
Related Work
This section discusses recent publications in the area of smart grid network de-ployment strategies or multi-level communication dede-ployment, which are related to this thesis, as well as research challenges in smart grid communications.
32 of a node based on the calculated partial force. The results show that IDCA with the local clustering approach successfully reached uniform distribution in the area and total area coverage. In all other metrics (convergence distance and its standard deviation, time, and uniformity) IDCA performs similarly or even outperforms the pure peer-to-peer approach. Importantly, the average distance travelled by a node is reduced by more than a factor of two, while the standard deviation is also lower. This means lower energy use as well as a longer network lifetime.
Cellular network design method using Simulated Annealing (SA) algorithm is pre-sented in [Ekici and Ersoy, 2001]. The research introduces the use of SA as an optimization algorithm to determine multi-tier network that minimizes the implementation cost of the network. The study focuses on cellular network for mobile users, where techniques, such as handoff, i.e. switching connection from one cell to another, need to be taken into consideration. Therefore, the effect of user mobility, call duration, and call arrival rates are some of the principal parameters of the study. SA is compared with Greedy Search (GS) algorithm and a random solution generator, Generate and Test (GAT), as a solution reference. Results show that in most cases of the scenario configuration the SA algorithm outperforms the GS algorithm. Comparing the solution quality with GAT shows that SA is able to find a solution either better than GAT or performing very similarly. Fi-nally, the proposed directions of future work include other optimization algorithms, other neighborhood functions for the SA algorithm, and studying more than two levels of the network.
veri-fied through comparisons with an actual 4G macrocell deployment, concluding that the proposed deployment model is as good as the hexagonal grid model.
One of the engineering and research challenges in the communications technology area of smart grid in [Sooriyabandara and Ekanayake, 2010] is QoS provisioning. Ac-cording to the article, state of the art QoS concepts considered by most communications networks and application developers will not be sufficient in the smart grid networks. Guaranteed delivery and strict deadlines on message-level delivery times are some of the restrictions that will have to be met. The article adds, that this raises need for defining and developing solutions considering application, service and infrastructure requirements of the smart grid. Techniques to integrate and implement these novel QoS requirements will also need to be developed.
Observing the recent publications in the area, much research is being conducted to: study the impacts of control and communication system vulnerabilities on power systems under contingencies [Rahnamay-Naeini et al., 2012]; evaluate, through proto-typing or modeling, the feasibility of using several technologies for transmitting data for the purpose of implementing smart grids, e.g. [Noorwali et al., 2016; M¨uller et al., 2012; Kheaksong et al., 2016]; characterize QoS requirements of smart grid applications, e.g. [Bakken et al., 2011; Alcatel-Lucent, 2010]; propose conceptual architectures for the implementation of data transmission networks capable of meeting the restrictions of the smart grid applications, e.g. [Vallejo et al., 2012; Islam and Lee, 2012; Asbery et al., 2016]; develop algorithms and methodologies to ensure compliance of new protocols, like Internet Protocol version 6 (IPv6), with the QoS requirements for these different classes of applications, e.g. [Chakraborty and Chaki, 2015].
4.3
Final Considerations
34 The publications identified as related to this topic are few and far between. This can be seen in the previous section, where few publications have been identified that relate to the topic. More importantly, no work has been found to study or improve the planning strategy with regards to QoS in smart grids, with or without using computer science techniques to automate the optimization process. This indicates the lack of academic research in the area, which corresponds to and supports the identified research gaps in the same area.
Chapter 5
Proposed Methodology
5.1
Initial Considerations
The smart grid components, including the specific communications, are developed and specified by the research community around the world. It is necessary to ensure that QoS requirements are reached by applications of the smart grid defined by standards, such as IEC 61850. Therefore, in this chapter, the methodology proposed in this thesis to analyze the problem of planning of an adequate data network topology is presented. This methodology combines a clustering technique to define the data network topology, and graph theory to compute the maximum delay for each subscriber. The proposed approach computes transmission delays per subscriber based on the subscriber specifications and the network topology. In the rest of this thesis, the terms user, subscriber and IED are used interchangeably.
5.2
Motivation and Objective
The objective of this research is to develop a practical methodology, which is used to analyze the QoS of the messages involved in the communication of smart grid applications. The methodology is developed to perform the following steps, given a scenario defined according to section 5.3:
36 1. Determine positions ofk1access points andk2gateways using a clustering algorithm, where numbers k1 and k2 are given. Do so based on the positions of the network subscribers;
2. Define optimal topology for upstream and downstream communication;
3. Calculate the data rate on each communication link in the network, based on the topology from step 2.
4. Given the amount of data to transfer per network subscriber, calculate delay for each subscriber and direction of communication. Compare this delay to a given maximum delay.
5. Evaluate if QoS was reached for each subscriber and display results.
Given the results from step 5, an analysis needs to be carried out to validate the suitability of the used communication network configuration for the given scenario.
In this work, QoS is the key performance indicator of the network suitability in a given scenario. Using explicit amounts of data to transfer, paired with maximum delay, the methodology determines whether or not are the messages of a subscriber delivered within the predefined time limit.
5.3
Scenario Definition
Application Server
Gateway (layer2) Access Point (layer1)
Subscriber (layer0) Wired connection (hop3)
Wireless connection 2 (hop2) Wireless connection 1 (hop1)
IP Network (layer3)
Figure 5.1: Communication structure of the proposed methodology.
5.3.1
Subscriber Configuration
Two-dimensional Cartesian coordinates define the key part of the scenarios. To-gether with the coordinates, each node is specified by the size of its messages and maxi-mum tolerated delay for both uplink and downlink. Nodes can be also split into groups and these properties would be defined per group.
38 To summarize, the methodology uses the following subscriber configurations to define a scenario:
1. Two-dimensional Cartesian coordinates of network subscribers;
2. Communication types that specify the amount of data to transfer and maximum tolerated delay, separately for uplink and downlink;
3. Roulette-style probabilities used to assign one communication type for each sub-scriber.
5.3.2
Network Configuration
The network proprieties are determined by specifying the number of access points and gateways, and describing the communication technologies used in each communication hop.
Wireless technologies rely on detailed specification to calculate the channel capaci-ties, which includes the operating frequency, bandwidth, number of frequency bands, and power and gain per equipment category in every hop.
Finally, the methodology also requires that Time Division Duplex (TDD) is specified by the fraction of time allocated for uplink and downlink, represented by TDDup and TDDdown respectively, where TDDup, TDDdown ∈ [0,1]. The methodology puts no restriction on the sum of TDDup and TDDdown, although in most use cases TDDup+ TDDdown = 1.
To summarize, the methodology uses the following network configurations to define a scenario:
1. Clustering algorithm to use;
2. k1 and k2, i.e. the number of access points and gateways respectively;
3. Wireless communication technology for hop1 and hop2: operating frequency, band-width, number of frequency bands, number of TDD time frames;
5. Data rate in hop3;
6. TDD ratio used in all hops.
5.4
Methodology Components
5.4.1
Clustering
The set of coordinates serves as an input of n data points for a clustering algo-rithm, which is performed twice. First, the n coordinates are clustered using a specified algorithm, creatingk1 CHs, whose coordinates form layer1. Second, the layer1 set serves as an input for the second round of clustering. This generates a set ofk2 CHs, that repre-sent layer2. Sets layer1 and layer2 determine the positions of access points and gateways respectively.
Clustering algorithms used in the proposed methodology perform clustering purely based on the provided coordinates. That means the CHs are also defined by two-dimensional coordinates. These coordinates are then used as network cell positions. If the used clustering algorithm is based on Euclidean distances, this distance is then an actual Euclidean distance, i.e. distance in a straight line, between two points.
It is important to study which clustering algorithms are the most suitable for this application. This is because algorithms vary and so do the values of CHs. Given that all clustering algorithms are able to process two-dimensional set of examples, most clustering algorithms can be used for this methodology.
![Table 1.1: Analogy between the internet and evolving smart grid. [Emmanuel and Rayudu, 2016]](https://thumb-eu.123doks.com/thumbv2/123dok_br/16294455.716928/24.892.142.792.174.521/table-analogy-internet-evolving-smart-grid-emmanuel-rayudu.webp)
![Table 2.1: A Brief Comparison between the Existing Grid and the Smart Grid [Farhangi, 2010], [Fang et al., 2012]](https://thumb-eu.123doks.com/thumbv2/123dok_br/16294455.716928/32.892.267.670.194.430/table-brief-comparison-existing-grid-smart-grid-farhangi.webp)
![Table 2.2: Overview of Smart Grid Standards [Gungor et al., 2011b]](https://thumb-eu.123doks.com/thumbv2/123dok_br/16294455.716928/35.892.127.810.214.1111/table-overview-smart-grid-standards-gungor-et-b.webp)
![Figure 2.1: Sample distribution feeder. [Kersting, 2012]](https://thumb-eu.123doks.com/thumbv2/123dok_br/16294455.716928/37.892.205.723.139.619/figure-sample-distribution-feeder-kersting.webp)