_____________________________
*) Corresponding author: [email protected]
doi:
10.2298/SOS1001025P
UDK 622.785:666.122.3
Master Sintering Curve – A Practical Approach to its
Construction
V. Pouchly
*), K. Maca
Department of Ceramics and Polymers, Brno University of Technology, Technická
2896/2, 616 69 Brno, Czech Republic
Abstract:
The concept of a Master Sintering Curve (MSC) is a strong tool for optimizing the sintering process. However, constructing the MSC from sintering data involves complicated and time- consuming calculations. A practical method for the construction of a MSC is presented in the paper. With the help of a few dilatometric sintering experiments the newly developed software calculates the MSC and finds the optimal activation energy of a given material. The software, which also enables sintering prediction, was verified by sintering tetragonal and cubic zirconia, and alumina of two different particle sizes.
Keywords: Alumina, Zirconia, Sintering, MSC, Densification prediction
Introduction
Sintering is a thermally activated process with the development of bonds between particles as a result of the motion of atoms and ions, together with the reduction of porosity. Since the motion of atoms and ions in solids is generally realized via diffusion, there is a strong dependence of sintering on temperature. One of the promising methods how to describe and predict sintering is the concept of а Master Sintering Curve (MSC) developed by Su and Johnson [1].
MSC is derived from the sintering theory proposed by Hansen and co-workers [2]. The model relates the linear shrinkage rate of a compact to grain boundary and volume diffusion coefficient, surface tension and microstructure variables:
⎟
⎠
⎞
⎜
⎝
⎛
Γ
+
Γ
Ω
=
−
3 4G
D
G
D
kT
Ldt
dL
γ
v v bδ
b, (1)
where
γ
is the surface energy,Ω
is the atomic volume, k is the Boltzmann constant, T is the absolute temperature, G is the mean grain size, t is the time, L is the sample length, Dv is thecoefficient of volume diffusion, Db is the coefficient of grain boundary diffusion,
δ
is thethickness of grain boundary and
Γ
represents geometric factors as the driving force in sintering.To evolve MSC the following assumptions have been made - the shrinkage is isotropic and the sintering process is governed only by a single dominating mechanism [1]:
dt
RT
Q
T
d
G
D
k
n t⎟
⎠
⎞
⎜
⎝
⎛−
=
Γ
Ω
∫
∫
exp
As it can be seen, there are only microstructure variables (grain size G and density ρ) on the left side of Eq. (2), while the right side of Eq. (2), usually denoted as
dt RT Q T t T t t
∫
⎟ ⎠ ⎞ ⎜ ⎝ ⎛− ≡ Θ 0 exp 1 )) ( ,( , (3)
presents the thermal history of the sintering process. If we are able to find one single activation energy Q for which the functions
ρi = f(Θi) (4)
(where Θi are the thermal histories of different sintering heating profiles) are overlapping, we
have found the so-called MSC. In such a case the grain size is independent of thermal history and it is only a function of density (of course, the same powder compacts have to be used for all experiments). This fact was confirmed for many ceramics [3-10] and metal powder compacts [10,11] during the last 30 years. Using the concept of MSC the density evolution of a given powder compact at different heating schedules can also be predicted.
Unfortunately, the calculation of dependences ρi= f(Θi) needs repeated numerical
calculations which are user-unfriendly. In this work we present simple software which significantly simplifies the calculation of MSC. Additionally, we compare the commonly used criterion of overlap of ρi= f(Θi) curves (Mean Residual Squares, MRS in the following) with
our newly proposed criterion (called Mean Perpendicular Curves Distance, MPCD in the following). The advantages of our approach are demonstrated by evaluating the sintering of two different alumina- and two different zirconia-powder compacts.
2. Criteria of
ρ
i= f(
Θ
i) curves overlap
The standard statistical approach to evaluating the scatter of experimental data is the minimization of MRS. This criterion was used in many recent papers [1,5,12,13] to determine the sintering activation energy and construction of MSC and is described, for example, in [12] by the following formula:
(
)
(
)
ρ
ρ
ρ
ρ ρd
N
RS
f N i avg i f∫
∑
=−
Θ
Θ
−
=
0 1 2 01
/
1
M
, (5)where Θavg is the average of all Θi at a given density, N is the number of heating profiles used,
and ρ0 or ρf are green or final densities of the sample.
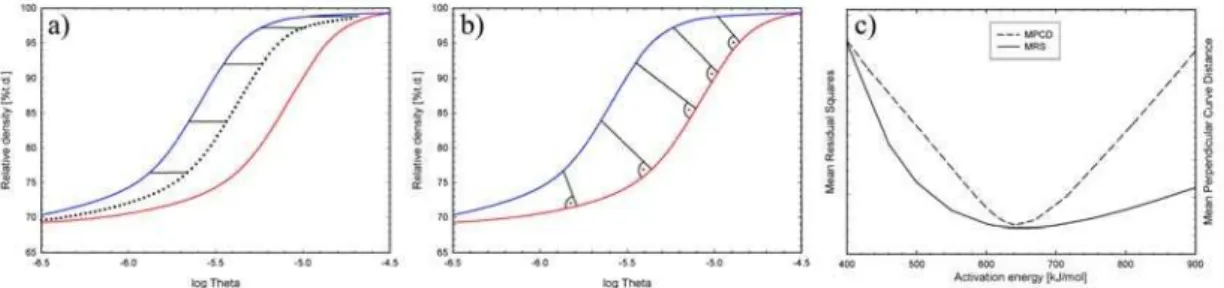
Fig. 1. Criteria for determination of overlap of individual MSCs: a) Mean Residual Squares; b)Mean Perpendicular Curve Distance; c) Comparison of both methods
the MPCD method we follow Eq. 6
MPCD =
( )
ρ
ρ
ρ
ρ
ρρ
d PD
f
f N
i i
∫
∑
= −0 0
1 , (6)
where the perpendicular distance (PD) of individual curves is evaluated (Fig. 1b) instead of horizontal ones (Fig. 1a).
Fig. 1c shows a typical dependence of MRS and MPCD on the chosen activation energy of the same sample. The activation energy of sintering process is given by the minimum of MRS or MPCD. It can be seen that the dependence is flatter for the MRS criterion and therefore the activation energy can be evaluated more precisely using the MPCD criterion.
3. Software for calculation of MSC
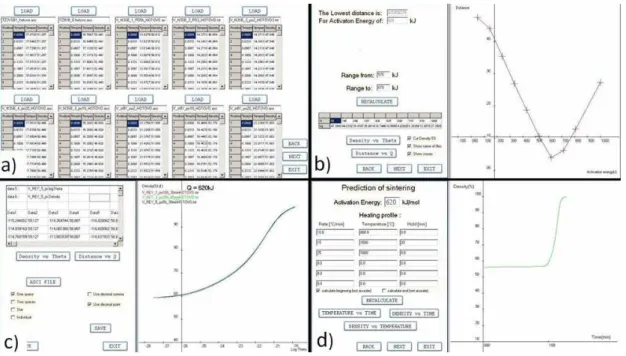
Since all calculations associated with MSC are complicated and time-consuming, we have developed an automatic procedure simplifying the construction of MSC. The software can import (in the xls, asc or txt formats) up to 10 different densification curves (Fig. 2a). Then the dependence of MPCD (or MRS) on activation energy is calculated (Fig. 2b). The user can refine the scale and find the activation energy more precisely. Finally the best overlap of the curves is shown and data are exported again in the xls, asc or txt format (Fig. 2c).
Fig. 2. Steps of calculation of MSC: a) Import of data; b) The dependence of MPCD (or
MRS) on activation energy; c)The best overlap of MSCs and export of data; d) The prediction via MSC concept
numerical calculation of Eq. (2), the software enables also this option (Fig. 2d). The software is freely available for the research community and can be requested via email to authors.
4. Experimental
Materials
Four types of commercially available ceramic powders were used. The details of these powders are given in Tab. I. The particle size DBET was calculated from a specific
surface area established by nitrogen absorption (BET method, ChemBet 3000, Quantachrome, USA). The following values of theoretical densities were used for the calculation of average particle size from the specific surface area (as well as in further text for the calculation of
relative densities): ρth(TAI) = ρth(REY) = 3.99g.cm-3; ρth(Z3Y) = 6.08g.cm-3; ρth(Z8Y) = 5.99g.cm-3.
Tab. I BET particle size of ceramic powders used
Powder Producer Grade Abbreviation DBET [nm]
Al2O3 Taimei Chemicals,
Japan
Taimicron TM-DAR
TAI 100
Al2O3 Malakoff Industries,
USA
RC-HP DBM
REY 240
ZrO2
(+3mol%Y2O3)
Tosoh Corporation, Japan
TZ-3YSB Z3Y 140*
ZrO2
(+8mol%Y2O3)
Tosoh Corporation, Japan
TZ-8YSB Z8Y 140*
* values of specific surface area given by the producer
Preparation of Ceramic Green Bodies
Disks of 30 mm in diameter and ca. 5 mm in height were prepared from the above materials, via cold isostatic pressing (CIP). Pressing was carried out in an isostatic press (Autoclave Engineering, Inc., USA) at a pressure of 300 MPa with a dwell time of 5 minutes. The CIPed samples were presintered at 800°C/1h, then cut and ground in the shape of prisms of ca. 4x4x15mm for sintering in the dilatometer.
Sintering of ceramic bodies
5. Results and discussion
Construction of MSC
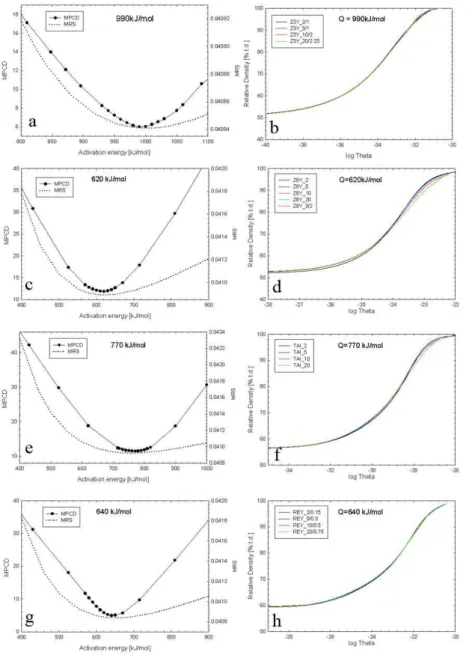
The master sintering curve was calculated for all four materials with all heating rates given in Tab. II. The minimum distance of curves ρ=f(Θ) was calculated using the two criteria mentioned. Figs 3a,c,e,g show the influence of MPCD and MRS on a selected activation energy. All graphs contain only one minimum; in all cases this minimum was deeper for the MPCD criterion. An overview of all the calculated activation energies is given in Tab. III, and MSCs constructed with these activation energies are plotted in Figs 3b,d,f,h. This paper should only demonstrate the possibility of quickly and precisely constructing the MSC. A detailed discussion of activation energies obtained in this work will be given in a follow-up paper.
Fig. 3. The dependence of MPCD on activation energy and the overlap of MSCs for a,b)
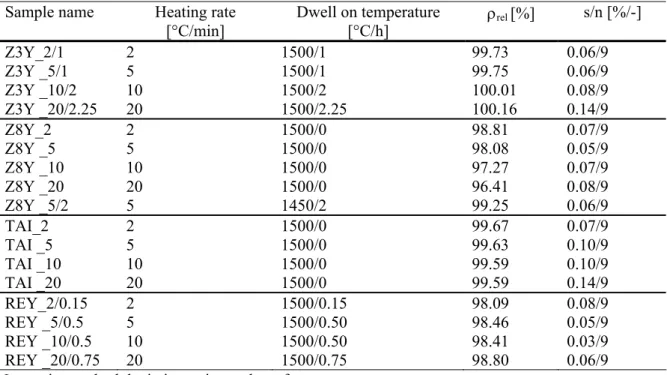
Tab. II. Sintering schedules and reached densities
Sample name Heating rate [°C/min]
Dwell on temperature [°C/h]
ρrel [%] s/n [%/-]
Z3Y_2/1 2 1500/1 99.73 0.06/9
Z3Y _5/1 5 1500/1 99.75 0.06/9
Z3Y _10/2 10 1500/2 100.01 0.08/9
Z3Y _20/2.25 20 1500/2.25 100.16 0.14/9
Z8Y_2 2 1500/0 98.81 0.07/9
Z8Y _5 5 1500/0 98.08 0.05/9
Z8Y _10 10 1500/0 97.27 0.07/9
Z8Y _20 20 1500/0 96.41 0.08/9
Z8Y _5/2 5 1450/2 99.25 0.06/9
TAI_2 2 1500/0 99.67 0.07/9
TAI _5 5 1500/0 99.63 0.10/9
TAI _10 10 1500/0 99.59 0.10/9
TAI _20 20 1500/0 99.59 0.14/9
REY_2/0.15 2 1500/0.15 98.09 0.08/9
REY _5/0.5 5 1500/0.50 98.46 0.05/9
REY _10/0.5 10 1500/0.50 98.41 0.03/9
REY _20/0.75 20 1500/0.75 98.80 0.06/9
Note: s is standard deviation, n is number of measurement
Tab. III. Sintering activation energies calculated by different criterions
Powder Criterion Z3Y Z8Y TAI REY
MPCD 990 620 770 640
Activation energy
[kJ/mol] MRS 1000 620 760 650
Prediction via MSC concept
Knowing the value of activation energy and shape of MSC for a given powder compact, it should be possible to predict its densification behavior. This possibility was tested with TAI alumina green bodies, which were sintered at a constant heating rate (10°C/min) to three different dwell temperatures. Tab. IV shows the comparison of predicted and actually obtained final densities while Fig. 4 represents the good agreement of predicted densification profiles with the actual ones.
Tab. IV. The comparison of predicted and really reached final densities of TAI samples
sintered at three different temperatures and dwell times
Sample name Type Temperature [°C] Dwell [min] ρrel [%]
1350/120_A prediction 1350 120 99.50
1350/120_B experimental 1350 120 99.62
14000/46_A prediction 1400 46 99.60
14000/46_B experimental 1400 46 99.64
1450/8_A prediction 1450 8 99.60
Fig. 4. Prediction and experimental verification of densification profiles of TAI alumina samples
6. Conclusion
A practical method for the construction of MSC is presented in the paper. With the help of a few dilatometric sintering experiments the newly developed software calculates MSC and finds the optimal activation energy of a given material. The method was verified on cubic and tetragonal zirconia powder compacts and on two alumina powder compacts of different particle sizes. Also the possibility of predicting the sintering behaviour via MSC concept was presented.
Acknowledgement
The authors gratefully acknowledge the funding provided by the Czech Ministry of Education under grants OC0915 (COST 539 Action) and MSM 0021630508, and dr. B.Maros for valuable discussions.
References
1. H. Su, D. L. Johnson. J. Am. Ceram. Soc., 79 (1996) 3211.
2. J. D. Hansen, R. P. Rusin, M. H. Teng, D. L. Johnson. J. Am. Ceram. Soc., 75 (1992) 1129.
3. J. Wang, R. Raj. J. Am. Ceram. Soc., 73 (1990) 1172. 4. H. Su, D. L. Johnson. J. Am. Ceram. Soc., 79 (1996) 3199. 5. W. Q. Shao, S. O. Chen, D. Li. Sci. Sintering, 40 (2008) 251.
6. D. C. Blaine, S. J. Park, R. M. German. J. Am. Ceram. Soc., 92 (2009) 1403.
7. T. R. G. Kutty, K. B. Khan, P. V. Hedge, A. K. Sengupta, S. Majumdar. Sci. Sintering, 35 (2003) 125.
8. K. Maca, S. Simonikova. Journal of Material Science, 40 (2005) 5581.
11. I. M. Robertson, G. B. Schaffer. Minerals, Metals & Materials Society DOI: 10.1007/s11661-009-9894-1.
12. S. J. Park, R. M. German. Int. J. Materials and Structural Integrity, 1 (2007) 128. 13. M. Mazaheri, A. Simchi, M. Dourandish, F. Goltestani-Fard. Ceram. Int., 35 (2008)
547.
14. K. Maca, V. Pouchly, A. R. Boccaccini. Sci. Sintering, 40 (2008) 117.
Са р а: К ђ ѕ
. М ђ ,
. У
.
. , ђ
ђ
.
К учн р чи: А , , , ђ