_____________________________
doi: 10.2298/SOS1603317P
UDK 546.62; 546.831; 622.785; .001.572
A Practical Approach for the Calculation of the Activation
Energy of the Sintering
Pouchly Vaclav
*), Hruby Jan, Maca Karel
CEITEC BUT, Brno University of Technology, Technicka 10, 616 00 Brno, Czech
Republic
Abstract:
Newly developed software for calculation of activation energy (Qs in the following) of
sintering using the Wang and Raj model is presented. To demonstrate the practical potential of the software and to evaluate the behaviour of the Qs during the sintering process, alumina
and cubic zirconia ceramic compacts were prepared from nanometric powders. The results obtained with both materials are in agreement with previously published data calculated by different approaches. In the interval of interest (relative densities from 60 % to almost 100 % of theoretical density), both materials show similar behaviour. Three distinct regions can be seen: the initial constant values of Qs 868 kJ/mol and 762 kJ/mol for alumina and cubic zirconia, respectively; a region containing linear drop of Qs and the final region of constant Qs values 625 kJ/mol and 645 kJ/mol for alumina and cubic zirconia, respectively.
Keywords: Sintering, Activation energy, Alumina, Zirconia.
1. Introduction
The ceramic processing starts from the synthesis of ceramic powder and green body formation. The compacted green body is usually porous and fragile. To obtain desired functional properties, the sintering step has to be introduced [1]. During the sintering process, the green body is heated at temperatures approaching melting. This allows pores to shrink and disappear, which leads to densification. The sintering process is divided into three stages [2]. During the initial stage, the surface of the particles is smoothed and there is an initiation of the neck formation [3]. During the intermediate stage, the necks grow quickly and high overall shrinkage of the green body occurs. The porosity rapidly decreases and grain boundaries are formed. When the density reaches its critical value, the pores are no longer interconnected and the green body enters the final stage of sintering. The pores are now closed, thus their shrinkage rate is slow and even more difficult. The final sintering stage is usually connected with rapid grain growth, as a way of disappearance of stable pores [4].
To describe the non-equilibrium thermodynamics and kinetics of sintering, the knowledge of the activation energy of all contributing mechanisms is essential. However, it is difficult to experimentally measure the activation energy of sintering (Qs in the following) of
each sintering mechanism separately. Fortunately, the Qs of the whole sintering process can
be evaluated. Two particular models, among others, caught attention of scientists in recent years such as Master Sintering Curve model (MSC in the following) [5] and the Wang and Raj model [6]. Few years ago, we developed the software for evaluation of the Qs by the MSC
model [7]. Since the publication of the MSC software, the ceramic society has showed interest
P. Vaclav et al. /Science of Sintering, 48 (2016) 317-324
___________________________________________________________________________
318
in such applications, so we would like to contribute further in this topic. The aim of this paper is to present software for calculation of the Qs using the Wang and Raj model. With the help
of newly developed software, we can easily evaluate the Qs in wide density range. To show
the scientific impact of this engineering approach, we present calculations of Qs for two
common materials, pure alumina and cubic zirconia. The new data would help to understand the sintering process of these materials even further.
The Wang and Raj model
The model of Wang and Raj is based on a model of Young and Cutler [8, 9]. They combined the model of shrinkage during sintering with a thermodynamic background, to find the Qs. Their model is based on a densification rate according to Eq. 1:
n RT Q
G
f
T
e
A
dt
d
ρ
=
− /(
ρ
)
(1) where,
R
V
C
A
3 / 2γ
=
(2)C is a constant, V is molar volume and f(ρ) is a function only of a density. The densification rate can be also written as:
dt dT dT d dt
dρ = ρ
(3)
Combining and logarithm of Eq. 1 and 3, Eq. 4 will be obtained:
(
f
)
A
n
G
RT
Q
dt
dT
dT
d
T
sln
(
)
ln
ln
ln
⎟
=
−
+
+
−
⎠
⎞
⎜
⎝
⎛
ρ
ρ
. (4)
When a plot of the left-hand side of the Eq. 4 is plotted against 1/T, the slope of the line determines the Qs. This calculation is valid only if no grain growth occurs. Unfortunately, the
grain size constantly increases during the sintering process [2]. Nevertheless, when the grain size evaluated for one specific relative density is not dependent on heating schedule, the equation still can be solved [10].
To practically calculate the Qs, at least three dilatometry measurements at different
heating rates are recommended. Firstly, exact density value is chosen and the densification rate is calculated for all heating rates used. Then assumption of no grain growth, or that the grain size at the specific relative density is not dependent on the heating schedule [10] is made. Now, the left side of Eq. 4 at the specific relative density for all heating rates is calculated. When the left hand side of Eq. 4 is plotted against 1/T, a point belonging to each heating rate used is obtained. If all presumptions are valid, these points lay on a line which slope determines the Qs.
WaR Software
Fig. 1. Processing scheme of the presented software.
P. Vaclav et al. /Science of Sintering, 48 (2016) 317-324
___________________________________________________________________________
320
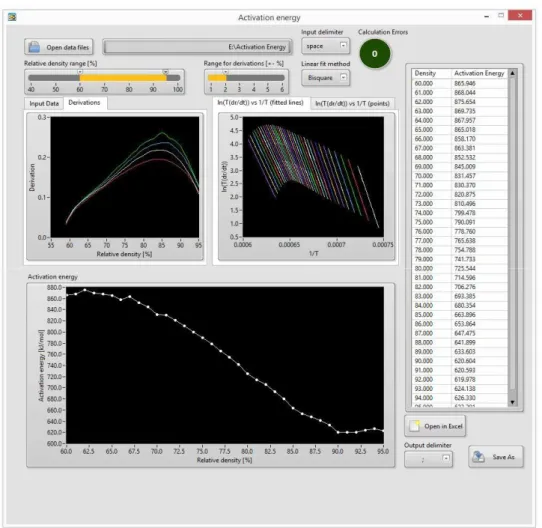
Various parameters of calculation can be changed to suite wide range of input data. The user can define the range of data, from which the first derivation of Eq. 4 is calculated, to obtain the desired smoothness of the curve. Additionally, three linear fitting methods can be selected: least square, least absolute residual and bisquare. All these parameters can be changed at any time and the results are recalculated in the real time. If any errors in the input data are detected, the software automatically notifies the user. The user then can easily select to omit data causing the errors. The calculated results are plotted in real time and can be directly exported to xls or csv file. The screenshot from software interface with calculated results is presented in Fig. 2. The software is freely available via email request to the authors.
2. Experimental
2.1. Materials
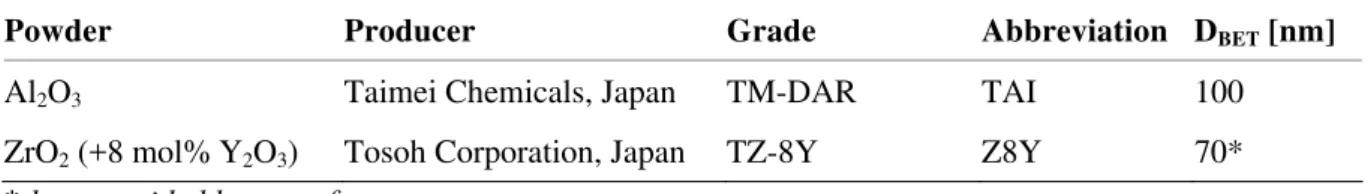
Alumina and cubic zirconia commercial grade ceramic powders were used. Detailed information about these powders are given in Table I. Particle size (DBET) was obtained from
specific surface area using the nitrogen absorption method (BET method, ChemBet 3000, Quantachrome, USA). The theoretical densities (ρth) used for the calculation of the DBET and
calculation of the relative densities are ρth TAI = 3.99 g/cm3 and ρth Z8Y= 5.99 g/cm3.
Tab. I Detailed information about powders used.
Powder Producer Grade Abbreviation DBET [nm]
Al2O3 Taimei Chemicals, Japan TM-DAR TAI 100
ZrO2 (+8 mol% Y2O3) Tosoh Corporation, Japan TZ-8Y Z8Y 70*
*data provided by manufacturer
2.2. Preparation of ceramic green bodies
Powders were shaped into discs of 30 mm in diameter and 5 mm in height by cold isostatic pressing (Autoclave Engineering, Inc., USA). Pressing was done at the pressure of 300 MPa for 5 min. Samples were then pre-sintered at 800 °C/1 h. In order to use the samples in the dilatometer, 4 mm x 4 mm x 15 mm prisms were cut from each sample.
2.3. Sintering
Sintering of the samples was carried out using the high temperature dilatometer (L70/1700, Linseis, Germany). Four different heating rates 2, 5, 10 and 20 °C/min were used to calculate the Qs. The relative shrinkage curves were converted to densification curves by
methodology described in the literature [7, 11]. The parameters of the sintering are presented in the Table 2. After the sintering, relative densities of the samples were measured using the Archimedes method in accordance with the EN623-2.
2.4. Calculation of activation energies of sintering
The calculation of Qs by the Wang and Raj model was realized by software described
3. Results and discussion
3.1. Densification curves
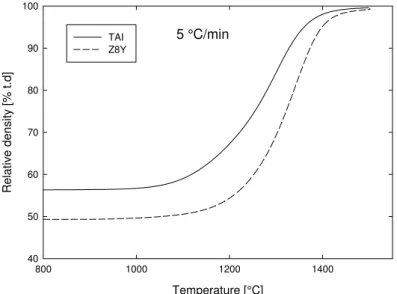
The densification curves, calculated from dilatometry measurements, are presented in Fig. 3. The heating schedules of all samples and their relative densities after sintering are presented in Table II. All samples reached relative density higher than 99.5 % T. D.
5 °C/min
Temperature [°C]
800 1000 1200 1400
R
e
la
ti
v
e
densi
ty [% t.
d]
40 50 60 70 80 90 100
TAI Z8Y
Fig. 3. Densification curves at 5 °C/min.
Tab. II Sintering parameters and final densities of samples. Material Heating rate
[°C/min]
Sintering temp. / dwell [°C/min]
ρrel
[% t.d.]
s / n * [% t.d. / –]
2 1500 / 0 99.67 0.07 / 12
5 1500 / 0 99.63 0.10 / 09
10 1500 / 0 99.59 0.10 / 09
TAI
20 1500 / 0 99.59 0.14 / 12
2 1500 / 0 99.62 0.06 / 09
5 1500 / 0 99.54 0.05 / 09
10 1500 / 10 99.63 0.04 / 09
Z8Y
20 1500 / 60 99.72 0.10 / 09
* where s = standard deviation and n = number of measurements
3.2. The Wang and Raj model
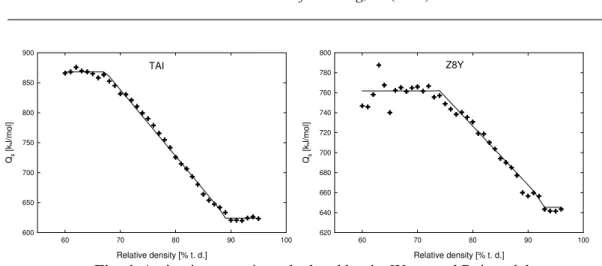
Fig. 4 shows the Qs calculated in accordance with the model of Wang and Raj. Both
materials exhibit the same trend in the linear decrease of Qs during sintering. Such decrease of
Qs was already observed by other authors [10, 12]. Additionally, both TAI and Z8Y show
constant Qs in the high and low density region. This behaviour we already reported for doped
and undoped alumina in our recent studies [13]. The evaluated nominal values of Qs of TAI
P. Vaclav et al. /Science of Sintering, 48 (2016) 317-324
___________________________________________________________________________
322
TAI
Relative density [% t. d.]
60 70 80 90 100
Qs [kJ /m o l] 600 650 700 750 800 850 900 Z8Y
Relative density [% t. d.]
60 70 80 90 100
Qs [kJ /m o l] 620 640 660 680 700 720 740 760 780 800
Fig. 4. Activation energies calculated by the Wang and Raj model.
The summary of Qs values and mean values of low/high density regions are presented
in Table III. Comparison of these results with another approach of calculation, the previously published MSC data [14], as well as data published by other authors [12, 14-17] are included as well.
Tab. III Comparison of results of activation energy calculations by Wang and Raj model with MSC data and other authors.
Material Wang and Raj
[kJ/mol] MSC [kJ/mol] Other authors
60 – 70 % 90 – 95 % 60 – 93 % 93 – 99 %
TAI 868 625 770 570 679/278 [16],
739 [18]
Z8Y 762 645 750 460
233 [19], 460/309 [20], 730/580 [12]
4. Conclusion
Newly developed software for time efficient calculation of Qs by Wang and Raj
model was introduced. Both experimental materials exhibit the same change of Qs during
sintering. The Qs decreases during the sintering by more than 200 kJ/mol in case of alumina
ceramics and more than 100 kJ/mol in case of cubic zirconia ceramics. These results are in agreement with previously published Qs values calculated by both Wang and Raj model and
MSC model.
Acknowledgement
The research has been financially supported by the Ministry of Education, Youth and Sports of the Czech Republic under the project CEITEC 2020 (LQ1601).
5. References
1. German, R. M., Sintering Theory and Practice. 1996: John Wiley and Sons Inc. 2. Mayo, M. J., Processing of nanocrystalline ceramics from ultrafine particles.
3. Akash, A. and M. J. Mayo, Pore growth during initial-stage sintering. Journal of the American Ceramic Society, 1999. 82(11): p. 2948-2952.
4. Kang, S.-J. L., Sintering, Densification, Grain Growth & Microstructure. 2005: Elsevier Butterwoth-Heinemann.
5. Su, H. H. and D. L. Johnson, Master sintering curve: A practical approach to sintering. Journal of the American Ceramic Society, 1996. 79(12): p. 3211-3217. 6. Wang, J. D. and R. Raj, Estimate of the Activation-Energies for Boundary Diffusion
from Rate-Controlled Sintering of Pure Alumina, and Alumina Doped with Zirconia or Titania. Journal of the American Ceramic Society, 1990. 73(5): p. 1172-1175. 7. Pouchly, V. and K. Maca, Master Sintering Curve - A Practical Approach to its
Construction. Science of Sintering, 2010. 42(1): p. 25-32.
8. Young, W. S. and I. B. Cutler, Initial Sintering with Constant Rates of Heating.
Journal of the American Ceramic Society, 1970. 53(12): p. 659-663.
9. Coble, R. L., Sintering Crystalline Solids .1. Intermediate and Final State Diffusion Models. Journal of Applied Physics, 1961. 32(5): p. 787-&.
10. Bernard-Granger, G. and C. Guizard, Apparent activation energy for the densification of a commercially available granulated zirconia powder. Journal of the American Ceramic Society, 2007. 90(4): p. 1246-1250.
11. Maca, K., V. Pouchly, and A. R. Boccaccini, Sintering densification curve - a practical approach for its construction from dilatometric shrinkage data. Science of Sintering, 2008. 40(2): p. 117-122.
12. Song, X. C., et al., Two-Stage Master Sintering Curve Approach to Sintering Kinetics of Undoped and Al(2)O(3)-Doped 8 Mol% Yttria-Stabilized Cubic Zirconia. Journal of the American Ceramic Society, 2011. 94(4): p. 1053-1059.
13. Maca, K., et al., Densification of fine-grained alumina ceramics doped by magnesia, yttria and zirconia evaluated by two different sintering models. Journal of the European Ceramic Society, 2014. 34(16): p. 4363-4372.
14. Pouchly, V., K. Maca, and Z. Shen, Two-stage master sintering curve applied to two-step sintering of oxide ceramics. Journal of the European Ceramic Society, 2013. 33(12): p. 2275-2283.
15. Dahl, P., et al., Densification and properties of zirconia prepared by three different sintering techniques. Ceramics International, 2007. 33(8): p. 1603-1610.
16. Shao, W. Q., et al., Apparent activation energy for densification of alpha-Al(2)O(3) powder at constant heating-rate sintering. Bulletin of Materials Science, 2008. 31(6): p. 903-906.
17. Matsui, K., et al., Sintering kinetics at constant rates of heating: Effect of Al2O3 on the initial sintering stage of fine zirconia powder. Journal of the American Ceramic Society, 2005. 88(12): p. 3346-3352.
18. Fang, T. T., J. T. Shiue, and F. S. Shiau, On the evaluation of the activation energy of sintering. Materials Chemistry and Physics, 2003. 80(1): p. 108-113.
19. Butler, E. P. and J. Drennan, Microstructural Analysis of Sintered High-Conductivity Zirconia with Al2o3 Additions. Journal of the American Ceramic Society, 1982. 65(10): p. 474-478.
20. Taylor, M. A., et al., Zr-96 diffusion in polycrystalline scandia stabilized zirconia.
Journal of the European Ceramic Society, 2005. 25(9): p. 1591-1595.
Са р а:
В џ . А
,
P. Vaclav et al. /Science of Sintering, 48 (2016) 317-324
___________________________________________________________________________
324
.
У ( 60 % 100 %
), . У :
868 kJ/mol 762 kJ/mol , ;
625
kJ/mol 645 kJ/mol , .
К учн р чи: , , ,
© 2016 Authors. Published by the International Institute for the Science of Sintering. This article is an open access article distributed under the terms and conditions of the Creative Commons — Attribution 4.0 International license