ACPD
3, 3991–4036, 2003Isotope composition of middle atmospheric H2O
Ch. Bechtel and A. Zahn
Title Page
Abstract Introduction
Conclusions References
Tables Figures
◭ ◮
◭ ◮
Back Close
Full Screen / Esc
Print Version
Interactive Discussion
©EGU 2003
Atmos. Chem. Phys. Discuss., 3, 3991–4036, 2003 www.atmos-chem-phys.org/acpd/3/3991/
© European Geosciences Union 2003
Atmospheric Chemistry and Physics Discussions
The isotope composition of water vapour:
A powerful tool to study transport and
chemistry of middle atmospheric water
vapour
Ch. Bechtel1and A. Zahn2 1
Institut f ¨ur Umweltphysik, University of Heidelberg, Heidelberg, Germany
2
Institute of Meteorology and Climate Research, Forschungszentrum Karlsruhe, Germany Received: 11 June 2003 – Accepted: 16 July 2003 – Published: 28 July 2003
ACPD
3, 3991–4036, 2003Isotope composition of middle atmospheric H2O
Ch. Bechtel and A. Zahn
Title Page
Abstract Introduction
Conclusions References
Tables Figures
◭ ◮
◭ ◮
Back Close
Full Screen / Esc
Print Version
Interactive Discussion
©EGU 2003
Abstract
A one-dimensional chemistry model is applied to study the stable hydrogen (D) and stable oxygen isotope (17O, 18O) composition of water vapour in stratosphere and mesosphere. The stable isotope ratios of tropospheric H2O are determined by “phys-ical” fractionation effects, i.e. phase changes, diffusion processes, and mixing of air
5
masses. Due to these processes water vapour entering the stratosphere (i) is mass-dependently fractionated (MDF), i.e. shifts in the isotope ratio17O/16O are∼0.52 times
of those of18O/16O and (ii) shows isotope shifts in D/H, which are∼5 times of those
in18O/16O. In stratosphere and mesosphere “chemical” fractionation, that are the ox-idation of methane, re-cycling of H2O via the HOx family, and isotope exchange
re-10
actions are shown to considerably enhance the isotope ratios in the imported tropo-spheric H2O. Enrichments relative to the isotope ratios at the tropopause are used to
derive the partitioning of tropospheric (unmodified), re-cycled and in situ generated H2O. The model reasonably predicts overall increases of the stable isotope ratios in H2O by ∼23% for D/H,∼8.5% for
17
O/16O, and ∼14% for 18O/16O. The17O/16O and
15
18
O/16O ratios in H2O are shown to be a measure of the partitioning of HOx that
re-ceives its O atom either from the reservoirs O2or O3. In the entire middle atmosphere,
MDF O2is the major donator of oxygen atoms incorporated in OH and HO2and thus in H2O. It is demonstrated that in the stratosphere mass-independent fractionation (MIF)
in O3in a first step is transferred to the NOxfamily and only in a second step to HOxand
20
H2O. In contrast to CO2, O( 1
D) only plays a minor role in this MIF transfer. The major uncertainty in our calculation arises from the many badly quantified isotope exchange reactions and kinetic isotope fractionation factors.
1. Introduction
Water vapour (H2O) belongs to the most important trace gases in the Earth’s
atmo-25
ACPD
3, 3991–4036, 2003Isotope composition of middle atmospheric H2O
Ch. Bechtel and A. Zahn
Title Page
Abstract Introduction
Conclusions References
Tables Figures
◭ ◮
◭ ◮
Back Close
Full Screen / Esc
Print Version
Interactive Discussion
©EGU 2003
reactions (Lelieveld and Crutzen, 1990, 1994) and in the short-wave and long-wave radiative budget of the atmosphere (IPCC, 2001). Its extremely complex atmospheric cycle is not understood in sufficient detail, particularly as atmospheric H2O is present in
the gaseous, fluid, and solid phase. Interest in middle atmospheric H2O was addition-ally increased by observations made by Oltmans and Hofmann (1995) and after this by
5
others (SPARC, 2000, and references therein, Rosenlof et al., 2001) who have found increasing H2O concentrations of 30-150 nmol/mol yr−1in the middle atmosphere since 1954. Not only the cause of this trend but also its consequences on the Earth’s climate and the chemistry of the middle atmosphere is a matter of vital discussion (Forster and Shine, 1999, 2002; Kirk-Davidoffet al., 1999).
10
Mostly, H2O concentration measurements, supported by atmospheric circulation
models, are used to place constraints on the H2O cycle in the middle atmosphere
(Dessler et al., 1995; Rosenlof et al., 1997; Randel et al., 2001). A new dimension allows for the analysis of the isotopic composition of water vapour.
Abundances of stable isotopes in water vapour are usually reported as per mil
de-15
viation of the ‘rare isotope’ to the ‘most abundant isotope’ ratio, relative to the Vienna Standard Mean Ocean Water (V-SMOW) reference. Forδ18O, e.g., thisδ notation is δ18O(H2O)=(R18O,sample/R18O,V−SMOW−1)·1000
◦
/◦◦, where R18O denotes the isotope
ratio18O/16O of a sample or V-SMOW, respectively. RD,V−SMOWis 0.31152·10
−3
(Hage-mann et al., 1970; DeWit et al., 1980; Tse et al., 1980), R17O,V−SMOW is 0.3799·10
−3
20
(Li et al., 1988) , and R18O,V−SMOWis 2.0052·10
−3
(Baertschi, 1976). AllδD,δ17O, and δ18O values in this paper are given with respect to V-SMOW.
The major source of atmospheric water vapour is the ocean having the isotope com-position of V-SMOW, i.e., δ18O(H2O) ≈0
◦
/◦◦. Evaporation into the atmosphere leads
to depletion in the rare H2O isotopologues, due to their lower vapour pressure
com-25
pared to the most abundant H216O, the vapour pressure isotope effect (v.p.i.e.). Typi-cally,δ18O(H2O) is –12◦/◦◦ andδD(H2O) is –85
◦
/◦◦ just above the ocean (Rozanski et
ACPD
3, 3991–4036, 2003Isotope composition of middle atmospheric H2O
Ch. Bechtel and A. Zahn
Title Page
Abstract Introduction
Conclusions References
Tables Figures
◭ ◮
◭ ◮
Back Close
Full Screen / Esc
Print Version
Interactive Discussion
©EGU 2003
the v.p.i.e. preferential condensation and subsequent removal of the isotopically sub-stituted H2O isotopologues by precipitation. The D/H,17O/16O, and 18O/16O isotope ratios in H2O thus decrease with altitude and reach tropopause values in the range of
δD(H2O)≈–(450-750)
◦
/◦◦,δ
17
O(H2O)≈–(30-70)
◦
/◦◦, and δ
18
O(H2O)≈–(60-130)
◦
/◦◦,
respectively (see Sect.2). This isotopically depleted water vapour is imported into the
5
stratospheric overworld, almost exclusively within the tropics (Holton et al., 1995; High-wood and Hoskins, 1999). As a result of negligible cloud formation and subsequent precipitation or sedimentation, transport within the middle atmosphere virtually does not change this tropopause isotope signature.
In contrast to the troposphere, chemical reactions determine the isotope composition
10
of H2O in the middle atmosphere such as: (i) methane (CH4) oxidation, the main in situ source of H2O in the stratosphere, (ii) exchange of oxygen atoms with molecular
oxygen and ozone via the HOxand NOxfamily, (iii) oxygen isotope exchange reactions
e.g. between H2O and OH (Greenblatt and Howard, 1988; Masgrau et al., 1999), and (iv) locally restricted, injection of H2O by aircraft. All of these processes isotopically
15
enrich the water vapour imported from the troposphere.
Using a one-dimensional (1-D) model it is shown, how these chemical reactions modify the stable isotope composition of middle atmospheric H2O on the one hand, and
vice versa, how H2O isotope observations can be exploited to infer constraints on these
reactions. Three previous model studies on the isotopic composition of stratospheric
20
H2O have been made. Kaye (1990) studiedδ18O(H2O) in the middle atmosphere and suggested a remarkable increase in the δ18O(H2O) mixing ratio with altitude due to 18
O - rich excess water from the CH4 oxidation. Ridal et al. (2001) and Ridal (2002)
focused on δD(H2O) in the stratosphere. They found a strong vertical increase of δD(H2O), also due to CH4oxidation which is additionally modulated by the seasonally
25
varying H2O input from the troposphere (“tape recorder effect”).
Here, all three stable isotopologues δD(H2O), δ 17
O(H2O), and δ 18
O(H2O) both in
ACPD
3, 3991–4036, 2003Isotope composition of middle atmospheric H2O
Ch. Bechtel and A. Zahn
Title Page
Abstract Introduction
Conclusions References
Tables Figures
◭ ◮
◭ ◮
Back Close
Full Screen / Esc
Print Version
Interactive Discussion
©EGU 2003
end product H2O.
2. Available stable isotope fata of H2O
In view of the difficulties of the measurement techniques listed below, only a few H2O
isotope observations have been conducted so far:
(i)Remote-sensing observations by infrared spectroscopy techniques (Abbas et al.,
5
1987; Carli and Park, 1988; Guo et al., 1989; Dinelli et al., 1991, 1997; Rinsland et al., 1984, 1991; Stowasser et al., 1999; Johnson et al., 2001; Kuang et al., 2003). They reveal strong depletions ofδD(H2O) with respect to V-SMOW which significantly
de-crease with altitude, from an average of –(660±80)◦/◦◦ at the low-latitude tropopause
(Moyer et al., 1996; Johnson et al., 2001) to typically –(450±70)◦/◦◦ at 40 km.
Ob-10
servations by Stowasser et al. (1999) indicate extremeδD(H2O) depletions as low as
–830◦/◦◦ at 17 km inside the Arctic vortex, which was attributed to condensation and
subsequent sedimentation of polar stratospheric cloud (PSC) particles. For δ17O(H2O) and δ
18
O(H2O), most observations indicate values of about 0 to –
100◦/◦◦and a weak, but insignificant vertical increase. This insignificance can primarily 15
be assigned to the large measurement uncertainties of 50-120◦/◦◦. Deviations from this
behavior were noticed during early observations by Guo et al. (1989) who retrieved increasingδ18O(H2O) values from (80±140)
◦
/◦◦ at 22 km altitude to (400±250) ◦
/◦◦ at
37 km. Using a balloon-borne spectrometer, Johnson et al. (2001) obtained low isotope ratios of –(300-30)◦/◦◦(on the average, –128
◦
/◦◦) forδ
18
O(H2O), and of –(400-0)◦/◦◦ (on 20
the average, –84◦/◦◦) forδ
17
O(H2O) at 12-20 km altitude.
(ii)Cryogenic in situ sampling and subsequent laboratory-based mass spectrometry (MS) analysis. Apart from observations in the upper troposphere and tropopause re-gion by Ehhalt (1974), Smith (1992), Zahn et al. (1998), and Zahn (2001), there is only one set of balloon-borne stratospheric δD(H2O) profiles (Pollock et al., 1980). They
25
show a continuous increase inδD(H2O) with altitude, from about –450◦/◦◦ at 25 km to
ACPD
3, 3991–4036, 2003Isotope composition of middle atmospheric H2O
Ch. Bechtel and A. Zahn
Title Page
Abstract Introduction
Conclusions References
Tables Figures
◭ ◮
◭ ◮
Back Close
Full Screen / Esc
Print Version
Interactive Discussion
©EGU 2003
been measured by this technique, which is mainly due to the small sample amounts available and their difficult handling and MS analysis.
(iii)In situ measurements by tunable diode laser absorption spectroscopy (TDLAS). This new and challenging technique was recently presented by C. Webster (2003). He reported measurement uncertainties of 30-50◦/◦◦ for all stable isotope ratios D/H, 5
17
O/16O, and18O/16O in H2O in the UTLS region using the ALIAS instrument onboard the NASA WB57 aircraft.
3. Information provided by the H2O isotopic composition
The isotopic composition of tropospheric water vapour is controlled by the hydrological cycle. Hence, H2O isotope data can be used as tracers for the condensation history of
10
probed air masses (Taylor, 1984), as applied for studying the transport of tropospheric H2O into the lowermost stratosphere (Zahn, 2001).
Both, δD(H2O) and δ 18
O(H2O) are primarily controlled by the v.p.i.e. and thus
un-dergo similar variations. Indeed, in surface precipitation both isotopologues are related closely by the meteoric water line (MWL):δD(H2O) ≈m × δ18O(H2O) +10◦/◦◦, with
15
m = 8 (Craig, 1961). This relationship was found to be valid even on Mount Logan
(Canada) at 5951 m altitude, with m = 7.5 (Holdsworth et al., 1991). At cold tem-peratures as encountered in the tropical tropopause layer (TTL), however, kinetically limited isotope fractionation during formation of ice cloud particles, their lofting in con-vective cells and mixing of air masses showing different H2O isotope compositions are
20
assumed to considerably reduce δD(H2O) depletion compared toδ18O(H2O) (Moyer et al., 1996; Keith, 2000; Johnson et al., 2001; Kuang et al., 2003). In fact, using the isotope composition of water vapour entering the stratosphere ofδD(H2O)=–679
◦
/◦◦
andδ18O(H2O)=–128
◦
/◦◦measured by Johnson et al. (2001), a slopemof 5.4 is
cal-culated. Finally and importantly,δ17O(H2O) will provide exactly the same information
25
ACPD
3, 3991–4036, 2003Isotope composition of middle atmospheric H2O
Ch. Bechtel and A. Zahn
Title Page
Abstract Introduction
Conclusions References
Tables Figures
◭ ◮
◭ ◮
Back Close
Full Screen / Esc
Print Version
Interactive Discussion
©EGU 2003
the troposphere, that is∆17O(H2O)=δ 17
O(H2O) – 0.52δ 18
O(H2O) will be 0
◦
/◦◦at the
tropical tropopause.
In conclusion, it can be presumed that tropospheric water vapour entering the strato-sphere at the tropical tropopause exhibits a δD(H2O)/δ
18
O(H2O) ratio of 5-6 and is
mass-dependently fractionated (MDF).
5
Chemical reactions in the middle atmosphere will strongly modify this isotope signa-ture imported from the troposphere, as will be pointed out briefly below and explained in more detail later:
(i) Methane is oxidized in the middle atmosphere by reactions with OH, Cl, and O(1D), and by photolysis (Lary and Toumi, 1997). Each oxidized CH4 molecule leads to the
10
net formation of almost two H2O molecules (Evans et al., 1999; Z ¨oger et al., 1999;
Michelsen et al., 2000). The δD value of the new H2O molecule, i.e. δD(H2O), dif-fers from δD(CH4), because the CH4 loss reactions are accompanied by an
unusu-ally strong kinetic isotope fractionation. For instance, at room temperature the D iso-tope fractionation factor KIED, that is the ratio of the rate constants k(CH4)/k(CH3D), is
15
KIED(OH)=1.29 for the reaction of CH4with OH, KIE D
(Cl)=1.51 for the reaction with Cl, and KIED(O(1D) =1.11 for the reaction with with O(1D) (Saueressig et al., 1996, 2001; Tyler et al., 2000). Since these KIEs differ considerably, theδD(H2O) distribution in the middle atmosphere is expected to mirror the partitioning of the different CH4
oxi-dation reactions. This information cannot be inferred from simultaneous CH4and H2O
20
concentration measurements.
(ii) Re-cycling of oxygen atoms between H2O and the oxygen reservoir gases O2
and O3 via HOx and NOx species and oxygen isotope exchange reactions. Besides
net H2O formation due to CH4 oxidation, continuous loss of H2O and reformation of H2O lead to an extensive turnover of oxygen atoms between oxygen containing trace
25
gases. This process recycles∼4 times more H2O molecules than the net production
ACPD
3, 3991–4036, 2003Isotope composition of middle atmospheric H2O
Ch. Bechtel and A. Zahn
Title Page
Abstract Introduction
Conclusions References
Tables Figures
◭ ◮
◭ ◮
Back Close
Full Screen / Esc
Print Version
Interactive Discussion
©EGU 2003
stratospheric H2O is strongly amplified compared to the MIF signal originating from CH4oxidation alone.
A crucial and exciting point is that more than 99% of all oxygen atoms taken to form H2O in the middle atmosphere stem from the hydroxyl radical OH. Hence,δ17O(H2O) and δ18O(H2O) data also provide information on the oxygen isotope composition of
5
OH, and by considering∆17O(H2O) on the affection of MIF enriched O3to OHxand via
OHxto many other oxygen containing trace gases in the middle atmosphere. This MIF
transfer from O3to oxygen - containing radicals was studied by Lyons (2001).
4. Model description
The 1-D model encompasses 64 boxes from 16 to 80 km, each 1 km high. Temperature
10
and pressure profiles are set according to the U.S. Standard Atmosphere (1976). Verti-cal transport is parameterised by eddy diffusion coefficients Kz, below 29 km using the
“National Academy of Science (1976)” profile , from 29 km to 50 km using the “Hunten” profile, both depicted by Massie and Hunten (1981), and above 50 km employing the profile given by Froidevaux and Yung (1982).
15
4.1. Peculiarities in modelling isotope ratios
The concept of chemical families frequently applied in atmospheric chemistry models mostly fails if isotopologues are considered. For instance, the reaction chain of CO+
OH → CO2 +H followed by H+O2 +M → HO2 +M converts OH in HO2, which
conserves the sum of HOx =OH+HO2. The oxygen atom of the initial OH, however,
20
is incorporated in CO2 and thus leaves the HOx family. A new OH bond is formed,
which has the oxygen isotope composition of O2.
Isotope exchange reactions such as the fast O exchange between O2 and O(
3
P) (Kaye and Strobel, 1983) also have to be considered. They modify isotope ratios but not the concentration of the participating species.
ACPD
3, 3991–4036, 2003Isotope composition of middle atmospheric H2O
Ch. Bechtel and A. Zahn
Title Page
Abstract Introduction
Conclusions References
Tables Figures
◭ ◮
◭ ◮
Back Close
Full Screen / Esc
Print Version
Interactive Discussion
©EGU 2003
Finally, when including isotopologues that contain two or more of the isotopes of interest such as O3or HO2, the individual isotopologues have to be considered sepa-rately, e.g. the OQO and OOQ or HQO and HOQ (with Q the rare isotope).
4.2. Trace gas chemistry
Due to negligible cloud formation in the middle atmosphere, our model is restricted to
5
gas phase chemistry. Initially, all reactions involved in significant H2O chemistry and isotope exchange with other gases were assessed carefully for all altitudes considered by the model. The reactions finally used (Tables1and2) always account for more than 95% of the local chemical turnover of H2O and its isotopes at a given altitude.
Water vapour is formed due to H-abstraction by OH, i.e. XHi+OH→XHi−1+H2O,
10
where XHiis CH4(reaction R1), CH2O (R7), HO2(R15), HCl (R20), H2(R25), or HNO3
(R28). The major sinks of middle atmospheric H2O are the reaction with O( 1
D) (R29) and photolysis at wavelength below 200 nm (R30).
Furthermore, all reactions that are necessary to maintain the overall budget of O- and H-atoms balanced are included. To this end a complete methane destruction scheme
15
(LeTexier et al., 1988) is applied which is initialised by photolysis and the reaction of CH4with OH, O(
1
D), Cl. All relevant reactions of the OHx-family (Burnett and Burnett,
1995) are also considered.
The concentrations and the isotopic compositions of H2O, OH, HO2, H, H2, CH4,
CH3, CH2O, HCO, HNO3, and HCl are explicitly calculated by the model.
20
4.3. Isotope chemistry
Integration of isotopologues renders the model complex, as shown for the initial steps of the major methane destruction reactions (Table3).
Only for a few of the reactions listed in Table1is the isotope fractionation factor KIE
=k/k′known, withkthe rate constant and the slash marks the isotopically substituted
25
ACPD
3, 3991–4036, 2003Isotope composition of middle atmospheric H2O
Ch. Bechtel and A. Zahn
Title Page
Abstract Introduction
Conclusions References
Tables Figures
◭ ◮
◭ ◮
Back Close
Full Screen / Esc
Print Version
Interactive Discussion
©EGU 2003
model.
For all other reactions KIE is set to (µ′/µ)1/2, withµthe reduced mass of the reac-tants. This accounts for the fact that the rate constant of a certain reaction does not only depend on the reactivity of the reactants, but also on their collision frequency.
Additionally, the oxygen exchange reactions listed in Table4were included, partially
5
for deriving the necessary isotope parameter profiles.
4.4. Trace gas parameter profiles
Fixed, globally, seasonally and diurnally averaged profiles are used for the following trace gases: O3, O(1D), NO, NO2, and Cl as retrieved by the 2-D model version of ECHAM 3 (C. Br ¨uhl, Max-Planck-Institute for Chemistry, Mainz), a mean O(3P) profile
10
measured by CHRISTA onboard the Space Shuttle in November 1994 (with the cour-tesy of M. Kaufmann, University of Wuppertal), and CO measured by ISAMS onboard the UARS satellite (L ´opez-Valverde et al., 1996).
4.5. Isotope parameter profiles of O(3P), O3, O(1D), and NO
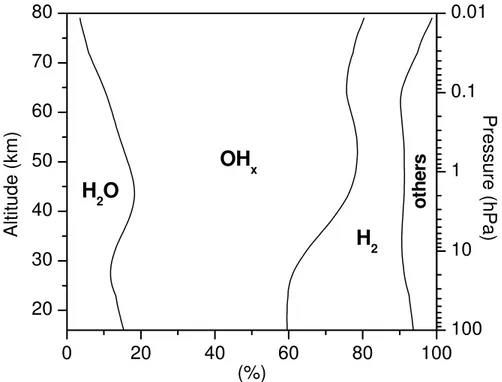
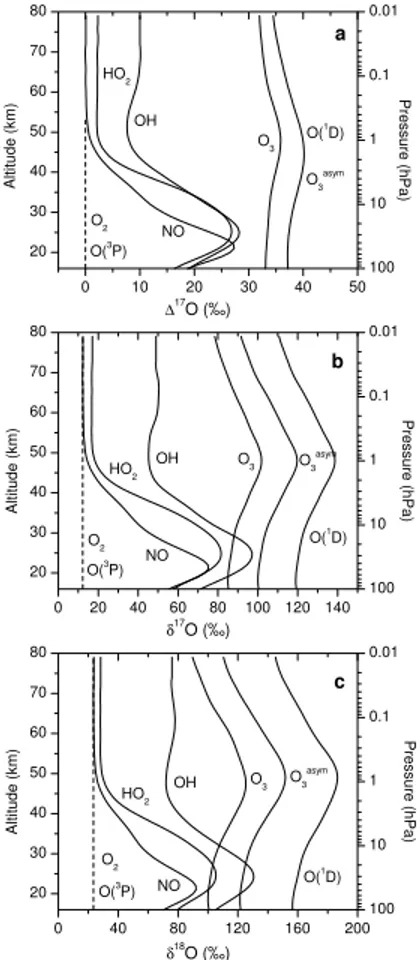
The oxygen isotope compositions assumed for O2, O(3P), O3, and O(1D) are indicated
15
in Fig.1together with the calculated profiles for NO, OH, and HO2.
The isotope composition of O(3P) is set to the one of O2, i.e., δ 17
O(O2) = 11.8
◦
/◦◦
andδ18O(O2)=23.8
◦
/◦◦(Luz et al., 1999; Coplen et al., 2002), because of the rapid O
exchange between O(3P) and O2(Kaye and Strobel, 1983).
The isotope composition of O3was set to be solely dependent on temperature, as it
20
was found recently that all reliable atmospheric data apparently agree with the enrich-ments determined in laboratory studies (Mauersbeger et al., 2001) and that pressure dependence is negligible below 100 hPa. The (consistent) laboratory data by Thiemens and Jackson (1988, 1990), Morton et al. (1990), and (G ¨unther et al., 1999) are imple-mented under the assumption that 80% of the isotope enrichment of O3 is carried by
ACPD
3, 3991–4036, 2003Isotope composition of middle atmospheric H2O
Ch. Bechtel and A. Zahn
Title Page
Abstract Introduction
Conclusions References
Tables Figures
◭ ◮
◭ ◮
Back Close
Full Screen / Esc
Print Version
Interactive Discussion
©EGU 2003
the asymmetric QOO (Anderson et al., 1989; Janssen et al., 1999; Mauersberger et al., 1999).
Q(1D) is derived from the isotope enrichment in O3under the following assumptions:
(i) 80% of the isotope enrichment in O3 is located in the asymmetric OOQ, (ii) during the photolysis of O3 only the outer oxygen atoms form O(
1
D), (iii) there is negligible
5
fractionation during the photolysis of O3 (Wen and Thiemens, 1993), and (iv)
mass-dependent collision rates during subsequent quenching of O(1D) on N2and O2 to the ground state O(3P) lead to an additional isotope enrichment of 19◦/◦◦forδ
17
O and 36◦/◦◦
forδ18O in O(1D) (calculated by using the formula given in Sect.4.3).
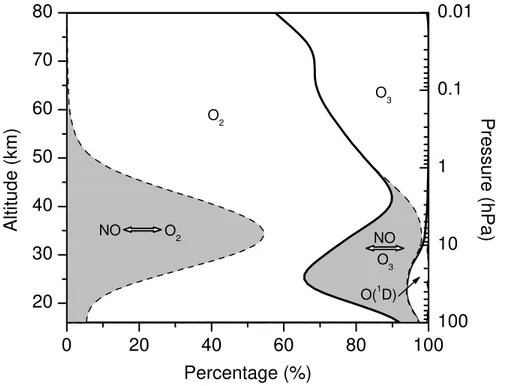
The oxygen isotope composition of middle atmospheric NOx is not controlled by its
10
main source, i.e. oxidation of N2O by O(1D), but by O exchange between Oxand NOx:
NO+O3→NO2+O2 (NO-1)
NO2+O(3P)→NO+O2 (NO-2)
and the fast O - exchange reactions:
NO+Q(3P)↔NQ+O(3P) (NO-3)
15
NO+QH↔NQ+OH (NO-4)
Indeed, over the entire altitude range considered less than 0.5% of all O atoms in NO stem from the oxidation of N2O by O(
1
D). Hence, the isotopic composition of N2O
that is known to carry MIF into the stratosphere (Cliffand Thiemens, 1997; Cliffet al., 1999; R ¨ockmann et al., 2001; Kaiser et al., 2002) does not have to be considered. The
20
O isotope (δ17O, δ18O) parameter profile of NO is derived by calculating the source partitioning of the reactions NO-1 to NO-4. The inferred enrichments exceed the ones calculated by Lyons (2001) by almost a factor of two, as outlined in Sect.6.4. Because of the dominance of NO-3, the oxygen isotopic composition of NO in the mesosphere is very similar to the one of O(3P).
ACPD
3, 3991–4036, 2003Isotope composition of middle atmospheric H2O
Ch. Bechtel and A. Zahn
Title Page
Abstract Introduction
Conclusions References
Tables Figures
◭ ◮
◭ ◮
Back Close
Full Screen / Esc
Print Version
Interactive Discussion
©EGU 2003
4.6. Boundary conditions
At the lower model boundary, i.e., the tropopause (16 km), fixed trace gas and iso-tope mixing ratios are set as follows: [H2O]=3.48µmol/mol. δD(H2O)=–660
◦
/◦◦ and
δ18O(H2O)=–128◦/◦◦ (Moyer et al., 1996; Johnson et al., 2001). ∆
17
O(H2O) is set to 0◦/◦◦ (as no process is known in the troposphere, which could cause MIF in H2O),
5
so that δ17O(H2O) is –66
◦
/◦◦ (this value agrees with –(84±31) ◦
/◦◦ observed by
John-son et al. (2001)). [CH4]=1.7µmol/mol. δD(CH4)=–86
◦
/◦◦ (Quay et al., 1999).
[H2]=0.55µmol/mol (Z ¨oger et al., 1999). δD(H2)=120◦/◦◦ (Friedman and Scholz,
1974). The flux of all considered species across the upper boundary (80 km) is set to zero.
10
5. Model results and comparison with observations
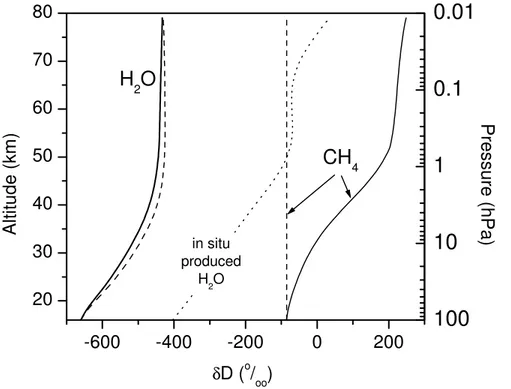
5.1. Vertical profile ofδD(H2O)
The calculatedδD(H2O) profile compares well with observations and the model results obtained by Ridal (2002) (Fig.2). Apart from the Arctic profile retrieved by (Stowasser et al., 1999), the available observations (Sect.2) show a vertical increase by ∼
(150-15
200)◦/◦◦between 20 and 40 km, but partially differ in absolute concentration. Consider
however the large measurement uncertainty of all infrared instruments of±(60-150)◦/◦◦.
TheδD(H2O) profiles obtained by balloon-borne in situ H2O sampling and subsequent
laboratory analysis by Pollock et al. (1980) (reported uncertainties:∼50◦/◦◦) reveal
sig-nificantly higher values compared to the other measurements and the model.
20
As mentioned in Sect. 3, the strong vertical δD(H2O) increase in the stratosphere
is due to the increasing fraction of H2O that originates from the oxidation of CH4. TheδD(H2O) value in the mesosphere, which is higher than the tropopause value by ∼250◦/◦◦, indicate that ∼60% of the mesospheric H2O originate from the troposphere
and∼40% stem from the oxidation of CH4(see Sect.6.2).
ACPD
3, 3991–4036, 2003Isotope composition of middle atmospheric H2O
Ch. Bechtel and A. Zahn
Title Page
Abstract Introduction
Conclusions References
Tables Figures
◭ ◮
◭ ◮
Back Close
Full Screen / Esc
Print Version
Interactive Discussion
©EGU 2003
5.2. Vertical Profiles ofδ17O(H2O) andδ 18
O(H2O)
The O isotope ratios in H2O (Fig. 3) exhibit a vertical profile that is similar to that of δD(H2O). The reason is oxygen exchange between O2 and O3 via HOx- and NOx
-species rather than the net formation of H2O as a final product of CH4oxidation than
(see Sect.6.3).
5
The measurements by Dinelli et al. (1991), Guo et al. (1989), Rinsland et al. (1991), and Johnson et al. (2001) are in reasonable agreement with our model results. How-ever the large measurement errors of ±(50-120)◦/◦◦ have to be noted, which
com-pares with the calculated total vertical increase by 85◦/◦◦ for δ
17
O(H2O) and 140
◦
/◦◦
forδ18O(H2O).
10
6. Discussion
6.1. The middle atmospheric water vapour budget
Figure 4shows the inferred budgets of H2O, δD(H2O) andδ18O(H2O) of the middle atmosphere. The annual flux of tropospheric water into the stratosphere is set to 788 Mt as given by (Yang and Tung, 1996). In the stratosphere further net production of 50.3 Mt
15
of H2O (and of 0.4 Mt of H2) takes place due to the oxidation of CH4 with a calculated net CH4destruction rate of 24 Mt yr−1. This is slightly lower than the (40±10) Mt yr−1
mostly reported (Crutzen, 1995; Lelieveld et al., 1998), but agrees with Gettelmann et al. (1998) and exceeds earlier values given by Crutzen (1991) and Khalil et al. (1993). The calculated ratios between H2O and H2 production and CH4 loss for the
20
entire middle atmosphere are:
P(H2O)
L(CH4) =1.87 and
P(H2)
ACPD
3, 3991–4036, 2003Isotope composition of middle atmospheric H2O
Ch. Bechtel and A. Zahn
Title Page
Abstract Introduction
Conclusions References
Tables Figures
◭ ◮
◭ ◮
Back Close
Full Screen / Esc
Print Version
Interactive Discussion
©EGU 2003
Using a coupled chemistry/dynamical model (LeTexier et al., 1988) derived P(H2O)/L(CH4) = 1.6 which is in agreement with satellite observations by Hanson
and Robinson (1989). More recent in situ measurements indicated higher values of 1.94±0.27 (Dessler et al., 1994), 1.82±0.21 (Engel et al., 1996), 1.973±0.003 (Hurst
et al., 1999), and 1.975±0.030 (Z ¨oger et al., 1999), which are in reasonable agreement
5
with our model results.
Interestingly, although each CH4 molecule finally results in the formation of almost 2 H2O molecules (Eq. 1), most hydrogen atoms in CH4 make the detour via H2, the
HOxfamily, and other gases to H2O, as demonstrated in Fig.5. Only∼15% of all H2O
molecules are formed directly from one of the four H atoms of CH4 or intermediate
10
products in the CH4 destruction chain (such as formaldehyde, CH2O), i.e., they are produced via the following reactions:
CH4+OH→CH3+H2O (R1)
CH2O+OH→HCO+H2O (R7)
This can be explained by the fact that only∼30% of all CH4molecules react with OH,
15
and the majority of∼70% with O(1D) or Cl (Lary and Toumi, 1997), which is in strong
contrast to the troposphere where the reaction with OH clearly dominates. The other
∼85% of the H atoms in CH4 are incorporated first in the HOx family (∼60%), in H2
(∼18%), and other gases such as HCl (∼7%), before they end up in H2O. This detour
of the H atoms from CH4to H2O certainly affects not only the isotope composition of
20
the final product H2O, but also that of the intermediate products (OH, HO2, HCO, H, H2, HCl etc.).
Figure 6 presents the vertical profile of H2O production P(H2O) and loss L(H2O).
Both P(H2O) (dominated by the reaction OH+HO2 → H2O+O2 (Kaye, 1990)) and
L(H2O) (more than 99% of which are due to the reaction of H2O+O( 1
D)→2 OH) peak
25
at∼38 km altitude. The net rate, P(H2O) – L(H2O), amounts to∼25% of P(H2O) only. It
ACPD
3, 3991–4036, 2003Isotope composition of middle atmospheric H2O
Ch. Bechtel and A. Zahn
Title Page
Abstract Introduction
Conclusions References
Tables Figures
◭ ◮
◭ ◮
Back Close
Full Screen / Esc
Print Version
Interactive Discussion
©EGU 2003
CH4loss rate (for better comparison 2×L(CH4) is shown, dotted line). This again
em-phasises that (i) most H atoms from CH4are first incorporated in intermediate species
(that experience spatial redistribution) before ending up in H2O, and (ii) a
consider-able turnover of H2O molecules occurs in the middle atmosphere which significantly exceeds the net production of H2O.
5
Division of the local H2O concentration by the local H2O loss rate L(H2O) yields the
chemical lifetime of H2O, τ(H2O), at a certain altitude (Fig. 6b). In the entire middle atmosphere τ(H2O) considerably exceeds the vertical transport time scale, i.e. H2O
never is in photochemical equilibrium. Only between 30 and 50 km altitude, the trans-port lifetimeH2/Kz (H being the local scale height and Kz the vertical eddy diffusion
10
coefficient) almost compare with the photochemical lifetime of H2O, in agreement with (LeTexier et al., 1988).
This long chemical lifetime of H2O implies that below 30-35 km (where τ(H2O)
ex-ceeds∼5 years) the D/H isotope ratio of H2O is simply due to the mixing of theδD(H2O)
isotope signature imported from the troposphere and the one present in the upper
15
stratosphere. This finding does not apply toδ17O(H2O) and δ 18
O(H2O), because of
the considerable oxygen exchange of H2O with other gases, which also occurs in the lower stratosphere.
6.2. δD(H2O) as tracer for CH4oxidation
Tropospheric H2O is imported into the stratosphere with δD(H2O) ≈ –660
◦
/◦◦ (Moyer 20
et al., 1996, Johnson et al., 2001). Tropospheric CH4 carries much higher δD values of roughly –86◦/◦◦ (Quay et al., 1999) into the stratosphere. Neglecting the small net
formation of H2due to CH4oxidation (∼0.4 Mt yr
−1
ACPD
3, 3991–4036, 2003Isotope composition of middle atmospheric H2O
Ch. Bechtel and A. Zahn
Title Page Abstract Introduction Conclusions References Tables Figures ◭ ◮ ◭ ◮ Back Close
Full Screen / Esc
Print Version
Interactive Discussion
©EGU 2003
forδD yields an averageδD(H2O) value in the middle atmosphereδD0of:
δD0
838 z}|{
M0
| {z } mean
=
−660◦/◦◦ z}|{
δDt
788 z}|{
Mt
| {z }
import from troposphere
+
−86◦/◦◦ z }| {
δDm
50 z}|{
Mm
| {z }
production from CH4oxidation
(2)
where Mi denotes the H2O mass fluxes of the different components and δDi their D
isotope signature. The numbers are given in per mil forδDiand in Mt yr−1 for Mi, as shown in Fig.4a and b. Equation (2) gives an average middle atmospheric δD(H2O)
5
value of δD0 = –626
◦
/◦◦, which exceeds the value at the tropopause by 34 ◦
/◦◦ only.
This small isotope excess reflects the fact that net H2O production from CH4oxidation (∼50 Mt yr−1) is small compared to the H2O inflow from the troposphere (∼788 Mt yr−1).
The vertically increasing contribution of H2O produced by the oxidation of CH4 is
described by the upperx axis of Fig. 2. It shows the local fraction of H2O from CH4
10
oxidationF, that is the ratio between the difference of the localδD(H2O) value to the
tropopause value (–660◦/◦◦) and the difference of theδD(H2O) from the CH4oxidation
(set to –86◦/◦◦) and theδD(H2O) tropopause value, i.e.,F =(δD(H2O) – (–660
◦
/◦◦)) / (–
86◦/◦◦ – (–660 ◦
/◦◦)). Figure 2 indicates that ∼40% of the H2O above 40 km originate
from the oxidation of CH4.
15
It might be argued that this estimation is not correct, since the high kinetic isotope fraction factors KIEs of the CH4oxidation reactions (Sect.3) result in a strong vertical change of the δD value of freshly produced H2O. Although this comment is correct,
influence onδD(H2O) is weak, as demonstrated by Fig.7. Because of the large KIEs,
δD(CH4) increases from –86◦/◦◦at the tropopause to about+190 ◦
/◦◦at the stratopause. 20
Over the same altitude range,δD(H2O) rises from –660
◦
/◦◦to –445 ◦
/◦◦, but only by 20 ◦
/◦◦
more to –425◦/◦◦if isotope fractionation is not considered (KIEs=1). This small diff
er-ence is due to the fact that around 38 km, where the major destruction of CH4occurs (Fig.6),δD(CH4) is about+70
◦
/◦◦vs. VSMOW (or 1.070 absolute) and the mean KIE
is∼1.2 only (as there ∼60% of all CH4 molecules are removed by the reaction with
ACPD
3, 3991–4036, 2003Isotope composition of middle atmospheric H2O
Ch. Bechtel and A. Zahn
Title Page
Abstract Introduction
Conclusions References
Tables Figures
◭ ◮
◭ ◮
Back Close
Full Screen / Esc
Print Version
Interactive Discussion
©EGU 2003
O(1D) which is associated with weak isotope fractionation). Therefore, the H2O
pro-duced at 38 km shows a meanδD value of 1.070 / 1.2=0.892 absolute or –108◦/◦◦ vs.
VSMOW. This value does not differ much fromδD(CH4)=–86◦/◦◦ and indeed
demon-strates that the high KIEs of the CH4loss reactions cause a weak shift inδD(H2O) only.
Unfortunately, this finding also documents that theδD(H2O) value does not constitute a
5
sensitive tracer to distinguish between the different CH4 loss reaction chains, contrary to its initial assumption. Such a distinction could only be made with the aid of precise
mass-spectrometry measurements on middle atmospheric H2O samples (which are
not available to date).
Another surprising feature is that both, theδD value of the source molecule CH4and
10
the one of the end product H2O increase with altitude (Fig.7), although mass
conserva-tion forδD suggests the opposite behaviour, at a first glance. In all methane oxidation reactions the most abundant CH4reacts faster than the isotopically substituted CH3D
(Sect.3). Therefore, the remaining CH4 is continuously enriched in D/H with altitude
(solid line in Fig. 7), while that of the freshly formed H2O molecule is always
signif-15
icantly lower (dotted line) compared to the remaining CH4. Despite this D depletion
with respect toδD(CH4), freshly formed H2O still shows much higherδD values than
the H2O lofted from below.
6.3. δ17O(H2O) andδ 18
O(H2O) as tracer for transport and chemistry
As outlined in Sect. 3, the oxygen isotope signature atom of middle atmospheric
20
water vapour is determined by the partitioning of four oxygen isotope sources: (1) mass-dependently fractionated (MDF) H2O imported from the troposphere, (2) mass-independently fractionated (MIF) H2O formed as a final product of the oxidation of CH4,
(3) likewise MIF carrying H2O from the recycling of H2O via the HOxfamily and (4)
oxy-gen atom exchange between H2O and other gases.
25
Theδ17O andδ18O values of source (1), i.e. of H2O imported from the troposphere, are about –67◦/◦◦and –128
◦
iso-ACPD
3, 3991–4036, 2003Isotope composition of middle atmospheric H2O
Ch. Bechtel and A. Zahn
Title Page
Abstract Introduction
Conclusions References
Tables Figures
◭ ◮
◭ ◮
Back Close
Full Screen / Esc
Print Version
Interactive Discussion
©EGU 2003
tope sources (2) to (4), i.e. of the chemical reactions leading to new H2O molecules, are adopted from the respective educt molecules. As outlined by Kaye (1990) and confirmed by our calculations, more than 99% of all H2O molecules generated in the
middle atmosphere are due to hydrogen abstraction from H-containing molecules by OH. Thus, the isotope sources (2) and (3) will show the O isotope signature of OH at
5
the respective altitude. H2O undergoes oxygen isotope exchange (i.e. isotope source
4) with OH and NO2(Table4). Both oxygen exchange reactions are too slow to signifi-cantly affect the isotope composition of H2O in the middle atmosphere.
Therefore, modifications of the oxygen isotope composition of middle atmospheric H2O are almost exclusively controlled by reactions with OH. For this reason, the
10
sources of OH and their oxygen isotope signatures will be studied next. As the re-action chains, by means of which OH is converted into HO2 and back into OH without
breaking the initial OH bond, form a zero cycle with respect to the oxygen isotopic composition, only the reactions forming new OH bonds need to be considered.
6.3.1. The formation of new OH bonds
15
Four classes of reactions, distinguished by the O isotope signal transferred, form new OHxbonds:
(i)HOx that receives the oxygen isotope signature from molecular oxygen via
CH3O+O2→HO2+CH2O (R5)
HCO+O2→HO2+CO (R11)
20
H+O2+M→HO2+M (R12)
Reactions R5 and R11 are part of the CH4oxidation chain and only play a role below 40 km. Reaction R12 dominates the formation of new OH bonds over the entire middle
atmosphere. In addition, oxygen isotope exchange between OHx and O2 may occur
via:
25
ACPD
3, 3991–4036, 2003Isotope composition of middle atmospheric H2O
Ch. Bechtel and A. Zahn
Title Page
Abstract Introduction
Conclusions References
Tables Figures
◭ ◮
◭ ◮
Back Close
Full Screen / Esc
Print Version
Interactive Discussion
©EGU 2003
HOQ+O2↔HO2+OQ (R35)
Assuming the rate constants of reactions R34 and R35 at their estimated upper limit, this oxygen isotope exchange with the O2 reservoir will remarkably influence the
iso-tope composition of OHxand thus of H2O, as shown by Lyons (2001) and verified here (Fig.3).
5
(ii)HOxthat receives the oxygen isotope signature from MIF carrying ozone via
H+O3→OH+O2 (R13)
which is important above 40 km only. Although O3also influences the isotope compo-sition of HO2via OH+O3 → HO2+O2, new OH bonds are not formed. The reason
is that the oxygen atom OH receives from O3is lost again, simply because HO2is an
10
asymmetric molecule (H–O–O).
(iii)HOxthat receives the oxygen signature from MIF carrying O( 1
D) and, in the case of reaction R29, from H2O:
CH4+O(1D)→OH+CH3 (R2)
H2+O(1D)→OH+H (R26)
15
H2O+O(1D)2 OH (R29)
with reaction R29 clearly dominating in the entire middle atmosphere.
(iv)HOxthat receives the oxygen isotope signature from NOx:
QH+NO↔OH+NQ (R31)
QH+NO2↔OH+NOQ (R32)
20
ACPD
3, 3991–4036, 2003Isotope composition of middle atmospheric H2O
Ch. Bechtel and A. Zahn
Title Page
Abstract Introduction
Conclusions References
Tables Figures
◭ ◮
◭ ◮
Back Close
Full Screen / Esc
Print Version
Interactive Discussion
©EGU 2003
6.3.2. The origin of oxygen atoms incorporated in H2O
On the basis of Sect.6.3.1, the influence of each oxygen emission source (O2, O3,
O(1D), and NOx) on the oxygen isotope composition of freshly produced H2O is as-sessed. As demonstrated in Fig. 8 and listed in Table 5, molecular oxygen clearly dominates as source of oxygen atoms transferred to water vapour in the entire middle
5
atmosphere. When neglecting the additional not yet quantified oxygen exchange with O2 (reactions R34 and R35, Sect. 6.3.1), of all oxygen isotopes incorporated in H2O
in stratosphere and mesosphere, respectively,∼78% and∼70% stem from O2,∼17%
and∼30% from O3,∼2% and∼0% from O(1D), and∼2% and∼0% from other gases
such as HNO3or H2O itself. When assuming the additional oxygen exchange reactions
10
R34 and R35 at their estimated upper limit, the oxygen isotope source partitioning will hardly change in the mesosphere. On the contrary, in the stratosphere the hydroxyl radical and thus the water molecules freshly produced will almost completely adopt the oxygen isotopic composition of O2. In this case, no mass-independent fractionation
is transferred to H2O. Another finding is that in the stratosphere ∼50% of the overall
15
oxygen isotope transfer to H2O proceed in two steps (Fig. 8), i.e. from O2 and O3 to NOxand from there via HOx to H2O.
The oxygen isotope source partitioning just described is reflected by the strongly structured vertical profiles of δ17O(H2O) and δ18O(H2O) of freshly produced H2O (Fig. 9). Two maxima occur, both by oxygen atom transfer from O3 to H2O. In the
20
stratosphere, it is due to the oxygen transfer chain O3 O
→ NOx →O HOx →O H2O. In the
mesosphere, it is caused by H +O3 → OH +O2 (reaction R13) and subsequent O
transfer from OH to H2O due to the strongly increasing concentrations of atomic
hy-drogen. If the oxygen exchange reactions R34 and R35 are additionally considered, freshly produced H2O in the stratosphere will have theδ17O(H2O) andδ18O(H2O)
val-25
ACPD
3, 3991–4036, 2003Isotope composition of middle atmospheric H2O
Ch. Bechtel and A. Zahn
Title Page
Abstract Introduction
Conclusions References
Tables Figures
◭ ◮
◭ ◮
Back Close
Full Screen / Esc
Print Version
Interactive Discussion
©EGU 2003
6.3.3. ∆17O(H2O) as a tracer of MIF transfer from O3to H2O
The last Sect.6.3.2 revealed that the pathway of MIF from O3to H2O is different com-pared to the one from O3 to CO2. CO2 is assumed to receive the MIF signal
exclu-sively from O(1D) (produced by the photolysis of O3) via the short-lived intermediate CO
′
3 (Yung et al., 1991, 1997; Barth and Zahn, 1997). In the case of H2O, O( 1
D) is
5
only weakly involved in the oxygen isotope transfer (Table5). In the stratosphere wa-ter vapour receives only∼15% of its MIF signal from O(1D). In the mesosphere O(1D)
does not play any role at all.
As indicated in Fig. 8, in the stratosphere MIF transfer from O3 to H2O basically
proceeds in three steps, first MIF transfer from O3 to NOx species (via reaction
NO-10
1: NO+O3 −→ NO2+O2, Sect. 4.5), then from NOx to OHx and finally transfer to
H2O due to H-abstraction by OH. This quite efficient oxygen transfer chain leads to
peaking∆17O(H2O) values of∼10
◦
/◦◦ at∼35 km altitude (Fig.10). In the mesosphere,
NOxspecies are not involved. There, the entire MIF transfer from O3to HOx(and from there to H2O) proceeds via reaction R13: H+O3−→OH+O2.
15
6.4. Assessment Of results
A simple 1-D box model that considers relatively few chemical reactions was applied. This approach was chosen deliberately, since its simplicity allows to precisely track the pathway of hydrogen and oxygen isotopes from their sources (for hydrogen CH4,
and for oxygen O2and O3) to H2O. The isotope fractionation factors of many reactions
20
involved in the isotope transfer have not been measured up to now. Thus, the additional outcome of using a more sophisticated model is limited. As shown by Lyons (2001) and verified here (see Figs.3,9, and10, and Table5) a major unknown is the possible oxygen isotope exchange of O2 with NOx and HOx. If the relevant reactions R34 and R35 are considered at their estimated upper limit, only a very weak mass-independent
25
ACPD
3, 3991–4036, 2003Isotope composition of middle atmospheric H2O
Ch. Bechtel and A. Zahn
Title Page
Abstract Introduction
Conclusions References
Tables Figures
◭ ◮
◭ ◮
Back Close
Full Screen / Esc
Print Version
Interactive Discussion
©EGU 2003
Independent of the importance of reactions R34 and R35, the MIF signal transferred to HOx (Fig.1) and thus to H2O as calculated by our model is only half as large as the one determined by Lyons (2001). This discrepancy arises from the different∆17O
signatures assumed for the asymmetric O3 molecule and O(
1
D). Lyons (2001) used the branching ratios of 0.43 and 0.57 measured forδ18O in the reaction of O+QO−→
5
OQO,QOO by (Janssen et al. (1999) also for δ17O, and the fractionation factors for this reaction measured by Mauersberger et al. (1999). This assumption led to∆17O values of asymmetric O3of∆17O(QOO)=∼85◦/◦◦, and together with the mean∆17O
values of O3of∆ 17
O(O3) =∼38
◦
/◦◦, to ∆
17
O values of symmetric O3 of∆ 17
O(OQO))
=–50◦/◦◦ (because ∆
17
O(O3) = 2/3 ∆17O(QOO) + 1/3 ∆17O(OQO)). Such a strong
10
δ17O depletion of symmetric ozone is unlikely (C. Janssen, personal communication). In contrast, we assumed identical ratios of the enrichments ofδ17O andδ18O in QOO and OQO. That is, in the stratosphere we assume mean∆17O values of 34◦/◦◦ for O3,
which is in agreement with Lyons (2001), but∆17O values of 39◦/◦◦for QOO, and 25 ◦
/◦◦
for OQO.
15
7. Conclusions
A simple 1-D isotope chemistry box model is applied to derive vertical profiles of the stable isotope ratios D/H,17O/16O, and18O/16O in middle atmospheric water vapour. It was demonstrated that a number of chemical reactions with diverse gases cause iso-tope fractionation in H2O relative to values at the tropopause. This makes a description
20
more complicated compared to other trace gases such as CO2, CH4, and N2O.
δD(H2O) was modelled to increase from –660◦/◦◦at the tropopause to –430 ◦
/◦◦above
40 km, which is in excellent agreement with the observations. This increase by∼230◦/◦◦
corresponds to a fraction of∼40% of H2O produced as end product of the oxidation of
CH4. Although the D fractionation factors of the individual CH4oxidation reactions with
25
ACPD
3, 3991–4036, 2003Isotope composition of middle atmospheric H2O
Ch. Bechtel and A. Zahn
Title Page
Abstract Introduction
Conclusions References
Tables Figures
◭ ◮
◭ ◮
Back Close
Full Screen / Esc
Print Version
Interactive Discussion
©EGU 2003
tracer to distinguish between the different CH4oxidation chains. This has two reasons. First, the major CH4 loss occurs in the middle and upper stratosphere where the
re-actions with O(1D) dominate, accompanied by weak isotope fractionation dominates. Second, the chemical lifetime of H2O is long in the middle atmosphere. This allows for
significant mixing and thus weakening of the spatial gradients ofδD(H2O).
5
The oxygen isotope ratios δ17O(H2O) and δ 18
O(H2O) are calculated to increase
relative to the tropopause by up to∼85◦/◦◦ and∼140◦/◦◦, respectively, which is also in
agreement with the observations. Fractionation of the oxygen isotope ratios in H2O was demonstrated to be determined almost exclusively by the isotope signature of OH. The oxygen isotopic composition of OH, in turn, is mainly controlled by the one of
mass-10
dependently fractionated O2. Depending on the altitude and assumed reaction rates for
isotope exchange reactions with O2(reactions R34 and R35) between 60 and almost
100% of all oxygen atoms transferred to H2O stem from O2, while 40 to 0% originate
from O3. The transfer of mass-independent fractionation in O3to OH and thus to H2O in the stratosphere proceed primarily via NOx species. In the mesosphere, however,
15
it directly takes place via the reaction of H +O3 → OH+ O2. Maximum ∆ 17
O(H2O)
values of 10◦/◦◦around 35 km are calculated.
The largest unknowns in our calculations are the unquantified reaction rates of a few oxygen isotope exchange reactions, in particular of OHx and NOx with O2, and the
many unquantified isotope fractionation factors of the reactions involved in the isotope
20
transfer to H2O. In this respect, the most urgent need in this research field is the de-velopment of more precise techniques to measure the isotope composition of water vapour both in the laboratory and atmosphere.
Acknowledgements. We thank C. Br ¨uhl (MPI for Chemistry, Mainz) for his assistance in the provision of parameter profiles and U. Platt for his scientific assistance.
ACPD
3, 3991–4036, 2003Isotope composition of middle atmospheric H2O
Ch. Bechtel and A. Zahn
Title Page
Abstract Introduction
Conclusions References
Tables Figures
◭ ◮
◭ ◮
Back Close
Full Screen / Esc
Print Version
Interactive Discussion
©EGU 2003
References
Anderson, S. M., Morton, J., and Mauersberger, K.: Laboratory measurements of ozone iso-topomeres by tunable diode laser absorption spectroscopy, Chem. Phys. Lett., 156, 175– 180, 1989.
Baertschi, P.: Absolute180 content of standard mean ocean water, Earth and Plan. Sci. Lett.,
5
31, 341–344, 1976.
Barth, V. and Zahn, A.: Oxygen isotope composition of carbon dioxide in the middle atmo-sphere, J. Geophys. Res., 102, 12 995–10 007, 1997.
Brasseur, G. P. and Solomon, S.: Aeronomy of the middle atmosphere, D. Reidel Publishing Company, Dordrecht/Boston/Lancaster/Tokyo, 1986.
10
Cliff, S. S. and Thiemens, M. H.: The18O/16O and17O/16O ratios in atmospheric nitrous oxide: A mass-independent anomaly, Science, 278, 1774–1775, 1997.
Cliff, S. S., Brenninkmeijer, C. A. M., and Thiemens, M. H.: First measurement of the18O/16O and17O/16O ratios in stratospheric nitrous oxide: A mass-independent anomaly, J. Geophys. Res., 104, 16 171–16 175, 1999.
15
Coplen, T. B., Bohlke, J. K., De Bievre, P., Ding, T., Holden, N. E., Hopple, J. A., Krouse, H. R., Lamberty, A., Peiser, H. S., Revesz, K., Rieder, S. E., Rosman, K. J. R., Roth, E., Taylor, P. D. P., Vocke, R. D., Xiao, Y. K.: Isotope-abundance variations of selected elements (IUPAC Technical Report), Pure Appl. Chem., 74, 10, 1987–2017, 2002.
Craig, H.: Standard for reporting concentrations of deuterium and oxygen-18 in natural waters,
20
Science, 133, 1833–1834, 1961.
Crutzen, P. J.: Methane’s sinks and sources, Nature, 350, 380–381, 1991.
Crutzen, P. J.: On the role of CH4 in atmospheric chemistry: sources, sinks and possible reductions in anthropogenic sources, Ambio, 24, 52–55, 1995.
DeMore, W. B., Howard, C. J., Sander, S. P., Ravishankara, A. R., Golden, D. M., Kolb, C. E.,
25
Hampson, R. F., Molina, M. J., and Kurylo, M. J.: Chemical kinetics and photochemical data for use in stratospheric modeling, Pasadena, CA: JPL Publication 97-4, 1997.
Dessler, A. E., Weinstock, E. M., Anderson, J. G., and Chan, K. R.: Mechanisms controlling water vapor in the lower stratosphere: A tale of two stratospheres, J. Geophys. Res., 100, 23 167–23 172, 1995.
30
ACPD
3, 3991–4036, 2003Isotope composition of middle atmospheric H2O
Ch. Bechtel and A. Zahn
Title Page
Abstract Introduction
Conclusions References
Tables Figures
◭ ◮
◭ ◮
Back Close
Full Screen / Esc
Print Version
Interactive Discussion
©EGU 2003
Dinelli, B. M., Lepri, G., Carlotti, M., Carli, B., Mencaraglia, F., Ridolfi, M., Nolt, I. G., and Ade, P. A. R.: Measurements of the isotope ratio distribution of HD16O and H182 O in the 20-38 km altitude range from far-infrared spectra, Geophys. Res. Lett., 24, 2003–2006, 1997.
Dinelli, B. M., Carli, B., and Carlotti, M.: Measurement of stratospheric distribution of H162 O, H182 O, H172 O and HD16O from far infrared spectra, J. Geophys. Res., 96, 7509–7514, 1991.
5
Dubey, K., Mohrschladt, R., Donahue, N. M., and Anderson, J. G.: Isotope specific kinetics of hydroxyl radical (OH) with water (H2O): Testing models of reactivity and atmospheric frac-tionation, J. Phys. Chem., 101, 1494–1500, 1997.
Forster, P. M. de F. and Shine, K. P.: Stratospheric water vapour changes as a possible contrib-utor to observed stratospheric cooling, Geophys. Res. Lett., 26, 3309–3312, 1999.
10
Forster, P. M. de F. and Shine, K. P.: Assessing the climate impacts of trends in stratospheric water vapor, Geophys. Res. Lett., 29, 10.1029/2001GL013909, 2002.
Friedmann, I. and Scholz, T. G.: Isotopic composition of atmospheric hydrogen, 1967-1969, J. Geophys. Res., 79, 785–788, 1974.
Froidevaux, L. and Yung, Y. L.: Radiation and chemistry in the stratosphere: Sensitivity to
15
O2-absorption cross sections in the Herzberg continuum, Geophys. Res. Lett., 9, 854–857, 1982.
Gettelman, A., Holton, J. R., and Rosenlof, K. H.: Mass fluxes of O3, CH4, N2O and CF2Cl2in the lower stratosphere calculated from observational data, J. Geophys. Res., 102, 19 149– 19 159, 1997.
20
Gierczak, T., Talukdar, R. K., Herdon, S., Vaghjiani, G. L., and Ravishankara, A. R.: Rate coefficients for the reactions of hydroxyl radicals with methane and deuterated methanes, J. Phys. Chem., 101, 3125–3134, 1997.
Greenblatt, G. D. and Howard, C. J.: Oxygen Atom Exchange in the Interaction of18O with Several Small Molecules, J. Phys. Chem., 93, 1035–1042, 1989.
25
G ¨unther, J., Erbacher, B., Krankowsky, D., and Mauersberger, K.: Pressure dependence of two relative ozone formation rate coefficients, Chem. Phys. Lett., 306, 209–213, 1999
Guo, J., Abbas, M. M., and Nolt, I. G.: Stratospheric H218O distribution from infrared observa-tions, Geophys. Res. Lett., 16, 1277–1280, 1989.
Hagemann, R., Nier, G., and Roth, E.: Absolute isotopic scale for deuterium analysis of natural
30
waters. Absolute D/H ratio for SMOW, Tellus, 22, 712–715, 1970.
ACPD
3, 3991–4036, 2003Isotope composition of middle atmospheric H2O
Ch. Bechtel and A. Zahn
Title Page
Abstract Introduction
Conclusions References
Tables Figures
◭ ◮
◭ ◮
Back Close
Full Screen / Esc
Print Version
Interactive Discussion
©EGU 2003
altitude in the Saint Elias Mountains of Canada, J. Geophys. Res., 96, 7483–7494, 1991. Holton, J. R., Haynes, P. H., McIntyre, M. E., Douglass, A. R., Rodd, R. B., and Pfister, L.:
Stratosphere-troposphere exchange, Rev. Geophys., 33, 403–439, 1995.
Hurst, D. F., Dutton, G. S., Romashkin, P. A., Wamsley, P. R., Moor,e F. L., Elkins, J.W., Hintsa, E. J., Weinstock, E. M., Herman, R. L., Moyer, E.J., Scott, D.C., May, R. D., and Webster, C.
5
R.: Closure of the total hydrogen budget of the northern extratropical lower stratosphere, J. Geophys. Res., 104, 8191–8200, 1999
IPCC, Climate Change 2001: The Scientific Basis, Contribution of Working Group I to the Third Assessment Report of the Intergovernmental Panel on Climate Change (IPCC) J.T. Houghton, Y. Ding, D.J. Griggs, M. Noguer, P.J. van der Linden, and D. Xiaosu (Eds.),
Cam-10
bridge University Press, UK, pp. 944, 2001.
Janssen, C., Guenther, J., Krankowsky, D., and Mauersberger, K.: Relative formation rates of
50
O3, and52O3in16O -18O mixtures, J. Chim. Phys., 111, 7179–7182, 1999.
Johnson, D. G., Jucks, K. W., Traub, W. A., and Chance, K. V.: Isotopic composition of strato-spheric water vapor: Measurements and photochemistry, J. Geophys. Res., 106, 12 211–
15
12 218, 2001a.
Johnson, D. G., Jucks, K. W., Traub, W. A., and Chance, K. V.: Isotopic composition of stratospheric water vapor: Implications for transport J. Geophys. Res., 106, 12 219–12 226, 2001b.
Kaiser, J., Brenninkmeijer, C. A. M., and R ¨ockmann, T.: Intramolecular15N and 18O
fractiona-20
tion in the reaction of N2O with O(1D) and its implications for the stratospheric N2O isotope signature, J. Geophys. Res., 107, 10.1029/2001JD001506, 2002.
Kaye, J. A. and Strobel, D. F.: Enhancement of heavy ozone in the Earth’s atmosphere?, J. Geophys. Res., 88, 8447–8452, 1983
Kaye, J. A.: Analysis of the origins and implications of the18O content of stratospheric water
25
vapour, J. Atmos. Chem., 10, 39–51, 1990.
Keith, D. W.: Stratospheric-tropospheric exchange: Inferences from the isotopic composition of water vapour, J. Geophys. Res., 105, 15 167–15 173, 2000.
Khalil, M. A. K., Khalil, M. A. K., Shearer, M. J., and Rasmussen, R. A.: Methane sinks and distribution, in Atmospheric Methane: Sources, Sinks, and Role in Global Change, edited by
30
M.A.K. Khalil, NATO ASI Ser. I, Vol. 13, Springer-Verlag, New York, 1993.
ACPD
3, 3991–4036, 2003Isotope composition of middle atmospheric H2O
Ch. Bechtel and A. Zahn
Title Page
Abstract Introduction
Conclusions References
Tables Figures
◭ ◮
◭ ◮
Back Close
Full Screen / Esc
Print Version
Interactive Discussion
©EGU 2003
399–401, 1999.
Kuang, Z., Toon, G. C., Wennberg, P. O., and Yung, Y. L.: Measured HDO/H2O ratios across the tropical tropopause, Geophys. Res. Lett., 30(7) 1372, doi: 10.1029/2003GL017023, 2003. Lary, D. J. and Toumi, T.: Halogen-catalyzed methane oxidation, J. Geophys. Res., 102,
23 421–23 428, 1997.
5
Lelieveld, J. and Crutzen, P. J.: Influences of cloud photochemical processes on tropospheric ozone, Nature, 343, 227–233, 1990.
Lelieveld, J. and Crutzen, P. J.: Role of deep convection in the ozone budget of the troposphere, Science, 264, 1759–1761, 1994.
Lelieveld, J., Crutzen, P. J., and Dentener, F. J.: Changing concentration, lifetime and climate
10
forcing of atmospheric methane, Tellus, 50B, 128–150, 1998
Le Texier, H., Solomon, S., and Garcia, R. R.: The role of molecular hydrogen and methane oxidation in the water vapour budget of the stratosphere, Q.J.R. Meteorol. Soc., 114, 281– 295, 1988.
Li, W., Baoling, N., Deqiu, J., and Qingliang, Z.: Measurement of the absolute abundance of
15
oxygen-17 in VSMOW, Kexue Tongbao (Chinese Science Bulletin), 33, 1610–1613, 1988. L ´opez-Valverde, M. A., L ´opez-Puertas, M., Remedios, J. J., Rodgers, C. D., Taylor, F. W., Zipf,
E. C., and Erdman, P. W.: Validation of measurements of carbon monoxide from the improved stratospheric and mesospheric sounder, J. Geophys. Res., 101, 9929–9955, 1996.
Luz, B., Barkan, E., Bender, M. L., Thiemens, M.H., and Boering, K.A.: Triple-isotope
com-20
position of atmospheric oxygen as a tracer of biosphere productivity, Nature, 400, 547–550, 1999.
Lyons, J. R.: Transfer of mass-independent fractionation in ozone to other oxygen-containing radicals in the atmosphere, Geophys. Res. Lett., 28, 3231–3234, 2001.
Masgrau, L., Gonz ´alez-Lafont, A., and Lluch, J. M.: Mechanism of the gas-phase HO+H2O⇀ 25
H2O+OH reaction and several associated isotope exchange reactions: A canonical varia-tional transition state theory plus multidimensional tunneling calculation, J. Phys. Chem.A, 103, 1044–1053, 1999.
Massie S. T. and Hunten, D. M.: Stratospheric eddy diffusion coefficients from tracer data, J. Geophys. Res., 86, 9859–9868, 1981.
30
Mauersberger, K., Erbacher, B., Krankowsky, D., G ¨unther, J., and Nickel, R.: Ozone isotope enrichment: Isotopomer-Specific rate coefficients, Science, 283, 370–372, 1999.

![Fig. 3. Calculated vertical profiles of δ 17 O(H 2 O) (graph a) and δ 18 O(H 2 O) (graph b) compared to ATMOS Spacelab 3 infrared solar spectra near 30 ◦ N [Rinsland et al., 1991]](https://thumb-eu.123doks.com/thumbv2/123dok_br/17067499.235192/39.918.207.507.38.529/calculated-vertical-profiles-compared-spacelab-infrared-spectra-rinsland.webp)
![Fig. 4. Middle atmospheric budgets of a: H 2 O, numbers are mass fluxes in Mt yr − 1 (the flux into the stratosphere is adopted from Yang and Tung [1996], other numbers are model results), b: δD, numbers are mean δD values in ◦ / ◦◦ of the individual speci](https://thumb-eu.123doks.com/thumbv2/123dok_br/17067499.235192/40.918.234.479.40.471/atmospheric-budgets-numbers-stratosphere-adopted-results-numbers-individual.webp)