PLoS Medicine | www.plosmedicine.org 2159
Correspondence
November 2006 | Volume 3 | Issue 11 | e503
Air Travel and the Spread of Infl uenza:
Important Caveats
Cécile Viboud, Mark A. Miller, Bryan T. Grenfell, Ottar
N. Bjørnstad, Lone Simonsen
While air travel contributes to the spread of infl uenza epidemics, the magnitude of impact is not clear compared to other factors—a crucial issue when considering a fl ight ban in the context of pandemic planning. Recent modeling efforts simulating the spread of pandemic infl uenza have concluded that such an intervention would matter little relative to other interventions [1–3]. But this assessment has now been challenged by an observational study of infl uenza in the winter following the post-9/11/2001 depression in air traffi c. Brownstein and colleagues’ study published in the September issue of PLoS Medicine [4] correlates variations in air traffi c volume with patterns of timing and spread in infl uenza epidemics, based on United States mortality data from nine epidemic seasons between 1996 and 2005. While we fi nd the study interesting, we have identifi ed several important caveats and question the robustness of the conclusions.
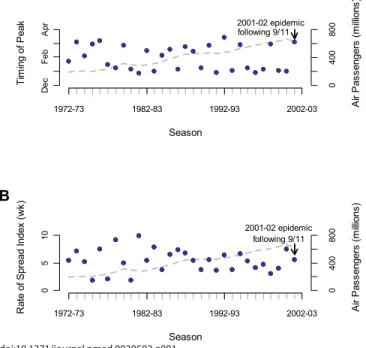
The core of this study’s results lies in the observation that the 2001–2002 infl uenza epidemic immediately following 9/11 was late in the season and peaked in March (week of year 11), whereas the eight surrounding epidemics peaked between the end of December and the end of February (week of year 52 to 9). The authors attribute this delay to the 27% decline in air traffi c that followed 9/11.
Given the complexities of infl uenza virus subtype cycling and antigenic drift [5,6], it is essential to consider longer-term disease data spanning much more than nine years to interpret the “lateness” of the 2001–2002 epidemic. Using US national vital statistics data covering 30 winters from 1972 to 2002 [5], we identifi ed four epidemics peaking in the month of March (13%), including the 2001–2002 epidemic following 9/11, but also two epidemics in the 1970s and the more recent 1991–1992 epidemic (Figure 1A). Furthermore, the average timing of infl uenza epidemics has not changed between 1972 and 2002—despite a concurrent and steady increase in air traffi c volume by over 300% (Figure 1A) [7]. Indeed, during the earlier part of the last century when air traffi c was minimal, infl uenza epidemics rapidly circulated around the world. Moreover, real-time infl uenza virus surveillance data from the US Centers for Disease Control and Prevention [8] show that last winter’s (2005–2006) epidemic was even more delayed than the epidemic following 9/11, despite a 20% increase in air passenger traffi c compared to the situation before 9/11 [7]. Clearly, late-season infl uenza epidemics have occurred and are still occurring even in the absence of restrictions on air travel. Hence a longer time perspective, with observations from both prior and more recent data, challenges this study’s conclusions.
In addition to comparing the timing of infl uenza epidemics across different seasons, Brownstein et al. analyzed the rate of disease spread among US administrative regions for their nine seasons of interest (1996–2005). In our previous work, we estimated the rate of infl uenza spread among all US states for 30 consecutive seasons (1972–2002) [5]. Our analysis shows that the epidemic following 9/11 spread at
a rate comparable to other epidemics (Figure 1B), even after adjusting for the subtype of circulating viruses [5]. To increase our understanding of the spread of infl uenza, it is essential to quantify the relative importance of different modes of transportation. As an example, our recent study considered multiple modes of transportation (including air travel) and identifi ed travel to and from work as a key determinant of the regional spread of epidemics [5].
In conclusion, Brownstein and colleagues’ analysis of the “natural experiment” of the post-9/11 season is innovative and ingenious—but in and of itself could not demonstrate a robust association or a causal link between the decrease in air traffi c and delayed timing of infl uenza epidemics. Even if there in fact had been a delay as hypothesized, the study lacked power to address the hypothesis, because this single “natural experiment” was set in a background of considerable variability in infl uenza epidemic patterns. Extrapolations from the study’s fi ndings predict that a fl ight ban could delay a pandemic by two months [9]—but we have shown here that this prediction is not supported by the analysis of more extensive disease data and transportation statistics. It is also unclear how a “natural experiment” conducted in the inter-pandemic period is applicable to a pandemic situation, where novel infl uenza viruses have higher transmissibility and circulate in fully susceptible populations, and may cause different age-patterns of transmission [10]. While Brownstein and colleagues’ study represents an intriguing starting point, this study alone does not provide the critical quantitative evidence needed to evaluate the impact of travel restrictions on future pandemics.
Cécile Viboud ([email protected])
doi:10.1371/journal.pmed.0030503.g001
PLoS Medicine | www.plosmedicine.org 2160
Mark A. Miller
Fogarty International Center, National Institutes of Health Bethesda, Maryland, United States of America
Bryan T. Grenfell
Ottar N. Bjørnstad
Center for Infectious Diseases Dynamics, Pennsylvania State University University Park, Pennsylvania, United States of America
Fogarty International Center, National Institutes of Health Bethesda, Maryland, United States of America
Lone Simonsen
National Institute of Allergy and Infectious Diseases, National Institutes of Health Bethesda, Maryland, United States of America
References
1. Cooper BS, Pitman RJ, Edmunds WJ, Gay NJ (2006) Delaying the international spread of pandemic infl uenza. PLoS Med 3: e212. doi:10.1371/journal.pmed.0030212
2. Ferguson NM, Cummings DA, Fraser C, Cajka JC, Cooley PC, et al. (2006) Strategies for mitigating an infl uenza pandemic. Nature 442: 448–452. 3. Germann TC, Kadau K, Longini IM Jr, Macken CA (2006) Mitigation
strategies for pandemic infl uenza in the United States. Proc Natl Acad Sci U S A 103: 5935–5940.
4. Brownstein JS, Wolfe CJ, Mandl KD (2006) Empirical evidence for the effect of airline travel on inter-regional infl uenza spread in the United States. PLoS Med 3: e401. doi:10.1371/journal.pmed.0030401
5. Viboud C, Bjornstad ON, Smith DL, Simonsen L, Miller MA, et al. (2006) Synchrony, waves, and spatial hierarchies in the spread of infl uenza. Science 312: 447–451.
6. Smith DJ, Lapedes AS, de Jong JC, Bestebroer TM, Rimmelzwaan GF, et al. (2004) Mapping the antigenic and genetic evolution of infl uenza virus. Science 305: 371–376.
7. Bureau of Transportation Statistics (2006) Air carrier traffi c statistics. US Department of Transportation. Available: http:⁄⁄www.bts.gov/programs/ airline_information/air_carrier_traffi c_statistics. Accessed 25 October 2006. 8. US Centers for Disease Control and Prevention (2006) Infl uenza activity in
the US. Available: http:⁄⁄www.cdc.gov/fl u. Accessed 25 October 2006. 9. Enserink M (2006) Ground the planes during a fl u pandemic? Studies
disagree. Science 313: 1555.
10. Epstein SE (2006) Prior H1N1 infl uenza infection and susceptibility of Cleveland Family Study participants during the H2N2 pandemic of 1957: An experiment of nature. J Infect Dis 193: 49–53.
Citation: Viboud C, Miller MA, Grenfell BT, Bjørnstad ON, Simonsen L (2006) Air travel and the spread of infl uenza: Important caveats. PLoS Med 3(11): e503. doi:10.1371/journal.pmed.0030503
Copyright: © 2006 Viboud et al. This is an open-access article distributed under the terms of the Creative Commons Attribution License, which permits unrestricted use, distribution, and reproduction in any medium, provided the original author and source are credited.
Funding: The authors received no specifi c funding for this article.
Competing Interests: The authors have declared that no competing interests exist.
Air Travel and the Spread of Infl uenza: Authors’ Reply
Viboud et al. [1] offer thoughtful commentary on our paper [2], opening a scientifi c exchange that we hope brings attention to a critical issue. We reported the fi rst empirical and quantitative evidence for the effect of airline travel on the rate of epidemic infl uenza spread. Though other investigators have also found this relationship [3–6], there is no consensus on effect size. We welcome scrutiny of our methods and results and believe the fi ndings stand for the following reasons.
Viboud et al., taking a longer historical perspective, suggest that the slower spread and late peaking of the 2001–2002 season is not unique and highlight three other late seasons dominated by infl uenza B (1992–1993, 1973–1974, and 1976–1977). Recent studies, including one by Viboud and colleagues, fi nd that B seasons have different epidemiological characteristics than A/H3N2 seasons, which may explain the late peaking in these years [7,8]. As 2001–2002 was
dominated by infl uenza A/H3N2, late peaking in 2001–2002 cannot be explained by dominant subtype (nor climatic conditions). Our study period from 1996–2005 represents the longest stretch of A/H3N2 seasons in over 30 years, essentially controlling for subtype. Viboud et al. also point to the 2005– 2006 season as particularly delayed. We examined peaking during that season using mortality data from the US Centers for Disease Control and Prevention, in order to compare to our estimates from prior seasons [9]. We fi nd that mortality as well as morbidity was bimodal, with larger peaks in January and December, respectively. We thus reaffi rm that 2001–2002, being the latest peaking H3N2 season in over 30 years, is an aberrant season for which airline travel interruption remains the best explanation.
Viboud and colleagues’ letter does not take into account that our results are not simply based on an outlier year, nor are they based on a single data source. Rather, we have revealed an important correlation across nine infl uenza seasons. The impact of airline volume on fl u spread does not depend on the 2001–2002 season and remains signifi cant even after its exclusion. Since considering longer time series may provide insight, we repeated our methods on the 30-year mortality time series which Viboud et al. also analyzed [10]. We employed the same spatial aggregation (nine geographic regions) and time series methods as described in [2]. We
doi:10.1371/journal.pmed.0030502.g001
Figure 1. Infl uence of United States Airline Volume on Infl uenza Spread and the Timing of Yearly Transmission over 30 Infl uenza Seasons
(A) The association between airline travel from September to December and the timing of the US infl uenza peak is displayed. Airline volume signifi cantly predicts the timing of seasonal infl uenza mortality (r2 = 0.460; p < 0.001). The timing of seasonal national infl uenza mortality (blue dots) is estimated from cross-correlation of each season with the 1972–1973 season. (B) The association between airline travel from September to December and time to transnational US spread is displayed. The numbers of traveling domestic passengers signifi cantly predicts transnational infl uenza spread (r2 = 0.265; p = 0.004). Index spread of infl uenza (blue dots) is estimated from the 99% confi dence interval of the cross-correlation values for the nine major geographic regions of the United States against the national curve for a give year, as previously described [2].
PLoS Medicine | www.plosmedicine.org 2161
found substantial long-term log-linear trends toward earlier peaking and faster spreading infl uenza epidemics that are correlated with air travel volume (r2 = 0.460; p < 0.001 and r2 = 0.265; p = 0.004, respectively, Figure 1). Thus, our new
analyses of longer-term data support an effect of airline travel volume.
We strongly caution that other factors may infl uence these trends, including population density, air passenger demographics, ground transportation, and climate. Our design relies on a shorter, more recent time series to avoid confounding by longer term secular trends that may be evident in the 30-year time series. Given the three year backlog of the 30-year dataset, the data Viboud et al. use do not permit the interrupted time series analysis at the core of our investigation.
Reconciliation of our different time series methodologies and datasets should be considered in future research. Nonetheless, because our results were confi rmed with viral surveillance data, we remain confi dent in the robustness of our analysis. We agree that other modes of transportation are important infl uences; our paper makes no claim that air travel is the only mechanism of spread, and we explicitly report that our model explains a portion of the variation in yearly infl uenza spread and peak.
Finally, Viboud et al. emphasize the limited applicability of our fi ndings to pandemics. We agree and have highlighted this limitation in our paper. The decision to restrict travel should be multifactorial. We do hope that it will be evidence based. Our analyses (including those presented here) provide empirical insight into the previously uncharacterized effect of air travel fl uctuation on infl uenza spread. They are one contribution to a small body of investigations that are forming the basis of global policy on fl u preparedness. Though the effect we observe might be smaller under pandemic conditions, the benefi t of a delay is worthy of consideration by scientists and policy makers where lives are at stake and even a short lead time may be of enormous public health value.
We are pleased that Viboud et al. have engaged in a discourse that we hope will strengthen the scientifi c basis of pandemic preparedness. We call on governments, industry, and health care to create a more accessible, freely available, and well-documented data repository for geographically and temporally detailed data on infl uenza [11] and encourage empirical analyses of the dynamics and mechanisms of infl uenza spread.
John S. Brownstein ([email protected])
Kenneth D. Mandl
Children’s Hospital Boston
Harvard–MIT Division of Health Sciences and Technology Harvard Medical School
Boston, Massachusetts, United States of America
Cecily J. Wolfe
University of Hawaii at Manoa
Honolulu, Hawaii, United States of America
References
1. Viboud C, Miller MA, Grenfell BT, Bjornstad ON, Simonsen L (2006) Air travel and the spread of infl uenza: Important caveats. PLoS Med 3: e503. doi:10.1371/journal.pmed.0030503
2. Brownstein JS, Wolfe CJ, Mandl KD (2006) Empirical evidence for the effect of airline travel on inter-regional infl uenza spread in the United States. PLoS Med 3: e401. doi:10.1371/journal.pmed.0030401
3. Bonabeau E, Toubiana L, Flahault A (1998) The geographical spread of infl uenza. Proc Biol Sci 265: 2421–2425.
4. Grais RF, Ellis JH, Kress A, Glass GE (2004) Modeling the spread of annual infl uenza epidemics in the U.S.: The potential role of air travel. Health Care Manag Sci 7: 127–134.
5. Longini IM Jr, Fine PE, Thacker SB (1986) Predicting the global spread of new infectious agents. Am J Epidemiol 123: 383–391.
6. Rvachev L, Longini I (1985) A mathematical model for the global spread of infl uenza. Math Biosci 75: 3–22.
7. Greene SK, Ionides EL, Wilson ML (2006) Patterns of infl uenza-associated mortality among US elderly by geographic region and virus subtype, 1968– 1998. Am J Epidemiol 163: 316–326.
8. Viboud C, Bjornstad ON, Smith DL, Simonsen L, Miller MA, et al. (2006) Synchrony, waves, and spatial hierarchies in the spread of infl uenza. Science 312: 447–451.
9. US Centers for Disease Control and Prevention (2005) Morbidity and mortality weekly report table III (mortality). Available: http:⁄⁄wonder.cdc. gov/mmwr/mmwrmort.asp. Accessed 25 October 2006.
10. National Center for Health Statistics (2005) Multiple cause-of-death fi les on CD-ROM. Hyattsville (MD): US Department of Health and Human Services. 11. Salzberg S, Ghedin E, Spiro D (2006) Shared data are key to beating threat
from fl u. Nature 440: 605.
Citation: Brownstein JS, Wolfe CJ, Mandl KD (2006) Air travel and the spread of infl uenza: Authors’ reply. PLoS Med 3(11): e502. doi:10.1371/journal.pmed.0030502
Copyright: © 2006 Brownstein et al. This is an open-access article distributed under the terms of the Creative Commons Attribution License, which permits unrestricted use, distribution, and reproduction in any medium, provided the original author and source are credited.
Funding: This work was supported by grants R21 LM009263-01 and R01 LM007677-01 and training grant 2TA5 LM07092-11 from the National Library of Medicine, National Institutes of Health, and the Canadian Institutes of Health Research.
Competing Interests: The authors have declared that no competing interests exist.
Fluoxetine and Suicide Rates:
Suicide and the Economy
Carlos A. Camargo, Daniel A. Bloch
We wish to comment on the paper by Milane et al. [1] and also refer to the Perspective by Baune and Hay [2] in the June issue of PLoS Medicine on the effect of fl uoxetine prescriptions on the suicide rate in the United States. Milane et al.
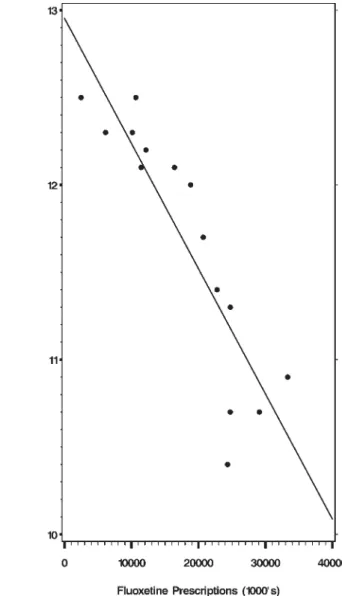
examined two sets of variables: the number of prescriptions for fl uoxetine in the United States, and the Census Bureau mortality tables with the age adjusted suicide rates for the years 1988 to 2002. The date 1988 is chosen because in that year fl uoxetine was introduced in the US. The authors report that the Spearman correlation coeffi cient between the two sets of variables equals -0.92 with a p-value of less than 0.001. The less suicides, the more tablets of fl uoxetine are prescribed, or vice versa. The least-squares regression line is displayed in Figure 1.
From this simple association they build an elaborate edifi ce, predicting what the suicide trends would have been had fl uoxetine not been prescribed, and they calculate fi gures for “the thousands of lives saved” for both men and women...even though it is not known how many of these prescriptions were for men or for women, whether the patients took the tablets or not, or for how long they took the medication. In addition, the baseline period used to calculate the suicide trend, and thus to predict the future, was arbitrary: from 1960 to 1987, when the suicide rates had a slight gradual increase in the 1970s. Had they used the period 1950 to 1987, a different “trend” would have been obtained, since the suicide rates decreased during the economic expansion of the 1950s [3].
It is widely known that one cannot infer causality simply based on statistical association. Baune and Hay pointed this out and wrote: “In a study like this, it is also important to consider other potential explanations for the fall of suicide
PLoS Medicine | www.plosmedicine.org 2162
rates, such as improvements in the economy...” In this letter we report on the association of other variables with the suicide rates, for we fi nd that the most glaring defect of the Milane et al. article is the total absence of analysis to address likely confounding by many other factors.
Suicide is the fi nal outcome of many conditions, and there have been, for many decades, scholarly articles indicating the many risk factors which increase the likelihood of suicide: poverty, loss of employment, and several other economic indicators have been shown to have a strong effect upon suicide rates. For example, during the Great Depression of the 1930s the rate of suicide rose signifi cantly, and fell when the economy improved and unemployment decreased in the 1940s. On this matter, the literature is quite clear and the references abundant [4–8]. In the 1990s there was a very substantial and prolonged improvement of the US economy [9], which could partially explain a lowering of the suicide rate. We have chosen three economic indicators for the period from 1988 to 2002 and correlated them with the suicide rate, using the Spearman correlation coeffi cient to quantify the strength of the association. The yearly data for
the suicide rates and numbers of fl uoxetine prescriptions, for the three economic indicators (Dow Jones average, food stamp rate, and unemployment rate) and for the property crime and burglary rates are all contained in Table 1. The fi ndings are not surprising: The unemployment rate during those years has a strong positive correlation with the suicide rate: r = 0.62, p = 0.014.
The percentage of the US population eligible for the Food Stamp Program, a reasonable indicator of poverty rates, has a stronger positive correlation with the suicide rates: r = 0.84, p
= 0.0002.
The Dow Jones industrial average for each of those years, when compared with the suicide rate of the US population, gives an even stronger (negative) correlation: r = -0.98, p < 0.0001 (see Figure 2).
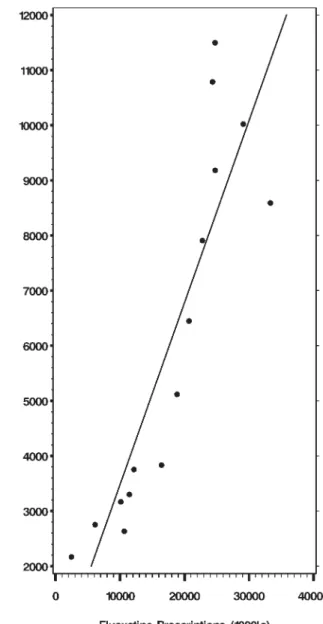
We also calculated the correlation between fl uoxetine prescriptions and the Dow Jones average. Not surprisingly, there is a very strong positive correlation: r = 0.925, p < .0001 (see Figure 3).
We doubt that many will advance the thesis that the increasing sales of fl uoxetine were, somehow, one of the
doi:10.1371/journal.pmed.0030501.g001
Figure 1. Correlation between Suicide Rates and Fluoxetine Prescriptions
doi:10.1371/journal.pmed.0030501.g002
Figure 2. Correlation between Suicide Rates and the Dow Jones Average
PLoS Medicine | www.plosmedicine.org 2163
causes of the rise of the Dow Jones index. In fact, if the number of fl uoxetine prescriptions is correlated with any variable that also steadily increased, or decreased, during all those years (1988–2002), a statistically signifi cant association is most likely to be demonstrated. For example, the rate of crimes against property, obtained from the US Department of Justice, for the period 1988–2002 also exhibits a very high negative correlation with the fl uoxetine prescriptions: r = -0.99, p < 0.0001. The rate of burglaries does also: r = -0.99,
p < 0.0001. These relationships are not causal. Most scholars would relate the decrease in crime rates to the improvement of the economy during those years, rather than to increased sales of fl uoxetine. The Spearman correlation coeffi cients for all possible pair-wise comparisons are contained in Table 2.
Given these fi ndings, we decided to explore the
relationship of suicide rates with both fl uoxetine prescriptions and Dow Jones averages as potentially associative factors in a single multivariate model. Results are displayed in Table 3. This allowed us to assess the association between fl uoxetine and suicide adjusting for the Dow Jones, an economic indicator. Statistically, the association is quantifi ed with a “partial” Spearman correlation coeffi cient. With this analysis the fl uoxetine association was not signifi cantly correlated with the suicide rate: fl uoxetine had an adjusted Spearman
correlation of -0.18 (p = 0.54) whereas the adjusted Dow Jones correlation remained high at -0.88 (p < 0.0001).
In conclusion, we believe that there is little likelihood that the increasing sales of fl uoxetine from 1988 to 2002 were the cause of the modest decrease in the suicide rate during those years. It appears more likely that factors such as those connected with the sustained economic recovery of the 1990s were responsible.
Carlos A. Camargo ([email protected])
Daniel A. Bloch
Stanford University School of Medicine Stanford, California, United States of America
Table 1.
Raw Data by Year
Year Suicide Rate Dow Jones a Food Stamp b Unemployed c Fluoxetine
Prescriptions a
Property Crime d Burglary d
1988 12.5 2,168 15.6 5.5 2,469 378.4 74.3
1989 12.3 2,753 5.3 6,133 373.4 67.7
1990 12.5 2,633 15.07 5.6 10,655 348.9 64.5
1991 12.3 3,168 16.25 6.8 10,120 353.7 64.6
1992 12.1 3,301 17.05 7.5 11,443 325.3 58.6
1993 12.2 3,754 17.55 6.9 12,163 318.9 58.2
1994 12.1 3,834 17.03 6.1 16,427 310.2 56.3
1995 12 5,117 13.33 5.6 18,838 290.5 49.3
1996 11.7 6,448 13 5.4 20,705 266.4 47.2
1997 11.4 7,908 11.88 4.9 22,776 248.3 44.6
1998 11.3 9,181 11.22 4.5 24,757 217.4 38.5
1999 10.7 11,497 11.56 4.2 24,742 198 34.1
2000 10.4 10,787 10.62 4 24,344 178.1 31.8
2001 10.7 10,021 11.14 4.7 29,097 166.9 28.7
2002 10.9 8,589 12.04 5.8 33,320 159 27.7
a Suicide rates and number of fl uoxetine prescriptions from [1]. Dow Jones industrial averages used are for the last day of December of each year. Available: http://fi nance.yahoo.com/q/
hp?s=%5EDJI&a=11&b=1&c=1988&d=11&e=11&f=2002&g=d&z=66&y=3234. Accessed 31 October 2006.
b Food Stamp Program rates are obtained by dividing the number of eligible individuals by the US population for each year. Figures from Food Stamp Program Operations Data and the US
Census Bureau.
c Unemployment rates were obtained from the US Census Bureau, Statistical Abstract of the United States: 2006 (125th Edition), Washington D. C., Table 576.
d Rates for total property crime and burglary were obtained from the US Department of Justice, Bureau of Justice Statistics. Available: http://www.ojp.usdoj.gov/bjs/gvc.htm#Property.
Accessed 31 October 2006.
doi:10.1371/journal.pmed.0030501.t001
Table 2. Spearman Correlation Coeffi cients (p-Value, Sample Size)
Dow Jones Food Stamp Unemployed Property Crime Burglary Fluoxetine
Suicide Rate -0.98 (<0.001, 15) 0.84 (0.0002, 14) 0.62 (0.0145, 15) 0.95 (<0.0001, 15) 0.95 (<0.0001, 15) -0.92 (<0.0001, 15) Dow Jones -0.83 (0.0002, 14) -0.63 (0.0108, 15) -0.94 (<0.0001, 15) -0.94 (<0.0001, 15) 0.93 (<0.0001, 15) Food Stamp 0.92 (<0.0001, 14) 0.80 (0.0006, 14) 0.80 (0.0006, 14) -0.78 (0.0010, 14) Unemployed 0.50 (0.0574, 15) 0.50 (0.0574, 15) -0.49 (0.0661, 15) Property Crime 1.00 (<0.0001, 15) -0.99 (<0.0001, 15)
Burglary -0.99 (<0.0001, 15)
doi:10.1371/journal.pmed.0030501.t002
Table 3. Type III Analysis of Variance Table for Regression of Suicide Rate on Dow Jones Averages and Number of Fluoxetine Prescriptions
Source DF SS MS F-Value p-Value
Dow Jones 1 1.26 1.26 44.77 <0.0001 Fluoxetine 1 0.01 0.01 0.38 0.5481
DF, degrees of freedom; MS, mean square; SS, sum of squares doi:10.1371/journal.pmed.0030501.t003
PLoS Medicine | www.plosmedicine.org 2164 References
1. Milane MS, Suchard MA, Wong ML, Licinio J (2006) Modeling of the temporal patterns of fl uoxetine prescriptions and suicide rates in the United States. PLoS Med 3: e190. doi: 10.1371/journal.pmed.0030190 2. Baune B, Hay P (2006) Suicide rates and antidepressant prescribing: A
casual or causal relationship? PLoS Med 3: e220. doi:10.1371/journal. pmed.0030220
3. US Bureau of the Census (1975) Historical statistics of the United States. Tables H 972–986, Homicides and Suicides: 1900 to 1970.
4. Berk M, Dodd S, Henry M (2006) The effect of macroeconomic variables on suicide. Psychol Med 36: 181–189.
5. Watts J (1998) Suicide rate rises as South Korea’s economy falters. Lancet 352: 136.
6. Goldsmith SK, Pellmar TC, Kleinman AM, Bunney WE, editors (2002) Chapter 6: Society and culture. In: Reducing suicide: A national imperative. Washington (D. C.): National Academies Press. pp. 193–228. Available: http:⁄⁄darwin.nap.edu/books/0309083214/html/193.html. Accessed 26 October 2006.
7. Lester BY (2001) Learning from Durkheim and beyond: The economy and suicide. Suicide Life Threat Behav 31: 15–31.
8. Kposowa AJ (2001) Unemployment and suicide: A cohort analysis of social factors predicting suicide in the US National Longitudinal Mortality Study. Psychol Med 31: 127–138.
9. Table 762, Business cycle expansions and contractions 1918–2001, in Statistical Abstract of the United States: 2006. 125th Ed., US Dept. of Commerce and US Census Bureau.
Citation: Camargo CA, Bloch DA (2006) Fluoxetine and suicide rates: Suicide and the economy. PLoS Med 3(11): e501. doi:10.1371/journal.pmed.0030501
Copyright: © 2006 Camargo and Bloch. This is an open-access article distributed under the terms of the Creative Commons Attribution License, which permits unrestricted use, distribution, and reproduction in any medium, provided the original author and source are credited.
Funding: The authors received no specifi c funding for this article.
Competing Interests: The authors have declared that no competing interests exist.
Fluoxetine and Suicide Rates: Author’s Reply
Suicide is a complex outcome which cannot be attributed to a single factor. While we explored an association between suicide and antidepressant prescriptions, we fully acknowledge, as Camargo and Bloch suggest [1], that our work does not fully explain the observed trends. However, in other settings, the same association between increased antidepressant prescriptions and decreases in suicide have been observed. Please refer to the following article, published after ours came out in PLoS Medicine: “Increased antidepressant use and fewer suicides in Jamtland county, Sweden, after a primary care educational programme on the treatment of depression” [2].
I look forward to reading Camargo and Bloch’s new article on the association of socioeconomic factors and suicide rates.
Julio Licinio ([email protected])
University of Miami
Miami, Florida, United States of America
References
1. Camargo CA, Bloch DA (2006) Fluoxetine and suicide rates: Suicide and the economy. PLoS Med 3: e501. doi:10.1371/journal.pmed.0030501 2. Henriksson S, Isacsson G (2006) Increased antidepressant use and fewer
suicides in Jamtland county, Sweden, after a primary care educational programme on the treatment of depression. Acta Psychiatr Scand 114: 159–167.
Citation: Licinio J (2006) Fluoxetine and suicide rates: Author’s reply. PLoS Med 3(11): e504. doi:10.1371/journal.pmed.0030504
Copyright: © 2006 Julio Licinio. This is an open-access article distributed under the terms of the Creative Commons Attribution License, which permits unrestricted use, distribution, and reproduction in any medium, provided the original author and source are credited.
Funding: The author received no specifi c funding for this article.
Competing Interests: The author has declared that no competing interests exist.
Intellectual Property and Access to
ART: Unwise Choice of Terminology
Richard Stallman
The article “How Do Intellectual Property Law and International Trade Agreements Affect Access to Antiretroviral Therapy?” is very useful for its substance, but due to an unwise choice of terminology, it will tend to mislead the public in a way that the authors and editors probably are not aware of, which will promote the sorts of abuse that it seeks to criticize. This results from the use of the term “intellectual property.” This article uses the terms “intellectual property law” and “patent law” interchangeably, which is like using “Asia” and “India” synonymously. However, most readers will recognize the latter as loose use of language,
doi:10.1371/journal.pmed.0030501.g003
Figure 3. Correlation between Fluoxetine Prescriptions and the Dow Jones Average
PLoS Medicine | www.plosmedicine.org 2165
so they will not really be led astray. Only a few will realize that identifying patents with “intellectual property law” is just as mistaken, so real confusion will result. I ask the editors of PLoS Medicine, and the readers and writers of articles, to be on guard against confusing use of the term “intellectual property”—which means, nearly all use of the term. See http:⁄⁄www.gnu.org/philosophy/not-ipr.xhtml for more explanation of the problems of this term.
Richard Stallman ([email protected])
Free Software Foundation
Boston, Massachusetts, United States of America
References
1. Westerhaus M, Castro A (2006) How do intellectual property law and international trade agreements affect access to antiretroviral therapy? PLoS Med 3: e332. doi: 10.1371/journal.pmed.0030332
Citation: Stallman R (2006) Intellectual property and access to ART: Unwise choice of terminology. PLoS Med 3(11): e509. doi:10.1371/journal.pmed.0030509
Copyright: © 2006 Richard Stallman. This is an open-access article distributed under the terms of the Creative Commons Attribution License, which permits unrestricted use, distribution, and reproduction in any medium, provided the original author and source are credited.
Funding: The author received no specifi c funding for this article.
Competing Interests: The author has declared that no competing interests exist.
Intellectual Property and Access to ART: Authors’ Reply
We would like to thank Richard Stallman [1] for
emphasizing the distinction between intellectual property law and patent law, which was not fully elucidated in our article (“How Do Intellectual Property Law and International Trade Agreements Affect Access to
Antiretroviral Therapy?”) [2]. However, we don’t feel that this distinction detracts from our overall argument that restrictions placed on medicines in the name of protecting “intellectual property” hurt efforts to expand access to essential medicines throughout the world. It is not so much the specifi c distinctions between patenting and intellectual property that interest us, but general acceptance of the principle that life-saving medicines can be “owned” and kept from those most affl icted by disease—often living in poverty—based on this concept of ownership.
Arachu Castro ([email protected])
Harvard Medical School
Boston, Massachusetts, United States of America
Michael Westerhaus
Brigham and Women’s Hospital
Boston, Massachusetts, United States of America
References
1. Stallman R (2006) Intellectual property and access to ART: Unwise choice of terminology. PLoS Med 3: e509. doi:10.1371/journal.pmed.0030509 2. Westerhaus M, Castro A (2006) How do intellectual property law and
international trade agreements affect access to antiretroviral therapy? PLoS Med 3: e332. doi: 10.1371/journal.pmed.0030332
Citation: Castro A, Westerhaus M (2006) Intellectual property and access to ART: Authors’ reply. PLoS Med 3(11): e510. doi:10.1371/journal.pmed.0030510
Copyright: © 2006 Castro and Westerhaus. This is an open-access article distributed under the terms of the Creative Commons Attribution License, which permits unrestricted use, distribution, and reproduction in any medium, provided the original author and source are credited.
Funding: The authors received no specifi c funding for this article.
Competing Interests: The authors have declared that no competing interests exist.
City Initiative: Baby Steps
to a Better Future
Ramesh Vidavalur
The article on the new initiative for newborn health in India by A. Fernandez and D. Osrin [1] outlines an innovative approach to tackling the alarming global burden of infant mortality. There are currently an estimated 8 million annual deaths within the fi rst month of life [2], the majority of which are in developing countries. Dr. Fernandez rightly focuses on challenges and the possible innovative, yet effective, interventions to improve maternal and infant health.
Historically, it almost took 50 years to reduce the infant mortality rate in India by 50% (151 per 1,000 live births in 1951 to 69 per 1,000 live births in 2001), and the policy makers are optimistic about further decreasing it to 30 per 1,000 live births by 2010. They also hope to reduce the present maternal mortality rate of 4/1,000 to 1/1,000 by the same time [3]. As the majority of reproductive and childhood morbidities and mortalities can be reduced by primary prevention and early intervention strategies, large-scale adaptation of community intervention strategies will be particularly useful in helping the next generation to have a head start in good health, as the expected population in 15–59 age group will massively increase from 519 million to 800 million by 2016 in India [4].
Health spending in India at 6% of gross domestic product is among the highest levels estimated for developing countries. In per capita terms, it is higher than in China, Indonesia, and most African countries, but lower than Thailand. Public spending on health in India has itself declined from 1.3% of gross domestic product in 1990 to 0.9% in 1999. Individual states have cut down health budgets from 7.0% to 5.5%, in spite of the Bhore Committee (a committee on health surveys and development)
recommendation of 15% [5]. The lack of resources,
infrastructure, and awareness can further hinder the balance of health and disease and puts a considerable burden on the poor, rural Indian population.
In recent years, a growing constituency of
nongovernmental organizations have drawn attention to maternal and child health, supplementing government’s relatively recent initiative Child Survival and Safe
Motherhood. As Fernandez et al. rightly point out regarding the demand and supply sides, India is not likely to be in a position to afford institutional care for all births even if this was considered a desirable goal. So the supply side should be strengthened through birth attendants, community education, microlevel organizations, and the effective integration of traditional and modern health-care systems. One of the best ways to do this is through identifying and strengthening nongovernmental organizations that have high motivation, social commitment, sensitivity to poor, fl exibility, and innovativeness. They can mobilize, empower, and increase awareness through their grassroot workers from the communities.
It has been proven in numerous trials that community-based interventions such as home-community-based neonatal care and usage of birth attendants can signifi cantly reduce the infant mortality rate and improve maternal health [6].
At present, India is in the midst of an epidemiological and health transition wherein multiple factors like urbanization
PLoS Medicine | www.plosmedicine.org 2166
and migration, changing lifestyles, and democratic decentralization have an enormous impact on the above issues. Now is the time for governments and policy makers not only to put feasible plans in place with short-term goals, but also to ensure that we have adequate human resources, strong community ownership, improved information dissemination through the media, investment in health systems research, and lastly, a system that will monitor progress towards a healthy future.
Ramesh Vidavalur ([email protected])
University of Connecticut Health Center Farmington, Connecticut, United States of America
References:
1. Fernandez A, Osrin D (2006) The city initiative for newborn health. PLoS Med 3: e339. doi: 10.1371/journal.pmed.0030339
2. Save the Children (2001) State of the world’s newborns. Washington (D. C): Save the Children.
3. Government of India (2001) National population policy. New Delhi: Ministry of Health and Family Welfare.
4. Registrar General of India (2004) Sample Registration System Bulletin. April 2004.
5. Government of India (2003) Planning Commission report.
6. Bang AT, Bang RA (2005) Background of the fi eld trial of home-based neonatal care in Gadchiroli, India. J Perinatol 25: s3–s10.
Citation: Vidavalur R (2006) City initiative: Baby steps to a better future. PLoS Med 3(11): e505. doi:10.1371/journal.pmed.0030505
Copyright: © 2006 Ramesh Vidavalur. This is an open-access article distributed under the terms of the Creative Commons Attribution License, which permits unrestricted use, distribution, and reproduction in any medium, provided the original author and source are credited.
Funding: The author received no specifi c funding for this article.
Competing Interests: The author has declared that no competing interests exist.
Conjunctival
FOXP
3in Trachoma:
T Cells Not Specifi ed
Michael Probst-Kepper
The article by Faal et al. [1] describes differences in the level of FOXP3 mRNA expression in the conjunctiva of patients with Chlamydia trachomatis infection. The authors suggest that their results may indicate a role for regulatory T cells in the resolution of conjunctival immune response, since FOXP3
mRNA remained elevated even if clinical disease signs were present in the absence of infection.
But suggestions about the function of regulatory T cells in diseases based only on the quantifi cation of FOXP3 mRNA should be considered with great caution. According to the current state-of-the-art it is well established that FOXP3 does not specify human regulatory T cells since it is expressed at the mRNA and the protein levels to different extents [2–5]. Thus, without quantifi cation of FOXP3 protein at the single cell level in conjunction with reliable markers of human regulatory T cells, e.g., the recently identifi ed lack of
CD127 expression on regulatory T cells [6,7], the potential contribution or association of regulatory T cells with a disease cannot be assessed.
Michael Probst-Kepper ([email protected])
Hannover Medical School Hannover, Germany
References:
1. Faal N, Bailey RL, Jeffries D, Joof H, Sarr I, et al. (2006) Conjunctival FOXP3 expression in trachoma: Do regulatory T cells have a role in human
ocular Chlamydia trachomatis infection? PLoS Med 3: e266. doi:10.1371/ journal.pmed.0030266
2. Ziegler SF (2006) FOXP3: Of mice and men. Annu Rev Immunol 24: 209–226.
3. Gavin MA, Torgerson TR, Houston E, DeRoos P, Ho WY, et al. (2006) Single-cell analysis of normal and FOXP3-mutant human T cells: FOXP3 expression without regulatory T cell development. Proc Natl Acad Sci U S A 103: 6659–6664.
4. Ocklenburg F, Moharregh-Khiabani D, Geffers R, Janke V, Pfoertner S, et al. (2006) UBD, a downstream element of FOXP3, allows the identifi cation of LGALS3, a new marker of human regulatory T cells. Lab Invest 86: 724–737.
5. Mantel PY, Ouaked N, Ruckert B, Karagiannidis C, Welz R, et al. (2006) Molecular mechanisms underlying FOXP3 induction in human T cells. J Immunol 176: 3593–3602.
6. Seddiki N, Santner-Nanan B, Martinson J, Zaunders J, Sasson S, et al. (2006) Expression of interleukin (IL)-2 and IL-7 receptors discriminates between human regulatory and activated T cells. J Exp Med 203: 1693-1700. 7. Liu W, Putnam AL, Xu-Yu Z, Szot GL, Lee MR, et al. (2006) CD127
expression inversely correlates with FoxP3 and suppressive function of human CD4+ T reg cells. J. Exp Med 203: 1701–1711.
Citation: Probst-Kepper M (2006) Conjunctival FOXP3 in trachoma: T cells not
specifi ed. PLoS Med 3(11): e506. doi:10.1371/journal.pmed.0030506
Copyright: © 2006 Michael Probst-Kepper. This is an open-access article distributed under the terms of the Creative Commons Attribution License, which permits unrestricted use, distribution, and reproduction in any medium, provided the original author and source are credited.
Funding: The author received no specifi c funding for this article.
Competing Interests: The author has declared that no competing interests exist.
Health Development versus Medical
Relief: The Illusion of Aid
Maria Rubio, Jose Luis Portero
Gorik Ooms sheds light on the controversial use of the concept of sustainability by development agencies [1]. International organizations involved in foreign aid and local governments support health policies that decrease the size, the potential, and the budget of the public health sector and hamper the access to health through fee-for-service systems. Under the so-called Health Sector Reform Agenda, out-of-pocket charges make unsustainable the cost of health care for the poorest. Health insurance systems have a minor effect on the health of the poor, either because the system generates permanent barriers to access health care or the services are not really functioning. It is debatable whether a complex instrument, such as health insurance, can be valuable in societies with depleted governmental funds, rundown health services, and a high index of poverty and inequity. So, free health care is the only affordable and sustainable option for the poorest.
On the other hand, Médecins Sans Frontières (MSF) fosters the illusion of independent aid in a vast world full of necessities, makes irrelevant political views through the fl ag of neutrality, and digests the lecture of confl icts for the taste of the white man’s tears. MSF knows that their projects, as most of the projects, are not sustainable and therefore rejects sustainability as an argument to act. But MSF is concerned about sustainability as the organization calls for stronger national commitment and more international aid for health through emergency development. Behind the oratory, MSF assumes that the governments have the power for an appropriate answer.
Sustainability cannot be analyzed alone. Community development, grassroots democracy, social justice, human rights, humanitarianism, or empowerment are the conceptual
PLoS Medicine | www.plosmedicine.org 2167
ideas that back the illusion of aid in the Western civil society. They are rhetorical terms that could even sound radical but, paradoxically, due to their apolitical approaches, make international aid and cooperation harmless for governments and policies that generate injustice. Moreover, postmodernism appeals for individual attention and marginalizes collective political actions that could have greater impact.
Solomon R. Benatar wrote in this journal that poor health refl ects systemic dysfunction in a complex world and calls the attention to address the complex system forces that sustain poverty and poor health [2]. We are far from addressing these complex system forces that themselves remain, unfortunately, in good health. At the end, we might need politics rather than the illusion of independent aid.
Maria Rubio ([email protected])
Jose Luis Portero
Madrid, Spain
References
1. Ooms G (2006) Health development versus medical relief: The illusion versus the irrelevance of sustainability. PLoS Med 3: e345. doi:10.1371/ journal.pmed.0030345
2. Benatar SR (2005) Moral imagination: The missing component in global health. PLoS Med 2: e400. doi:10.1371/journal.pmed.0020400
Citation: Rubio M, Portero JL (2006) Health development versus medical relief: The illusion of aid. PLoS Med 3(11): e507. doi:10.1371/journal.pmed.0030507
Copyright: © 2006 Rubio and Portero. This is an open-access article distributed under the terms of the Creative Commons Attribution License, which permits unrestricted use, distribution, and reproduction in any medium, provided the original author and source are credited.
Funding: The authors received no specifi c funding for this article.
Competing Interests: The authors have declared that no competing interests exist.
Health Development versus Medical
Relief: Not a Turf Battle
Guy-André Pelouze
Médecins Sans Frontières is a respectable organisation which helps people in jeopardy and provides medical relief in diffi cult situations all over the world. Despite this recognition I must confess I found the last paper of G. Ooms in PLoS Medicine [1] to develop highly debatable concepts about health, development, and even sustainability. Ooms postulates that sustainable intervention creates a bias for development agencies to maintain the status quo.
On the other hand, it could very easily be argued that conventional emergency “humanitarian aid” has failed to improve health on even a medium-term basis in the last four decades. Common sense indicates that populations benefi t more from improvements in wealth, water supply, and agriculture than from consuming free goods from international aid.
Several studies provide a basis for this conclusion [2]. On the contrary, a persistent status quo could result from an exclusive humanitarian approach, precluding the necessary changes to develop health care.
International agencies say that, based on numerous studies, improving health on a medium- or long-term basis is a matter of “sustainable” programmes. But what is meant by “sustainability”? It seems that Dr. Ooms interprets
sustainability as durability, a confusion which is obvious when one reads the French version of his paper. Durability is a plain matter of time; pollution, totalitarian regimes, or poverty could as well, unfortunately, meet a single durability criterion. This is the main point, if one wants to assess the criticism which Ooms aims at development agencies. Their main objective is to assess the sustainability of the health programmes which means (in French the supportabilité
and not the durabilité) whether these programs exceed the economic, organisational, and ecological possibilities of the country and its population. And I recognize that I am in keeping with that! To give rice to people who usually consume rice is helpful, but next time it will be even more helpful to give them the means to grow their own!
Yet the reality is far more complex, something which requires that agencies carefully assess the different
programmes [3]. I must add that such an approach does not preclude an increase in annual governments outlays. But before increasing expenditure, it is wise to assess whether the programmes is working, and for whom. I don’t miss the point that sustainable aid is for certain governments synonymous with conditional aid, and such diffi culties must not be hidden, but every one of us is able to make the distinction between the principle and some penny-pinching, restrictive policies which can be amended and reversed.
Indeed, the two approaches are complementary. When an emergency situation arises, it is obvious that some of the critical health issues of the local populations could be addressed by emergency international aid. But after a few weeks, only structural and political changes (that is, peace, convenient water supply, agriculture revival, affordable energy, information, free trade, free enterprise through microrenting...) are crucial for maintaining health and eventually improving it. As a matter of fact it could be a more dangerous illusion for these endangered populations to give credit to the ideas that Dr. Ooms develops in order to justify the spending of more public funds to extend emergency humanitarian aid indefi nitely.
Guy-André Pelouze ([email protected])
St. John Hospital Perpignan, France
References
1. Ooms G (2006) Health development versus medical relief: The illusion versus the irrelevance of sustainability. PLoS Med 3: e345. doi:10.1371/ journal.pmed.0030345
2. Organisation for Economic Co-Operation and Development (2004) Statement adopted by members of the OECD’s Development Assistance Committee (DAC). Available: http:⁄⁄www.oecd.org/ dataoecd/42/26/31505731.pdf. Accessed 27 October 2006.
3. Culpeper R (2005) Human security, sustainable and equitable development: Foundations for Canada’s international policy. Canadian International Development Agency. Available: http:⁄⁄www.nsi-ins.ca/english/pdf/ IPR_english.pdf. Accessed 27 October 2006.
Citation: Pelouze GA (2006) Health development versus medical relief: Not a turf battle. PLoS Med 3(11): e508. doi:10.1371/journal.pmed.0030508
Copyright: © 2006 Guy-André Pelouze. This is an open-access article distributed under the terms of the Creative Commons Attribution License, which permits unrestricted use, distribution, and reproduction in any medium, provided the original author and source are credited.
Funding: The author received no specifi c funding for this article.
Competing Interests: The author has declared that no competing interests exist.
PLoS Medicine | www.plosmedicine.org 2168
Spinal Delivery of p38: TNF-alpha
Inhibitors
Edward Tobinick
The new study by Boyle and colleagues provides important data on basic science mechanisms involved in pain and infl ammation [1]. Their data, along with that from previous studies, provides further basic scientifi c evidence documenting p38–TNF-alpha interactions, and suggests that spinal p38 or spinal TNF-alpha blockade may have clinical relevance [1,2]. The present study documents that p38 activation may be occurring predominantly in microglia. The present study, therefore, joins other recent work which suggests the importance of p38-glial-TNF-alpha interactions in neuroinfl ammation and synaptic signaling [3–6]. This increasing evidence may have clinical relevance not only to arthritis pain, but also to the pathogenesis of various forms of neuropathic pain and Alzheimer disease [1–8].
Because the present study suggests that spinal delivery may be more effective than systemic delivery when attempting to intervene in spinally-mediated infl ammatory mechanisms, the authors note the potential importance of developing compounds that may bypass the blood-brain barrier. The present author speculates that the rapid and signifi cant clinical effects noted following perispinal administration of etanercept in small pilot studies suggest that perispinal administration of p38 inhibitors may also allow these compounds to reach the spinal cord and dorsal root ganglia in therapeutically effective amounts [7,8]. It is hypothesized that this may be possible via passage through the vertebral portion of the cerebrospinal venous system, and this may explain the effi cacy of perispinal etanercept in the above cited studies [7–9]. Previous studies have documented that epidural administration of large molecules may result in delivery to the endoneurial space [10]. This evidence, along with the basic scientifi c evidence provided by the present study of the potential clinical importance of spinal delivery, supports consideration of investigation of this novel route of administration.
Edward Tobinick ([email protected])
Institute for Neurological Research
Los Angeles, California, United States of America
References
1. Boyle DL, Jones TL, Hammaker D, Svensson CI, Rosengren S, et al. (2006) Regulation of peripheral infl ammation by spinal p38 MAP kinase in rats. PLoS Med 3: e338. doi:10.1371/journal.pmed.0030338
2. Schafers M, Svensson CI, Sommer C, Sorkin LS (2003) Tumor necrosis factor-alpha induces mechanical allodynia after spinal nerve ligation by activation of p38 MAPK in primary sensory neurons. J Neurosci 23: 2517– 2521.
3. Culbert AA, Skaper SD, Howlett DR, Evans NA, Facci L, et al. (2006) MAPK-activated protein kinase 2 defi ciency in microglia inhibits pro-infl ammatory mediator release and resultant neurotoxicity: Relevance to neuroinfl ammation in a transgenic mouse model of Alzheimer disease. J Biol Chem 281: 23658–23667.
4. Takeuchi H, Jin S, Wang J, Zhang G, Kawanokuchi J, et al. (2006) Tumor necrosis factor-alpha induces neurotoxicity via glutamate release from hemichannels of activated microglia in an autocrine manner. J Biol Chem 281: 21362–21368.
5. Stellwagen D, Malenka RC (2006) Synaptic scaling mediated by glial TNF-alpha. Nature 440: 1054–1059.
6. Sommer C, Schafers M, Marziniak M, Toyka KV (2001) Etanercept reduces hyperalgesia in experimental painful neuropathy. J Peripher Nerv Syst 6: 67–72.
7. Tobinick E, Gross H, Weinberger A, Cohen H (2006) TNF-alpha modulation for treatment of Alzheimer’s disease: A 6-month pilot study. MedGenMed 8: 25.
8. Tobinick EL, Britschgi-Davoodifar S (2003) Perispinal TNF-alpha inhibition for discogenic pain. Swiss Med Wkly 133: 170–177.
9. Tobinick E (2006) The cerebrospinal venous system: Anatomy, physiology, and clinical implications. MedGenMed 8: 53.
10. Byrod G, Rydevik B, Johansson BR, Olmarker K (2000) Transport of epidurally applied horseradish peroxidase to the endoneurial space of dorsal root ganglia: A light and electron microscopic study. J Peripher Nerv Syst 5: 218–226.
Citation: Tobinick E (2006) Spinal delivery of p38: TNF-alpha inhibitors. PLoS Med 3(11): e511. doi:10.1371/journal.pmed.0030511
Copyright: © 2006 Edward Tobinick. This is an open-access article distributed under the terms of the Creative Commons Attribution License, which permits unrestricted use, distribution, and reproduction in any medium, provided the original author and source are credited.
Funding: The author received no specifi c funding for this article.
Competing Interests: The author has pending and issued US and international patents, including US patents 6,015,557; 6,982,089; and others, which describe methods of perispinal administration of etanercept. The author also owns stock in Amgen.
![Figure 1. Patterns of Timing (A) and Spread (B) of 30 Infl uenza Epidemics in the US, Together with Trends in Air Travel Statistics Infl uenza patterns are based on weekly national vital statistics from 1972 to 2002 [5]](https://thumb-eu.123doks.com/thumbv2/123dok_br/17300587.248592/1.891.457.823.99.364/figure-patterns-epidemics-travel-statistics-patterns-national-statistics.webp)