Analysis
Xizeng Mao1., Yu Zhang3,4., Ying Xu1,2,3
*
1Computational Systems Biology Lab, Department of Biochemistry and Molecular Biology, Institute of Bioinformatics, University of Georgia, Athens, Georgia, United States of America,2BioEnergy Science Center BESC, University of Georgia, Athens, Georgia, United States of America,3College of Computer Science and Technology, Jilin University, Changchun, China,4Key Laboratory of Symbolic Computation and Knowledge Engineering of the Ministry of Education, Jilin University, Changchun, China
Abstract
Pathway enrichment analysis represents a key technique for analyzing high-throughputomicdata, and it can help to link individual genes or proteins found to be differentially expressed under specific conditions to well-understood biological pathways. We present here a computational tool, SEAS, for pathway enrichment analysis over a given set of genes in a specified organism against the pathways (or subsystems) in the SEED database, a popular pathway database for bacteria. SEAS maps a given set of genes of a bacterium to pathway genes covered by SEED through gene ID and/or orthology mapping, and then calculates the statistical significance of the enrichment of each relevant SEED pathway by the mapped genes. Our evaluation of SEAS indicates that the program provides highly reliable pathway mapping results and identifies more organism-specific pathways than similar existing programs. SEAS is publicly released under the GPL license agreement and freely available at http://csbl.bmb.uga.edu/,xizeng/research/seas/.
Citation:Mao X, Zhang Y, Xu Y (2011) SEAS: A System for SEED-Based Pathway Enrichment Analysis. PLoS ONE 6(7): e22556. doi:10.1371/journal.pone.0022556
Editor:Vladimir Brusic, Dana-Farber Cancer Institute, United States of America
ReceivedMarch 18, 2011;AcceptedJune 24, 2011;PublishedJuly 22, 2011
Copyright:ß2011 Mao et al. This is an open-access article distributed under the terms of the Creative Commons Attribution License, which permits unrestricted use, distribution, and reproduction in any medium, provided the original author and source are credited.
Funding:This work was supported in part by the National Science Foundation (DBI-0542119, DEB-0830024 and MCB-0958172), the Chinese National Science Foundation (11001106) and the DOE BioEnergy Science Center grant (DE-PS02-06ER64304), which is supported by the Office of Biological and Environmental Research in the Department of Energy Office of Science. The funders had no role in study design, data collection and analysis, decision to publish, or preparation of the manuscript.
Competing Interests:The authors have declared that no competing interests exist.
* E-mail: [email protected]
.These authors contributed equally to this work.
Introduction
High-throughputomic techniques are being increasingly more widely used by large research centers as well as by individual labs because of the rapidly decreasing costs and the increasing quality of the data generated. The rapid accumulation of theomicdata has provided unprecedented new opportunities for biologists to study substantially more complex problems at a systems level [1,2] than just a few years ago. As a key technique in linking individual genes/proteins to biological processes, pathway enrichment analy-sis is being widely used to study pathway-level activities based on the activities of individual genes/proteins observed using omic
techniques [3,4]. A number of computational tools have been developed to provide pathway enrichment analyses against dif-ferent pathway databases. As of now, the majority of the existing tools have been designed for pathway analyses for human or eukaryotes in general, including ArrayXPath [5], GenMAPP [6], DAVID [7], PathwayExplorer [8], PathExpress [9] and Pathway Miner [10]. Among all these analysis tools, gene mapping from a specified organism to the pathway genes covered by the underlying (pathway) database is typically done through gene ID [5,6,7] or orthology mapping [11,12]. A pathway is considered as enriched by a set of genes if they overlap the pathway at a substantially higher percentage of the pathway genes than expected by chance. Statistical enrichment analysis methods fall into three classes according to enrichment algorithms [13]: (i) singular enrichment analysis (SEA), which calculates an enrichment P-value on each pathway and lists the enriched pathways in a linear table based on
the hyper-geometric distribution assumption [14] or using Fisher exact test [15,16] among a few other methods [17] [18]; (ii) gene set enrichment analysis [19], which considers an entire gene set (without pre-selection) encoded in a genome and associated experimental values (for instance expression fold change); and (iii) modular enrichment analysis [20], which uses the key idea of SEA but considers pathway-pathway or gene-gene relations in its enrichment P-value calculation. In this paper, we will use the SEA method because of its simplicity and popularity, and may consider the other two classes of enrichment analysis methods in our future work.
that its coverage might not be as high as KEGG pathways. For example, the KEGG pathways cover 2,983 E. coli genes while SEED covers only 2,181 while exceptions exist. For instance, KEGG covers 2,296B. subtilisgenes while SEED covers 2,303.
We have previously developed a software tool KOBAS [11] for enrichment analyses of KEGG pathways, which has been widely used since its publication [25]. Here we present a new tool for enrichment analyses against SEED subsystems, called SEAS (SEED-basedEnrichmentAnalysisSystem). SEAS provides three ways for gene mapping to subsystems through gene ID, orthology or homology mapping based on the availability of the relevant information, and identifies the statistically enriched pathways in SEED. We have extensively tested the performance of SEAS by re-annotating known pathways ofE. coliandB. subtilisin SEED, and found that the mapped pathways are highly reliable, achieving 79% precision and 95% coverage forE. coli and 66% precision and 74% coverage forB. subtilis. Our additional evaluation results on microarray data and newly sequenced genome suggest that SEAS can identify more organism-specific pathways than KEGG-based pathway annotation. To the best of our knowledge, SEAS is the first software for SEED pathway enrichment analysis.
Results and Discussion
The workflow of SEAS consists of two main steps as shown in Figure 1: (a) it first maps the query genes to SEED subsystems based on sequence similarity search or ID mapping; and (b) it then compares the ratio of the query genes out of all the genes in each mapped subsystem versusthe ratio of the query genes out of the whole gene set of the query genome or some other background ratio prepared by the user, and identifies significantly enriched subsystems.
Gene mapping to pathways by multiple strategies
Mapping the query genes to pathways involves searching the well-annotated gene database in SEED that currently has 1,414 organisms. We have implemented three strategies in SEAS, one of which will be used depending on the availability of the relevant information. When the query genes are already in SEED, we will use the original (pathway) annotation in SEED directly if the SEED ID is available for the query or through ID mapping using the NCBI GI number as the universal ID. When the genes are not covered but have available genome in SEED, we will use the mapping results between the query genes and the pathway genes in SEED given by the official RAST server using Bi-Directional Best Hit (BDBH) [26], or use the mapping results by our own P-MAP program [27] when operons for the query genome are available. P-MAP uses both high sequence similarity and operon information for orthologous gene mapping, and hence tend to make the mapping results more accurate than BDBH when it is applicable. When neither of these two methods provides useful mapping results, which could be true for partially sequenced genomes and meta-genomes, we use NCBI BLAST (blastp for DNA,blastx for protein) (see Material and Methods on E-value cutoff), to compare the query genes/proteins against one or more reference genomes in SEED specified by the user, in which we select the top hit with known annotation in SEED. The SEAS program provides the option for the user to choose one of the options to do gene mapping.
The first two strategies have been well evaluated in the original papers on SEED [24], RAST [26] and P-MAP [27] so we focus on the assessment of the third strategy. Specifically, we will re-annotate the pathways ofE. coliandB. subtilis(already in SEED) based on SEED pathways encoded by other genomes (as references). The annotation is quite time-consuming if all genomes in SEED are used as references, but the coverage could be low if only one is used considering the reference genome may not be evolutionarily close enough to contribute useful annotation templates. To balance the annotation performance and coverage, our idea is to combine some reprehensive genomes for each group of reference genomes having similar evolutional distances to the query genome. To assess this idea, we have evaluated different combinations of reference genomes in an iterative manner (Figure 2 and 3) based on the taxonomic distance, defined as the number of nodes in the path from the query organism to its closest common ancestor with its reference organism in the taxonomy tree defined in the KEGG Genome database (see Figure 2A and 3A). Based on the taxonomic distance, we have designed the following three strategies: the single genome strategy, which selects only one reference genome from SEED every time, but with different distance each time (see Figure 2B and 3B);multiple genome strategy #1, which starts with a genome in SEED having the smallest taxonomic distance to the query genome and iteratively adds the next closest genome each time until K genomes have been selected for a user selected K.0 (see Figure 2C and 3C); and
multiple genome strategy#2, which starts from the farthest genome in SEED to the query genome and iteratively adds the next farthest genome each time until K genomes have been selected, trying to cover the best studied genomes as references, which could be close or distant. We compared the SEAS-based re-annotation results against the original pathway annotation of the two organisms in SEED using the following measures:
Precision~ TP
TPzFP, andCoverage~ TP
TPzFN,
where TP (true positive) is the number of the genes for which the
Figure 1. A schematic representation of the SEAS workflow. Each rectangle represents a program, each cylinder represents a data-base, and the others are flat text files for input, output or intermediate results.
SEAS-based annotation is the same as the original SEED annotation, FP (false positive) is the number of the genes for which the SEAS-based annotation is different from the original SEED annotation, and FN (false negative) is the number of genes in the genome with SEED annotations but not SEAS annotations. We observed from Figures 2 and 3 that (i) more closely related genomes generally provide more information for pathway annotation as expected (Figure 3B) although exceptions may exist such as S. enterica provides more information than Y. pestis for annotation ofE. colipathways possibly becauseS. enterica(55% of 4,737 genes are annotated) has more annotated genes thanY. pestis
(51% of 5,125 genes are annotated) (Figure 2B); (ii) multiple genomes always provide more pathway-annotation information than individual genomes, also as expected; (iii) multiple genome strategy#1 generally gives rise to more information for pathway annotation than multiple genome strategy#2 (Figure 2C, 2D, 3C and 3D); and (iv) multiple genomes, when used in conjunction with their taxonomic distance information, have the best pathway annotation performance, achieving 55% precision and 90% coverage forE. coliand 66% precision and 74% coverage forB. subtilisFor this case, 10% of original annotations forE. coli and 26% forB. subtilisare missed by SEAS (see Table S1). The missing subsystems include arabinose utilization, DNA replication, syn-thesis of aromatic compounds, DNA repairs for E. coli, and transporter, pyridoxine regulon, and spore coat, DNA repair forB. subtilis. Our explanation is that these subsystems do not have annotated equivalent subsystems in the reference genomes.
Overall, homology search against multiple reference genomes with a wide range of different taxonomic distances generally give rise to generally good pathway annotation and can partially overcome the issue that homology search against one reference genome often leads to mapping to paralogs rather than orthologs.
Pathway enrichment with statistic test
We have employed four statistic methods for pathway enrichment analysis, and a user can choose one as we have done with the KOBAS software [25], each of which tests whether a given gene set overlaps with a specific pathway substantially more considerably than by chance. Specifically, the four methods are hyper-geometry test, binomial test,x2test, and Fisher exact test.
The hyper-geometric test requires that the input include a subset of the background annotation. Ifx2test is unreliable (e.g., with expected frequencies ,5), SEAS will automatically switch to Fisher’s exact test. The binomial test is the fastest method when the number of sequences is large [25]. We have also implemented a correction procedure for thefalse discovery rate(FDR) usingmulttest
(2.8.0) provided in the R package [28], knowing that multiple hypothesis tests (one test per pathway) in each analysis performed could result in high false positive errors (see Methods and Material).
We have evaluated our pathway enrichment analysis using a gene set ofE. coli, consisting of 42 differentially expressed genes with fold change$2 or#0.5 in the E. coli ackAmutant (able to produce acetyl phosphate but not metabolize it) in comparison
Figure 2. SEAS-based re-annotation ofE. colipathways using 11 reference genomes.(A) Taxonomic distance between reference genomes andE. coli. The first column represents the reference genomes, used in thex-axis in (B)–(D); (B) Re-annotation ofE. colipathways using thesingle genome strategy; (C) Re-annotation ofE. colipathways using themultiple genome strategy#1; (D) Re-annotation ofE. colipathways using themultiple genome strategy#2.
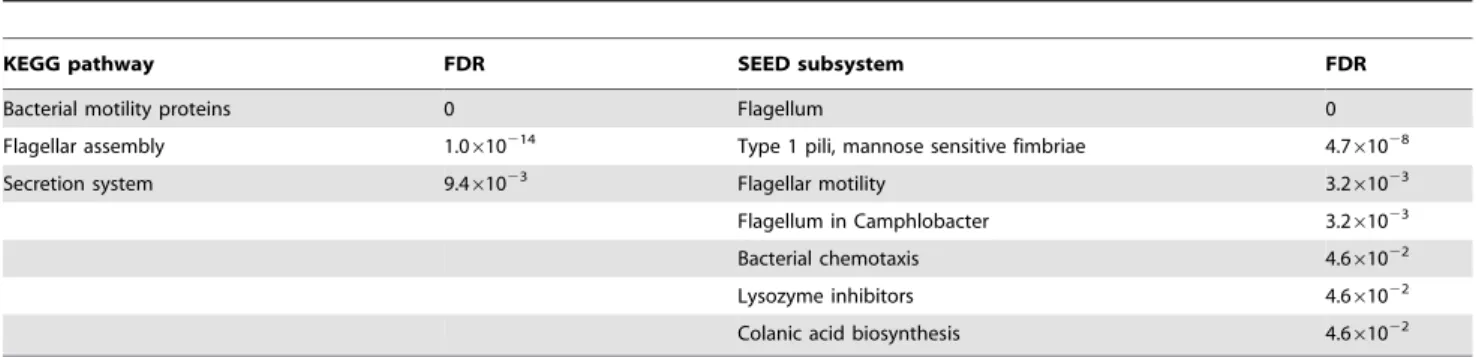
with the E. coli pta-ackA mutant (unable to produce acetyl phosphate) [18]. We used the hyper-geometric test for the enrichment analyses of the SEAS and KOBAS programs. Among the 42 genes, 22 are found in the enriched KEGG pathways and 24 in the enriched SEED pathways. Seven SEED pathways are identified to be significantly enriched by SEAS, as shown in Table 1, while three KEGG pathways are identified to be enriched by KOBAS [11] (see Table S2). Overall, the results from SEAS and KOBAS are generally consistent with the result of the original study: flagella related genes play an important role in theE. coli pta-ackAmutantversus ackAmutant [18,29]. SEAS generally gives more detailed information than KOBAS-based pathway annota-tion due to the nature of the SEED pathways, as in the case of type 1 pili mannose sensitive fimbriae, named as a secretion system by KEGG. Compared to KOBAS, SEAS identified three enriched pathways that KOBAS did not identify, namely colanic acid biosynthesis associated with cell adhesion [30] and lysozyme inhibitors associated with cell wall synthesis [31] without missing any significant KEGG pathways. Notably, SEAS identified b1922 as thes28factor, a minor sigma factor responsible for initiation of
transcription at a number of genes involved in motility [32], while KOBAS annotates it as motility proteins and RNA polymerase, which suggests that the mutation ofptaandackAaffect the activity ofs28factor and thus regulates the expression of the genes related
with flagellum and flagellar motility (see Table S2).
We have also compared the pathway annotation performance by the two programs on a newly sequenced genome,N. profundicola
[33] usingE. coli pathways in KEGG and SEED as references, respectively (using FDR#0.05 as cutoffs). 14 out of 147 (covering 1,053 genes) KEGG pathways are enriched forN. profundicolaand 46 out of 225 (covering 856 genes) SEED pathways are enriched, as shown in Table S3. We noted that the pathways related to ribosome, tRNA biosynthesis, transcription factor, ABC trans-porter, cell motility, flagella, are enriched in both KEGG and SEED. Overall, SEAS identified 31 significant pathways that the KOBAS did not identify, including folate biosynthesis, fatty acid biosynthesis, chorismate synthesis, selenocysteine metabolism, DNA repair, biotin synsthesis, histidine biosynthesis, riboflavin to FAD, purine biosynthesis, which is consistent with the conclusions in the paper [33]; while it missed six significant pathways identified by KOBAS (see Table S3). Overall SEAS and KOBAS are clearly complementary to each other as expected based on the com-plementary nature of their underlying pathway databases.
Software design and implementation
The SEAS system consists of two main steps: pathway annotation and enrichment analysis, each of which can be run through a command-line,annotateand pathfind, respectively. The program is implemented using the Mono cross platform (http://www.mono-project.com), open source.NET development
Figure 3. SEAS-based re-annotation ofB. subtilispathways using 11 reference genomes.(A) Taxonomic distance between reference genomes andB. subtilis. The first column represents the reference genomes, which are used in thex-axis in (B)–(D); (B) Re-annotation ofB. subtilis pathways using thesingle genome strategy; (C) Re-annotation ofB. subtilispathways using themultiple genome strategy#1; (D) Re-annotation of B.subtilispathways using themultiple genome strategy#2.L. sphaericusis very low in panel B at position 4 on thex-axis as it has no pathway annotation information.
platform, which can run on Windows, Linux and Mac OS X. All the programs are well documented, which can be quickly accessed by the ‘-h’ option. SEAS is released under the GNU General Public License (GPL), and the program along with related data are freely available at http://csbl.bmb.uga.edu/,xizeng/research/
seas/.
SEAS runs very fast for ID-mapping based pathway annotation and pathway enrichment analysis; the only slow step of the system is the BLAST search, which takes about 1.5 hours with a single reference genome and 8.5 hours with 10 reference genomes for pathway (re)annotation ofE. colion a Linux workstation (6 CPUs and 8G memory). To support large-scale pathway annotation, SEAS also accepts outputs from BLAST using the (-i blastout) option, making the program very fast if the BLAST results are done in advance.
If the user has a list of protein sequences (fasta format), a typical session of pathway enrichment analysis is as follows:
1. Pathway annotation of the given list of proteins: seas.exe annotate –b blastp –i fasta –o ‘‘Escherichia coli,Bacillus subtilis’’ –f example.fasta.example.annotations, where -b
specifies the BLAST program (blastp for protein sequence and blastx for DNA sequences),-ifor the input format,-ofor reference genome(s),-ffor the input and ‘‘.example.annotations’’ specifies the output.
2. Pathway enrichment analysis with the wholeE. coligenome as background: seas.exe pathfind –m hyper -1 example.ann -2 ‘‘Escherichia coli’’ .example.pathways, where -m specifies statistical method (hyper for hyper-geometric test, binom for binomial test, chisq for Chi Square test and fisher for Fisher Exact test), -1 for sample annotation file from the above step and -2 specifies background annotation file, with built-in whole genome by species name or from the above step.
Conclusion
We have developed a new pathway enrichment analysis system, SEAS, for prokaryotes, which maps a given set of genes to SEED pathways along with a statistical significance assessment. Our evaluation result showed that SEAS-based pathway annotations tend to provide more reliable pathway predictions with slightly smaller coverage compared to a KEGG-based pathway enrich-ment tool KOBAS, hence it provides a new pathway enrichenrich-ment tool complementary to KOBAS. We anticipate that the perfor-mance by SEAS will continue to improve as the coverage of SEED pathways continues to increase rapidly. As the only available tool specifically designed for SEED pathway enrichment analysis in the
public domain, we believe that SEAS will add to the value of the SEED database, which is now being widely used by bacteriologists.
Materials and Methods
Data
The genome sequences and relevant annotations were down-loaded from ftp://ftp.ncbi.nih.gov/genomes/Bacteria on 12/30/ 2010. The SEED database was downloaded from ftp://ftp. theseed.org/genomes/SEED on 12/30/2010. The KEGG data-base was downloaded from ftp://ftp.genome.jp/pub/kegg/genes/ organisms on 12/30/2010.
Pathway mapping from multiple reference genomes
When the query genes are not in SEED but have the sequence information, SEAS can annotate them by using the RAST server [26] or the P-Map program [27] when the whole genome is available; otherwise, SEAS annotates them based on sequence-similarity homology search against multiple reference genomes already in SEED. Specifically, SEAS does sequence similarity search for each query gene against the reference genome(s) using NCBI BLAST (blastp for protein and blastx for DNA), and selects the best hit as its mapped orthologous gene if (i) its BLAST E-value#1025; (ii) itsE-valueranks among the top five hits (Rank#5); and (iii) the gene has pathway information in SEED. If the user specifies multiple reference genomes, SEAS merges them into a single ‘‘genome’’ using the NCBI BLAST program and then applies the aforementioned algorithm for the subsequent pathway annotation. We have implemented a Ruby (http://ruby-lang.org) script to help select multiple reference genomes that are diverse in taxonomic distances. The script selects the organism out of those with the same taxonomic distance that has the most similar number of genes to that of the query genome. Currently the default value for the number of multiple reference genomes is set to be ten to ensure our aforementioned re-annotation result on the two genomes have the best precision and coverage (see Figure 2C and 3C), which can be changed by the user. The script can be freely downloaded from http://csbl.bmb.uga.edu/,xizeng/
research/seas/.
Enrichment analysis with statistic test
The statistic test methods are implemented as a separate R (http://www.r-project.org) script that is easy to extend with new methods and that to do enrichment analysis with other pathway databases outside of SEAS. The script is integrated seamlessly into the SEAS program.
Table 1.Comparison between pathway enrichment analyses by KEGG- and SEED-based predictions.
KEGG pathway FDR SEED subsystem FDR
Bacterial motility proteins 0 Flagellum 0
Flagellar assembly 1.0610214 Type 1 pili, mannose sensitive fimbriae 4.7
61028
Secretion system 9.461023 Flagellar motility 3.261023
Flagellum in Camphlobacter 3.261023
Bacterial chemotaxis 4.661022
Lysozyme inhibitors 4.661022
Colanic acid biosynthesis 4.661022
Supporting Information
Table S1 Missing annotations of E. coli and B. subtilis. (XLS)
Table S2 Significant pathways in two E. coli mutants.
(XLS)
Table S3 Comparison of pathway enrichment analysis on the genome ofN. profundicola.
(XLS)
Acknowledgments
We thank all the members of the CSBL Lab at UGA and the Intelligence Engineering Lab at Jilin University of China.
Author Contributions
Conceived and designed the experiments: YX XM. Performed the experiments: XM YZ. Analyzed the data: XM YZ. Wrote the paper: XM YX.
References
1. Metzker ML (2010) Sequencing technologies - the next generation. Nat Rev Genet 11: 31–46.
2. Git A, Dvinge H, Salmon-Divon M, Osborne M, Kutter C, et al. (2010) Systematic comparison of microarray profiling, real-time PCR, and next-generation sequencing technologies for measuring differential microRNA expression. RNA 16: 991–1006.
3. Li CY, Mao X, Wei L (2008) Genes and (common) pathways underlying drug addiction. PLoS Comput Biol 4: e2.
4. Shi YH, Zhu SW, Mao XZ, Feng JX, Qin YM, et al. (2006) Transcriptome profiling, molecular biological, and physiological studies reveal a major role for ethylene in cotton fiber cell elongation. Plant Cell 18: 651–664.
5. Chung HJ, Park CH, Han MR, Lee S, Ohn JH, et al. (2005) ArrayXPath II: mapping and visualizing microarray gene-expression data with biomedical ontologies and integrated biological pathway resources using Scalable Vector Graphics. Nucleic Acids Res 33: W621–626.
6. Salomonis N, Hanspers K, Zambon AC, Vranizan K, Lawlor SC, et al. (2007) GenMAPP 2: new features and resources for pathway analysis. BMC Bioinformatics 8: 217.
7. Dennis G, Jr., Sherman BT, Hosack DA, Yang J, Gao W, et al. (2003) DAVID: Database for Annotation, Visualization, and Integrated Discovery. Genome Biol 4: P3.
8. Mlecnik B, Scheideler M, Hackl H, Hartler J, Sanchez-Cabo F, et al. (2005) PathwayExplorer: web service for visualizing high-throughput expression data on biological pathways. Nucleic Acids Res 33: W633–637.
9. Goffard N, Frickey T, Weiller G (2009) PathExpress update: the enzyme neighbourhood method of associating gene-expression data with metabolic pathways. Nucleic Acids Res 37: W335–339.
10. Pandey R, Guru RK, Mount DW (2004) Pathway Miner: extracting gene association networks from molecular pathways for predicting the biological significance of gene expression microarray data. Bioinformatics 20: 2156–2158. 11. Mao X, Cai T, Olyarchuk JG, Wei L (2005) Automated genome annotation and pathway identification using the KEGG Orthology (KO) as a controlled vocabulary. Bioinformatics 21: 3787–3793.
12. Moriya Y, Itoh M, Okuda S, Yoshizawa AC, Kanehisa M (2007) KAAS: an automatic genome annotation and pathway reconstruction server. Nucleic Acids Res 35: W182–185.
13. Huang da W, Sherman BT, Lempicki RA (2009) Bioinformatics enrichment tools: paths toward the comprehensive functional analysis of large gene lists. Nucleic acids research 37: 1–13.
14. Boyle EI, Weng S, Gollub J, Jin H, Botstein D, et al. (2004) GO::TermFinder– open source software for accessing Gene Ontology information and finding significantly enriched Gene Ontology terms associated with a list of genes. Bioinformatics 20: 3710–3715.
15. Curtis RK, Oresic M, Vidal-Puig A (2005) Pathways to the analysis of microarray data. Trends Biotechnol 23: 429–435.
16. Werner T (2008) Bioinformatics applications for pathway analysis of microarray data. Curr Opin Biotechnol 19: 50–54.
17. Subramanian A, Tamayo P, Mootha VK, Mukherjee S, Ebert BL, et al. (2005) Gene set enrichment analysis: a knowledge-based approach for interpreting genome-wide expression profiles. Proc Natl Acad Sci U S A 102: 15545–15550. 18. Tintle NL, Best AA, DeJongh M, Van Bruggen D, Heffron F, et al. (2008) Gene set analyses for interpreting microarray experiments on prokaryotic organisms. BMC Bioinformatics 9: 469.
19. Subramanian A, Tamayo P, Mootha VK, Mukherjee S, Ebert BL, et al. (2005) Gene set enrichment analysis: a knowledge-based approach for interpreting genome-wide expression profiles. Proceedings of the National Academy of Sciences of the United States of America 102: 15545–15550.
20. Huang da W, Sherman BT, Tan Q, Collins JR, Alvord WG, et al. (2007) The DAVID Gene Functional Classification Tool: a novel biological module-centric algorithm to functionally analyze large gene lists. Genome biology 8: R183. 21. Edelman EJ, Guinney J, Chi JT, Febbo PG, Mukherjee S (2008) Modeling
cancer progression via pathway dependencies. PLoS Comput Biol 4: e28. 22. Kanehisa M, Goto S, Hattori M, Aoki-Kinoshita K, Itoh M, et al. (2006) From
genomics to chemical genomics: new developments in KEGG. Nucleic acids research 34: D354.
23. Ye Y, Doak TG (2009) A parsimony approach to biological pathway reconstruction/inference for genomes and metagenomes. PLoS Comput Biol 5: e1000465.
24. Overbeek R, Begley T, Butler RM, Choudhuri JV, Chuang HY, et al. (2005) The subsystems approach to genome annotation and its use in the project to annotate 1000 genomes. Nucleic Acids Res 33: 5691–5702.
25. Wu J, Mao X, Cai T, Luo J, Wei L (2006) KOBAS server: a web-based platform for automated annotation and pathway identification. Nucleic Acids Res 34: W720–724.
26. Aziz RK, Bartels D, Best AA, DeJongh M, Disz T, et al. (2008) The RAST Server: rapid annotations using subsystems technology. BMC Genomics 9: 75. 27. Mao F, Su Z, Olman V, Dam P, Liu Z, et al. (2006) Mapping of orthologous
genes in the context of biological pathways: An application of integer programming. Proc Natl Acad Sci U S A 103: 129–134.
28. Pollard K, Dudoit S, Laan M (2005) Multiple testing procedures: the multtest package and applications to genomics. Bioinformatics and Computational Biology Solutions Using R and Bioconductor. pp 249–271.
29. Wolfe AJ, Chang DE, Walker JD, Seitz-Partridge JE, Vidaurri MD, et al. (2003) Evidence that acetyl phosphate functions as a global signal during biofilm development. Mol Microbiol 48: 977–988.
30. Meredith TC, Mamat U, Kaczynski Z, Lindner B, Holst O, et al. (2007) Modification of lipopolysaccharide with colanic acid (M-antigen) repeats in Escherichia coli. J Biol Chem 282: 7790–7798.
31. Callewaert L, Vanderkelen L, Deckers D, Aertsen A, Robben J, et al. (2008) Detection of a lysozyme inhibitor in Proteus mirabilis by a new reverse zymogram method. Appl Environ Microbiol 74: 4978–4981.
32. Komeda Y (1986) Transcriptional control of flagellar genes in Escherichia coli K-12. J Bacteriol 168: 1315–1318.