AMTD
7, 7531–7567, 2014High temperature valveless injection
for on-line GC
N. M. Kreisberg et al.
Title Page
Abstract Introduction
Conclusions References
Tables Figures
◭ ◮
◭ ◮
Back Close
Full Screen / Esc
Printer-friendly Version Interactive Discussion
Discussion
P
a
per
|
Discus
sion
P
a
per
|
Discussion
P
a
per
|
Discussion
P
a
per
|
Atmos. Meas. Tech. Discuss., 7, 7531–7567, 2014 www.atmos-meas-tech-discuss.net/7/7531/2014/ doi:10.5194/amtd-7-7531-2014
© Author(s) 2014. CC Attribution 3.0 License.
This discussion paper is/has been under review for the journal Atmospheric Measurement Techniques (AMT). Please refer to the corresponding final paper in AMT if available.
Development of an automated high
temperature valveless injection system
for on-line gas chromatography
N. M. Kreisberg1, D. R. Worton1,2, Y. Zhao2,*, G. Isaacman2, A. H. Goldstein2,3, and S. V. Hering1
1
Aerosol Dynamics Inc., Berkeley, CA, USA 2
Department of Environmental Science, Policy and Management, University of California, Berkeley, CA, USA
3
Department of Civil and Environmental Engineering, University of California, Berkeley, CA, USA
*
now at: Department of Chemical Engineering, Carnegie Mellon University, Pittsburgh, PA, USA
Received: 22 May 2014 – Accepted: 2 July 2014 – Published: 23 July 2014
Correspondence to: N. M. Kreisberg ([email protected])
AMTD
7, 7531–7567, 2014High temperature valveless injection
for on-line GC
N. M. Kreisberg et al.
Title Page
Abstract Introduction
Conclusions References
Tables Figures
◭ ◮
◭ ◮
Back Close
Full Screen / Esc
Printer-friendly Version Interactive Discussion
Discussion
P
a
per
|
Discus
sion
P
a
per
|
Discussion
P
a
per
|
Discussion
P
a
per
|
Abstract
A reliable method of sample introduction is presented for on-line gas chromatography with a special application to in-situ field portable atmospheric sampling instruments. A traditional multi-port valve is replaced with a controlled pressure switching device
that offers the advantage of long term reliability and stable sample transfer efficiency.
5
An engineering design model is presented and tested that allows customizing the inter-face for other applications. Flow model accuracy is within measurement accuracy (1 %) when parameters are tuned for an ambient detector and 15 % accurate when applied to a vacuum based detector. Laboratory comparisons made between the two methods of sample introduction using a thermal desorption aerosol gas chromatograph (TAG)
10
show approximately three times greater reproducibility maintained over the equivalent of a week of continuous sampling. Field performance results for two versions of the valveless interface used in the in-situ instrument demonstrate minimal trending and a zero failure rate during field deployments ranging up to four weeks of continuous sampling. Extension of the VLI to dual collection cells is presented with less than 3 %
15
cell-to-cell carry-over.
1 Introduction
In the atmosphere, organic compounds play a central role in the processes that gen-erate tropospheric ozone and secondary organic aerosol (SOA). Many thousands of these organic compounds have been identified in both the gas and particle phases
20
(Hamilton et al., 2004; Lewis et al., 2000) using various chromatographic techniques, including gas chromatography (GC), and these most likely represent only a small frac-tion of what is actually present (Goldstein and Galbally, 2007). It is important to char-acterize and quantify this atmospheric pool of volatile, semi-volatile and non-volatile organics in order to improve our understanding of ozone photochemistry and SOA
for-25
AMTD
7, 7531–7567, 2014High temperature valveless injection
for on-line GC
N. M. Kreisberg et al.
Title Page
Abstract Introduction
Conclusions References
Tables Figures
◭ ◮
◭ ◮
Back Close
Full Screen / Esc
Printer-friendly Version Interactive Discussion
Discussion
P
a
per
|
Discus
sion
P
a
per
|
Discussion
P
a
per
|
Discussion
P
a
per
|
Since the majority of these organic compounds are present in the atmosphere at low abundance, sample concentration prior to analysis is necessary. This pre-concentration can be performed in a variety of ways, e.g., adsorbent traps, impactors, or filters (Ras et al., 2009; Williams et al., 2006; Zhao et al., 2013a), depending on what organic species are of interest and whether they are in the gaseous or condensed phases. For
5
semi-continuous in-situ measurements, regardless of the collection method employed, the pre-concentration sampling inlet must be isolated from the analysis components of the instrument. This separation is often achieved using a two position valve.
Recently, there has been an increased focus on the identification and quantification
of low volatility compounds in the atmosphere, with vapor pressures less than∼50 Pa
10
(equivalent ton-dodecane at 20◦C), especially with respect to their role as precursors
to SOA (Robinson et al., 2007; Kroll and Seinfeld, 2008). Efficient transfer of these
compounds from a collection cell to the detector requires high temperature transfer lines. Any switching valve employed in the sample transfer path must also be similarly
heated. The presence of mechanical seals imposes a maximum temperature (∼300◦C)
15
for the valve. Further, wetted polymeric composite seals (e.g., polyimide and graphite) within a valve contribute to incomplete sample transfer of more polar compounds. Me-chanical switching inevitably leads to leaking, sample degradation and loss, which ulti-mately requires valve rotor replacement leading to instrument downtime. In GC appli-cations, leaks contribute to column stationary phase decomposition and degradation
20
of the chromatography. Further, when a mass spectrometer is employed these leaks can cause oxidation of the ion source, shortened electron impact filament lifespan and reduced sensitivity. To avoid such problems and to improve the reliability and long term instrument stability, we sought a suitable substitute for the classical sample injection valve.
25
AMTD
7, 7531–7567, 2014High temperature valveless injection
for on-line GC
N. M. Kreisberg et al.
Title Page
Abstract Introduction
Conclusions References
Tables Figures
◭ ◮
◭ ◮
Back Close
Full Screen / Esc
Printer-friendly Version Interactive Discussion
Discussion
P
a
per
|
Discus
sion
P
a
per
|
Discussion
P
a
per
|
Discussion
P
a
per
|
switching work of Deans (1972, 1973, 1984), who argued that with such a design
one could maximize transfer efficiency and increase reproducibility and reliability at
the same time. TAG is an in-situ instrument for the hourly measurement of organic compounds in atmospheric aerosols. Samples are collected for approximately thirty minutes, and then immediately transferred via thermal desorption onto a gas
chro-5
matograph. The chromatographic analysis is conducted during the collection of the subsequent sample, as described in more detail by (Williams et al., 2006). The relia-bility of using this heated valve on the TAG instrument has been highly variable with observed rotor seal lifetimes ranging from immediate failure, likely stemming from op-erating in a dirty environment, to several months. The application of an anti-stiction
10
coating (AMC-18, Advanced Materials Components Express, Lemont, PA) to the ro-tor appears to reduce wear and extend the lifespan significantly (B. J. Williams, 2014;
personal communication) but quantifying this improvement would be difficult and
pro-hibitively time consuming. As a result of valve seal failures, there were periods of in-strument downtime during in-situ sampling when measurements were not possible,
15
resulting in prolonged gaps in an otherwise continuous dataset.
Here two versions of the VLI are presented, the original discrete-component proto-type VLI system, and an improved, integrated-manifold version. A design model of the VLI flows is presented and its accuracy is evaluated through direct laboratory mea-surements. The performance of the discrete-component prototype VLI was evaluated
20
in the laboratory with direct comparison to the six-port valve of the original TAG. Both versions of the VLI have been deployed in field studies and data are presented here to demonstrate reliability of the interface and the degree of consistency in sample de-livery obtained while operating in challenging environments. Extension to the trans-fer of highly polar compounds using on-line derivatization and the adaptation of the
25
AMTD
7, 7531–7567, 2014High temperature valveless injection
for on-line GC
N. M. Kreisberg et al.
Title Page
Abstract Introduction
Conclusions References
Tables Figures
◭ ◮
◭ ◮
Back Close
Full Screen / Esc
Printer-friendly Version Interactive Discussion
Discussion
P
a
per
|
Discus
sion
P
a
per
|
Discussion
P
a
per
|
Discussion
P
a
per
|
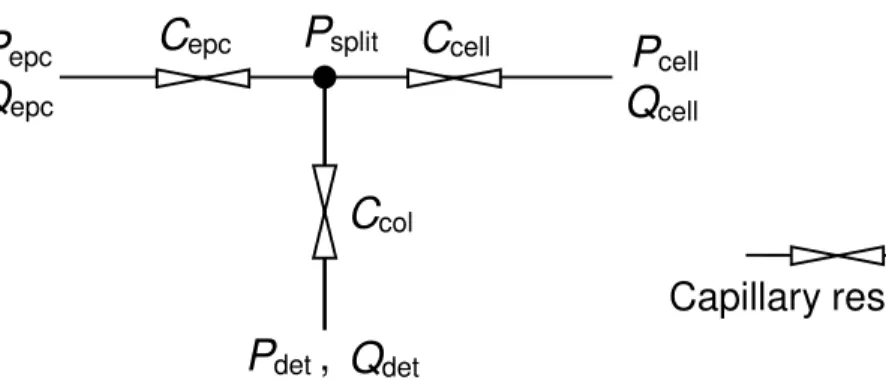
2 Valveless Injection (VLI) design and modeling
2.1 Generic system description
An on-line chromatographic instrument for continuous operation requires a method of repeatedly introducing samples into the analysis section by coupling two independent flow subsystems – the sample collector and the gas chromatograph – and conveying
5
the concentrated sample ultimately to the head of the analytical column. The VLI sys-tem is a pressure-balancing, split-flow method that employs a restrictive capillary tube between the collection cell and the inlet of the chromatograph. The capillary flows have been modeled in the context of a gas chromatography based system, but the
mathe-matical approach allows adaptation for different applications, e.g., alternate collection
10
techniques or GC column sets or stand-alone detectors with a suitable inlet restriction replacing the GC column.
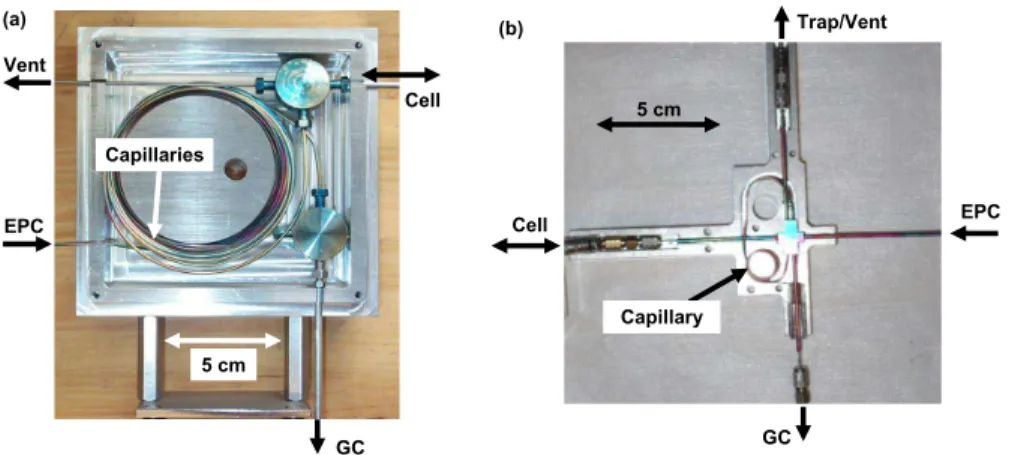
Figure 1 shows a schematic of the original method of sample injection using a 6-port valve (a), and the VLI system (b), when employed with a sampling system consisting of a single collection and thermal desorption (CTD) cell. During aerosol collection, the
15
sampling valves located on either side of the CTD cell are open, and a vacuum pump
pulls the atmospheric sample into the cell at approximately 10 L min−1. Depending on
the design of the CTD, the pressure within the cell during sampling,Pcell, is between
∼50 and 95 kPa (Williams et al., 2006). Simultaneously with sample collection, the gas
chromatograph (GC) is operated to analyze the previously collected sample. In contrast
20
to the relatively large sample collection rate, the GC operates with open tubular
capil-lary flows of order 1 ml min−1(usually helium as carrier gas), and the pressure at the
head of the column (Psplit) is of the order 300 kPa. This large flow differential between
sampling and analytic flows facilitates an open connection between them if done with a suitably restrictive means that permits flow direction reversal under pressure control.
25
AMTD
7, 7531–7567, 2014High temperature valveless injection
for on-line GC
N. M. Kreisberg et al.
Title Page
Abstract Introduction
Conclusions References
Tables Figures
◭ ◮
◭ ◮
Back Close
Full Screen / Esc
Printer-friendly Version Interactive Discussion
Discussion
P
a
per
|
Discus
sion
P
a
per
|
Discussion
P
a
per
|
Discussion
P
a
per
|
and larger bores are less susceptible to clogging. The vent valve provides the option for purging the CTD cell with carrier gas prior to injection.
Two flow states are used during operation of the TAG instrument: (1)concurrent
col-lection and analysis(“load”), wherein excess helium carrier gas flow over that required
for the column is bled into the CTD cell, and (2) sample transfer from the cell to the
5
column(“inject”) is conveyed by a second helium source. During sampling, concurrent with analysis of the prior sample, a small flow of helium flows from the split point into
the CTD cell. This flow is typically<0.1 % of the sampling flow rate of the TAG
instru-ment and thus requires no correction to sample volumes. Conversely, during sample transfer, valves on either side of the cell and the vent are closed, and the auxiliary
he-10
lium source at fixed pressurePCTDdrives the desorbed sample to flow on to the head
of the column. During this transfer period, the flow delivered by the electronic pressure
controller (EPC),Qepc, is either shut offvia a solenoid valve or set to a minimum to
al-low maximum transfer rates from the CTD cell to the column while avoiding any sample
diversion at the split point (Psplit). To enable the use of a small constant purge flow from
15
the EPC during injection an additional restrictive capillary, Cepc, replaces the valve as
discussed further in the Appendix A. A mass flow controller on the CTD cell regulates the flow through the cell during the purge and cell cool down steps, when the CTD cell is vented to atmosphere. Originally, the vent was used to purge water present with atmospheric aerosols (Williams et al., 2006) and to purge solvent following injection of
20
a liquid standard (Kreisberg et al., 2009).
A variation of this scenario involves the addition of a secondary focusing trap on the
vent path that enables the use of higher, more efficient desorption flow rates through
the cell than can be achieved with direct injections on to a restrictive GC column (Zhao et al., 2013a). After the cell is completely desorbed, the vent valve is closed and a
sec-25
ondary helium purge control valve is opened to back-flush the trapped sample rapidly
on to the column at 1–4 ml min−1 flow rates. The secondary focusing trap offers the
AMTD
7, 7531–7567, 2014High temperature valveless injection
for on-line GC
N. M. Kreisberg et al.
Title Page
Abstract Introduction
Conclusions References
Tables Figures
◭ ◮
◭ ◮
Back Close
Full Screen / Esc
Printer-friendly Version Interactive Discussion
Discussion
P
a
per
|
Discus
sion
P
a
per
|
Discussion
P
a
per
|
Discussion
P
a
per
|
reagents to the analytic column when employing on-line derivatization methods (Isaac-man et al., 2014).
2.2 Gas flow model
The pressure-drop dependent flows of each of the capillaries used to build a valve-less interface have been modeled and operational control stems from manipulation
5
of the carrier gas head pressure (Pepc) and the sample collection cell pressure (Pcell).
For typical constant-flow GC operations,Pepc increases with the oven temperature in
a programmed way to provide a constant flow of carrier gas onto the column during analysis (Blumberg, 2010).
With an assumed ideal gas behavior, the carrier flow within the injection system can
10
be modeled exactly with governing expressions derived algebraically. These equations are readily solvable by simple numeric techniques (e.g. the solver tool within Microsoft
Excel®is adequate). The expressions are derived in the most general way to facilitate
adaptation to other applications. The custom hardware employed is described, but off
the shelf parts can be used, as with our prototype, without significant compromise for
15
many applications.
The volumetric flow governs transport of analytes out of the collection cell (at cell
temperature and pressure (T, P) conditions) during desorption and through the
col-umn itself during analysis per standard chromatography theory (e.g. McNair and Miller, 2011). Key to a correct formulation is consistent use of the appropriate temperature
20
and pressure references as dictated by mass flow conservation and the ideal gas
ap-proximation. Turbulence, non-continuum, entrance and wall effects are assumed to be
negligible and otherwise become subsumed in the capillary calibration process as de-scribed in the next section. These physical conditions are broadly satisfied with gas chromatography (Blumberg, 2010).
25
AMTD
7, 7531–7567, 2014High temperature valveless injection
for on-line GC
N. M. Kreisberg et al.
Title Page
Abstract Introduction
Conclusions References
Tables Figures
◭ ◮
◭ ◮
Back Close
Full Screen / Esc
Printer-friendly Version Interactive Discussion
Discussion
P
a
per
|
Discus
sion
P
a
per
|
Discussion
P
a
per
|
Discussion
P
a
per
|
as an FID and MS, respectively. Using vacuum outlet conditions appropriate for mass
spectrometer based detection not only simplifies the formulation but also offers better
chromatographic performance over ambient pressure detectors when operating near optimum GC column conditions (Giddings, 1964).
Referring to Fig. 1c, the pressure at the head of the column,Psplit, determines the flow
5
to or from the cell and through the column in conjunction withPcellandPdet, respectively.
The carrier gas source pressure at the EPC equals the split pressure (Pepc=Psplit)
when the valve on the EPC line is open and a minimally restrictive tubing is used for that pathway. The case were this tubing is intentionally made restrictive and therefore
Pepc6=Psplit is covered in the Appendix. The pressure at the detector is taken as fixed
10
at either 101 kPa for an atmospheric based detector (e.g. FID) or at 0 kPa for a mass spectrometer. Thus variations in the flow of carrier gas through the column are
deter-mined by variations in the pressure atPsplitalone. Flow rates and direction between the
CTD cell and the split point are controlled by the relative pressurePsplit−Pcell.
For the pressure drops normally encountered with gas chromatography, modeling
15
the pressure and flow in the VLI capillaries, including the chromatograph column, calls for use of the compressible Hagen–Poiseuille equation (Blumberg, 2010). The form of
this equation relates the capillary outlet flowQo to a given inlet pressurePi and outlet
pressurePogiven the temperature dependent carrier gas viscosityη(T), capillary length
L, internal diameterd and temperatureT:
20
Qo=
πd4
256η(T)L
!
Pi2−Po2
Pref !
T
ref
T
(1)
Flows are evaluated at reference conditionsTref and Pref, e.g. 298 K and 101 kPa for
ambient outlets, and the entire length of the capillary is assumed to be at temperature
T. The temperature dependence of helium’s dynamic viscosity can be conveniently
pre-dicted with 0.2 % accuracy over the temperature range of 300–700 K based on a
least-25
squares fit to standard reference data (Lide, 1991) by the relation:
η(T)=2.003×10⁻⁵×(T/T 0)
0.695
AMTD
7, 7531–7567, 2014High temperature valveless injection
for on-line GC
N. M. Kreisberg et al.
Title Page
Abstract Introduction
Conclusions References
Tables Figures
◭ ◮
◭ ◮
Back Close
Full Screen / Esc
Printer-friendly Version Interactive Discussion
Discussion
P
a
per
|
Discus
sion
P
a
per
|
Discussion
P
a
per
|
Discussion
P
a
per
|
in Pa-sec withT in K and T0=303.15 K. Similar expressions can be found for other
carrier gases.
For analysis mode, the goal is to obtain an equation defining the controlling param-eter, namelyPepc (=Psplit), in terms of the input parameters Pcell,Pdet,T1,T2, Tcol and the desired column flow. Two options are available for specifying the column flow: (i) as
5
an outlet flow given by Eq. (1) at a specific reference condition such as standard pres-sure and temperature or (ii) the average flow may be desired requiring the use of the
compressibility factorjc (James and Martin, 1952; Davankov et al., 1999) that relates
the average pressure in a capillary relative to the outlet pressurePothrough ¯P =Po/jc
where
10
jc=
3 Pi/Po 3
−1
2 Pi/Po 2
−1
(3)
Using (P,Tcol) for the reference conditions in Eq. (1) gives an expression for the average
column flow rate as
¯
Qcol= 3acol
Psplit2 −Pdet2 2
2(P3split−Pdet3 ) (4)
where a capillary conductance factor is introduced asacol=πd
4 col
256η(Tcol)Lcol −1
.
15
For the case of a vacuum based detector where Pdet=0, Eqs. (1) and (4) simplify
greatly to obtain closed form expressions solvable forPsplit in terms of a desired outlet
or average column flow. For other outlet conditions, these equations can be solved numerically.
During sample injection, the EPC valve is closed and the pressure in the cell is set to
20
AMTD
7, 7531–7567, 2014High temperature valveless injection
for on-line GC
N. M. Kreisberg et al.
Title Page
Abstract Introduction
Conclusions References
Tables Figures
◭ ◮
◭ ◮
Back Close
Full Screen / Esc
Printer-friendly Version Interactive Discussion
Discussion
P
a
per
|
Discus
sion
P
a
per
|
Discussion
P
a
per
|
Discussion
P
a
per
|
approximation given by Eq. (1) withPi=Pcelland outlet pressurePo=Pdetbecause the
column restriction is much greater than the VLI capillary (i.e.acell≪acol). Knowing the
exact injection flow rate is only used with the GC application when judging potential line leaks since this flow can be monitored via a mass flow controller. In a situation where this injection flow is used for immediate detection then a more accurate estimate for the
5
flow can be determined by including the small contribution fromacell into an effective
conductance factora′col.
2.3 Prototype VLI
The VLI prototype built with discrete components is shown in Fig. 2a and represents the configuration shown in Fig. 1b. A 50 cm-long stainless steel capillary with inner
10
diameter of nominally 125 µm (Upchurch, WA, USA) was connected by a pair of zero dead volume tees (Valco Instruments Co. Inc., Houston, TX, USA). Instead of using
a valve to shut-off the EPC flow, as shown in Fig. 1c, a second capillary identical to
Ccellsubstituted for this valve. This complication produces negligible sample redirection
during injection by virtue of a steady but small purge flow maintained out of the EPC.
15
Further discussion of the reasons for this substitution are detailed in the Appendix A in
addition to the method used to program the EPC whenPsplit 6=Pepc.
The prototype was housed in a machined aluminum block enclosure maintained at
300◦C with a pair of steel stand-offs to rest on top of the GC oven. An outer sheet metal
enclosure, not shown, holds a layer of insulation surrounding the inner heated box. To
20
provide uniform temperatures, the capillaries were wound around an 8 cm diameter, 2.5 cm thick central hub into which both the cartridge heater and a thermocouple were
inserted for use with a temperature controller. Slots in the walls allow passage of 1/16′′
OD connecting capillaries. Also shown are 6 mm OD aluminum rods grooved to hold the capillaries needing continuous heating, namely those from the cell and to the GC,
25
captured in the wall of the box to transfer heat. To minimize sample losses during thermal desorption, all stainless steel capillaries and tees were chemically passivated
AMTD
7, 7531–7567, 2014High temperature valveless injection
for on-line GC
N. M. Kreisberg et al.
Title Page
Abstract Introduction
Conclusions References
Tables Figures
◭ ◮
◭ ◮
Back Close
Full Screen / Esc
Printer-friendly Version Interactive Discussion
Discussion
P
a
per
|
Discus
sion
P
a
per
|
Discussion
P
a
per
|
Discussion
P
a
per
|
2.4 Integrated VLI
Following the successful first field deployment of the prototype VLI, an improved ver-sion of the interface was designed with a goal to reduce the number of compresver-sion fittings and total thermal mass to provide further increases in performance and relia-bility. The design of the modified VLI, shown in Fig. 2b, replaces the two discrete tees
5
with a single miniature flow manifold 13 mm×9.5 mm×3.2 mm machined from a
sin-gle block of stainless steel. The restrictive capillary tubing (Ccell in Fig. 1c) consists of
a coiled 30 cm long×0.8 mm OD× 0.12 mm ID tube brazed into two ports of the
mani-fold. The remaining ports are typically made from 5 cm long×1.6 mm OD×0.25 mm ID
pre-cut tubes (Upchurch). A compact, conforming aluminum block (Fig. 2b inset) was
10
machined to enclose the manifold including cavities to enclose miniature compression fittings used to make external connections (e.g. SilTite, SGE, TX, USA). Aluminum rods (6 mm OD) machined with lengthwise slots provide continuous heating for all sample handling transfer line tubing with outer diameters of 1.6 mm or 0.8 mm. This integrated version is now in use on multiple versions of the TAG instrument including the recently
15
developed combined TAG and Aerosol Mass Spectrometer (TAG-AMS) hybrid instru-ment (Williams et al., 2014). A normally open instruinstru-ment grade solenoid valve (411
series, ASCO) is used to shut-offthe EPC flow during injection. Other than the
pres-sure set point formulation, no significant difference exists between the two versions of
the VLI and they would be expected to perform similarly.
20
2.5 Dual cell modification
A further modification was made to the integrated manifold VLI to expand the capabil-ities of the semi-volatile targeted thermal-desorption aerosol gas chromatograph (SV-TAG) by including a second parallel sampling cell for gas/particle partitioning studies. This dual cell system uses an expanded valveless interface as described here while
fur-25
AMTD
7, 7531–7567, 2014High temperature valveless injection
for on-line GC
N. M. Kreisberg et al.
Title Page
Abstract Introduction
Conclusions References
Tables Figures
◭ ◮
◭ ◮
Back Close
Full Screen / Esc
Printer-friendly Version Interactive Discussion
Discussion
P
a
per
|
Discus
sion
P
a
per
|
Discussion
P
a
per
|
Discussion
P
a
per
|
inject the thermal desorption flow from either one of two collection cells as shown in Fig. 3. For example, during the thermal desorption of CTD2 the Aux1 valve is opened to release helium into the collected output of three tees (“TeeBox”) to prevent thermal desorption flow out of CTD2 from entering CTD1. This minor purge flow first pres-surizes the non-desorbing cell before combining with the other cell’s desorption flow
5
to fully sweep the sample out to the focusing trap. The additional purge flow slightly
increases (<20 %) the total desorption flow conveying the sample to the trap. Higher
desorption flows through the focusing trap reduces the focusing trap’s efficiency for the
lightest compounds analyzed but small reductions in the trap temperature (<5◦C) can
more than compensate for these losses (Zhao et al., 2013a). Passive flow balancing of
10
the purge lines is achieved using measured lengths of 0.25 mm ID capillary tubing in the ratio of desired flow split.
3 Laboratory and field testing methods
3.1 Measuring modeled flows
To test the governing control theory models, a discrete version of the VLI was used to
15
measure capillary flows as a function of inlet and outlet pressures and temperature. An absolute pressure gauge was temporarily inserted at the split point to directly measure
Psplit. The column and vent flow were measured as a function of capillary temperature and the pressures at the inlet and outlet. The vent flow is equivalent to the maximum flow that can enter the cell during sampling if the vent were closed. The range of control
20
parameters used represents typical ranges encountered in TAG based applications of
the VLI: 30–300◦C for the GC column, 300◦C isothermal for the VLI interface
compo-nents, 140 kPa to 430 kPa absolute inlet pressure and either 101 kPa or 0 kPa absolute outlet pressure.
Capillary volumetric flows were measured either directly at the outlet or
indi-25
AMTD
7, 7531–7567, 2014High temperature valveless injection
for on-line GC
N. M. Kreisberg et al.
Title Page
Abstract Introduction
Conclusions References
Tables Figures
◭ ◮
◭ ◮
Back Close
Full Screen / Esc
Printer-friendly Version Interactive Discussion
Discussion
P
a
per
|
Discus
sion
P
a
per
|
Discussion
P
a
per
|
Discussion
P
a
per
|
spectrometer. TheQepc outlet flow was measured on the vent line, Fig. 1b, with the cell
sampling valves closed using a volumetric flow bubble meter (Gilibrator, Sensidyne, FL, USA) with a 1 % specified accuracy. For column outlet flow at ambient condition (FID detector), a graduated pipette based soap bubble meter was used with stop watch timed transits. The volume of the pipette was confirmed using water and a gravimetric
5
scale. The largest source of error is in the manual timing of bubble transits so an em-pirical estimate of uncertainty was obtained from triplet measurements of 25 flow rate
readings over the range of 1.7 to 20 mL min−1. The mean relative standard deviation of
1 % was taken as the uncertainty of these flow rate measurements.
For the vacuum outlet case, the average volumetric column flow given by Eq. (4)
10
was determined indirectly through measured transit times of non-retained gas injec-tions passing through the column and detected by the mass spectrometer. A septum
port was temporarily introduced immediately upstream of the capillary split point (Psplit
in Fig. 1) to introduce∼1 µL injections of air. Silica capillary tubing used for gas
chro-matography columns are manufactured with strict process controls resulting in very
15
tight tolerances on internal diameter. The manufacturer’s internal diameter (0.25 mm)
was used to calculate the silica column’s internal volume to be 1.47 cm3. The additional
dead volume introduced with the temporary injection port was estimated to be 0.12 cm3
or less than 10 % of the column volume. No corrections to capillary dimensions were made for temperature expansion because the change in fused quartz dimensions for
20
a 300◦C operating range is less than 0.02 %.
3.2 Comparing prototype VLI to 6-port valve
Performance of the prototype VLI system was evaluated using measurements of sam-ple transfer performance over the course of months during development of the SV-TAG, a version of the in-situ thermal desorption aerosol gas chromatograph targeting
25
AMTD
7, 7531–7567, 2014High temperature valveless injection
for on-line GC
N. M. Kreisberg et al.
Title Page
Abstract Introduction
Conclusions References
Tables Figures
◭ ◮
◭ ◮
Back Close
Full Screen / Esc
Printer-friendly Version Interactive Discussion
Discussion
P
a
per
|
Discus
sion
P
a
per
|
Discussion
P
a
per
|
Discussion
P
a
per
|
using standard GC/MS methods as detailed elsewhere (Williams et al., 2006; Zhao et al., 2013a). Laboratory evaluations comparing the VLI performance relative to the original 6-port valve were conducted using injected standards of a complete suite of
evenn-alkanes from C8to C40 (Accustandard). Two one-month periods of laboratory
measurements are compared that approximate continuous field operation on each of
5
the two injection systems. Sample transfer variability was judged through the relative
recovery ofn-alkanes by normalizing each compound’s peak area response by that
of eicosane’s (C20). Long term stability is best judged this way because absolute
vari-ability from manual injections can be greatly reduced using automated injection sys-tems (Isaacman et al., 2011) and changes in detector response or “drift” are removed
10
through internal standard corrections (Worton et al., 2012). In particular, loss in
trans-fer efficiency for compounds with the lowest volatility (largest number of carbon atoms)
serves as the most sensitive indicator of reduced sample transfer efficiency for the case
of a fixed sample matrix such as in using injected standards alone.
3.3 Evaluating VLI field performance 15
The VLI field performance is illustrated with two versions of the TAG instrument. The first, hereafter referred to as Instrument 1, introduced the prototype version of the VLI along with a vapor phase denuder for the study of gas/particle partitioning (Zhao et al., 2013b). Instrument 1 was deployed during the Research in California at the Nexus of Air Quality and Climate Change (CalNex) campaign from 31 May to 27 June 2010.
20
Ambient samples were acquired at 9 L min−1 for two durations: 90 min from 31 May to
9 June and 30 min from 10 to 27 June. Further details of the sample collection and anal-ysis can be found elsewhere (Zhao et al., 2013b). Field based evaluations of the VLI performance during this study were based on the use of perdeuterated internal
stan-dards (n-alkanes and poly aromatic hydrocarbons; C/D/N Isotopes) manually injected
25
AMTD
7, 7531–7567, 2014High temperature valveless injection
for on-line GC
N. M. Kreisberg et al.
Title Page
Abstract Introduction
Conclusions References
Tables Figures
◭ ◮
◭ ◮
Back Close
Full Screen / Esc
Printer-friendly Version Interactive Discussion
Discussion
P
a
per
|
Discus
sion
P
a
per
|
Discussion
P
a
per
|
Discussion
P
a
per
|
compound peaks from factors such as changing detector response or changes in sam-ple transfer driven by variable samsam-ple matrices (Worton et al., 2012; Lambe et al., 2009). Under relatively stable ambient concentrations and detector response, recovery of internal standards serves as an absolute stability test of the whole thermal desorp-tion process including the VLI. Since the more volatile, non-polar internal standards
5
have reduced sample matrix sensitivity, they are a more reliable indicator of short term
stability in transfer efficiency when a changing sample matrix exists. To evaluate the
transfer efficiency of the TAG during the study, relative responses are presented for all
internal standard hydrocarbons more volatile thann-dotriacontane (C32).
A second version of the TAG, Instrument 2, used the integrated manifold version
10
of the VLI and was further modified for on-line derivatization using two parallel sam-pling cells, as detailed elsewhere (Isaacman et al., 2014). The VLI was extended to allow independent introduction of samples from each cell to perform serial analysis for pairs of samples acquired in parallel (usually one through a denuder and one direct) as shown in Fig. 3. Unlike prior versions of the TAG, this version of the instrument
15
collects samples in a thermally regenerated metal fiber filter cell designed to capture
semi-volatile compounds in the vapor phase with high efficiency (Zhao et al., 2013a).
Recent field measurements in rural Brazil with Instrument 2 allow evaluating the in-tegrated VLI for a wide range of compounds in a region influenced by both tropical rain forests and intermittent urban emissions. With the newly introduced on-line
deriva-20
tization, the stability of the integrated VLI was evaluated using automated injections of a suite of internal standards injected on top of every ambient sample acquired
during continuous sampling from 27 February 2014–18 March 2014 at 10 L min−1
for a pair of simultaneous 20 min samples on the two cells. The internal standards
used included: perdeuterated C14–C32 n-alkanes (even carbon numbers only),
de-25
canoic acid-D19, tetradecanoic acid-D27, hexadecanoic acid-D31, octadecanoic
acid-D35, pentadecanol-D31, cholesterol-D6, hexanedioic acid-D4, 3-hydroxy pentanedioic
acid-D5,
glucose-13
C6, and pentaerythritol-D5. These standards span O : C ratios of 0
AMTD
7, 7531–7567, 2014High temperature valveless injection
for on-line GC
N. M. Kreisberg et al.
Title Page
Abstract Introduction
Conclusions References
Tables Figures
◭ ◮
◭ ◮
Back Close
Full Screen / Esc
Printer-friendly Version Interactive Discussion
Discussion
P
a
per
|
Discus
sion
P
a
per
|
Discussion
P
a
per
|
Discussion
P
a
per
|
internal standards was chosen to match the local naturally low ambient concentrations, approximately an order of magnitude more dilute than that used in the prototype field deployment using Instrument 1.
To help evaluate sample recovery stability, we define a measure of trending in system
response as the ratio of means of the internal standard responseSi,m/zfor the first half
5
of a consistent operation period relative to the second half of that period for a given
compoundi with mass to charge ratiom/z:
Tri= Pn
n/2+1Si,m/z Pn/2
1 Si,m/z
(5)
This metric for stability was applied to data from both instruments. For Instrument 1
with two sampling periods using different sampling durations, 30 min and 90 min, each
10
period is treated separately because sample size has a strong influence on absolute compound recoveries. For Instrument 2, a period with stable operating conditions was selected, namely one between MS source cleaning, re-tuning or system maintenance
changes likely to directly affect signal response and thereby compromise the VLI
eval-uation.
15
3.4 Testing carry-over in dual cell VLI
During the development of the dual cell instrument, tests were performed to evaluate carry-over from one cell into the other which serves as a control test of sample handling
by the VLI. Incomplete delivery of one cell’s sample, whether from diffusion, cold spots,
dead volumes or small leaks, can be evaluated using a cell blank of the companion
20
cell.
To test for this potential source of cross contamination, ambient air samples in Berke-ley, CA were collected in one cell (Cell 2) for one hour and then analyzed. Immediately following this analysis, the other cell (Cell 1) was analyzed with no sample or
intro-duction of standards. Carry-over fraction (fcarry) was calculated for a given ion as the
AMTD
7, 7531–7567, 2014High temperature valveless injection
for on-line GC
N. M. Kreisberg et al.
Title Page
Abstract Introduction
Conclusions References
Tables Figures
◭ ◮
◭ ◮
Back Close
Full Screen / Esc
Printer-friendly Version Interactive Discussion
Discussion
P
a
per
|
Discus
sion
P
a
per
|
Discussion
P
a
per
|
Discussion
P
a
per
|
detector response measured in the blank in Cell 1 as a fraction of the sample in Cell 2 after removing background contamination in Cell 1:
fcarry,m/z=
P
tR
Sblank,m/z−Sbkgd,m/z
P
tR
Ssamp,m/z
(6)
Detector response from an analysis of Cell 1 in the absence of sampling on either cell
was considered background signal,Sbkgd,m/z, and subtracted from the blank to remove
5
the fraction of detector response constantly present as background, not caused by cell-to-cell carryover. The remaining signal is assumed to have come from the analysis of
the sampled cell. Signal of each mass-to-charge ratio,Sm/z, was summed across GC
retention times spanning tridecane to heptacosane and compared to the analysis of
the sample,Ssamp,m/z, on the other cell (Cell 2).
10
4 Results
4.1 Model validation for column and vent flows
Evaluating the capillary flow model is easiest for the ambient outlet case because the column flow can be measured directly and the continuum approximation applies throughout both capillaries. For these reasons, this set of calibration data was chosen
15
as the primary test data set in which the model was “tuned” to calculate precise capil-lary IDs by maximizing agreement with the measured flows. Specifically, the measured
vent flow was regressed against the modeled vent flow (=Qcell given by Eq. 1) and
the sum of the residuals was minimized by variation of theCcell capillary ID. Similarly,
the measured column flow was regressed against the model column outlet flow and
20
AMTD
7, 7531–7567, 2014High temperature valveless injection
for on-line GC
N. M. Kreisberg et al.
Title Page
Abstract Introduction
Conclusions References
Tables Figures
◭ ◮
◭ ◮
Back Close
Full Screen / Esc
Printer-friendly Version Interactive Discussion
Discussion
P
a
per
|
Discus
sion
P
a
per
|
Discussion
P
a
per
|
Discussion
P
a
per
|
but differences obtained can also be attributed to other factors affecting the resulting
flows (e.g. tube restrictions introduced during fabrication or application of compression fittings during assembly).
The vent and column outlet flows were measured for 20 and 11 pressure and tem-perature pairs, respectively, over the pressure range of 150 to 340 kPa and for column
5
temperatures equal to 30, 100, 200 and 300◦C. The resulting fitted model was used
to generate modeled flow values for each of the original data as presented in Fig. 4.
Only the column flow is affected by oven temperature, indicated by symbol color in
Fig. 4a, through helium viscosity changes. The resulting optimized capillary inner
di-ameters were 0.244 mm for the column and 0.133 mm for the control capillary Ccell.
10
These values are close to the manufacturer’s values of 0.25 mm and 0.125 mm as ex-pected given the dominance of the two capillaries in governing the resulting flows. The linear regression results for both flows indicate excellent agreement between the tuned model and the measured flows under all conditions tested:
Column: Qmodel=(1.01±0.03)Qmeas+(0.01±0.05), R2 =0.99 [Ambient case]
15
Vent: Qmodel=(1.00±0.01)Qmeas+(0.14±0.14), R2 =1.00 [Ambient case]
With the resulting optimized capillary IDs obtained for the ambient case, the vacuum outlet case can be evaluated. For this comparison, the mean column flow was mea-sured using micro-injections of air and timed column transit times for 15 sets of
con-20
ditions at three oven temperatures (80, 200, 300◦C) at each of four pressures ranging
from 140 to 430 kPa. The measured vent and column flows are compared to the re-sulting model results using the optimized capillary IDs from the ambient case. The results for the vacuum outlet case are shown in Fig. 4 (triangles) along with the model fit results:
25
Column: Qmodel=(0.85±0.02)Qmeas−(0.06±0.04), R2 =0.99 [Vacuum case]
AMTD
7, 7531–7567, 2014High temperature valveless injection
for on-line GC
N. M. Kreisberg et al.
Title Page
Abstract Introduction
Conclusions References
Tables Figures
◭ ◮
◭ ◮
Back Close
Full Screen / Esc
Printer-friendly Version Interactive Discussion
Discussion
P
a
per
|
Discus
sion
P
a
per
|
Discussion
P
a
per
|
Discussion
P
a
per
|
Both measured flows were higher than the model predicted using the ambient calibra-tion, with the mean column flow approximately 15 % higher than the model and the measured vent flow 5 % higher than the model. The higher measured column flow may result from the non-continuum conditions that exist towards the column outlet as the pressure decreases and the mean free path of the carrier flow molecules therefore
5
approaches the tube ID. This explanation would not account for the vent flow which
depends only onPsplit and not the state of the column flow. Better agreement could
be obtained by choosing the vacuum set of data for the optimization or tuning pro-cess. Given the wide range of conditions covered in these two sets of measurements,
the model is sufficiently accurate to be highly useful in the design of VLI systems for
10
different instruments. Typically, the nominal capillary parameters presented by
manu-facturers are good enough to select capillary dimensions for a given set of operating conditions and then tuning or calibrating the interface produces a more accurate con-trol model if needed. For use in TAG instruments where the column head pressure is directly controlled and authentic standards are used to obtain absolute retention time
15
references, the need to calibrate individual VLI manifolds based on a fixed geometry is unnecessary.
4.2 Laboratory comparison to valve based system
Degradation of sample transfer efficiency with the traditional 6-port valve over time is
difficult to quantify because of the lack of predictable behavior during normal
opera-20
tion. The lack of predictability and potential for field study interruption was the primary motivation for developing the VLI system.
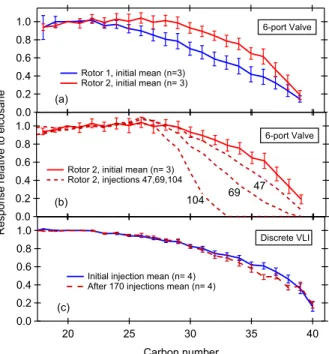
Figure 5a illustrates the initial performance variability inherent with the relative
trans-fer efficiency between two different sealing rotors on the same 6-port valve. Each curve
is the average of three consecutive injections for the two different rotors with±1
stan-25
dard deviation indicated by error bars. The greatest differences are observed for>C25.
The seal and transfer efficiency can last for days to weeks without significant change
af-AMTD
7, 7531–7567, 2014High temperature valveless injection
for on-line GC
N. M. Kreisberg et al.
Title Page
Abstract Introduction
Conclusions References
Tables Figures
◭ ◮
◭ ◮
Back Close
Full Screen / Esc
Printer-friendly Version Interactive Discussion
Discussion
P
a
per
|
Discus
sion
P
a
per
|
Discussion
P
a
per
|
Discussion
P
a
per
|
ter the initial brief conditioning period. A rotor can fail almost immediately in a field study environment but more often it will slowly degrade over time. For instance, the
second rotor initially shows a relative recovery at C37 of ∼0.5 but during the
subse-quent hundred injections, Fig. 5b, this level of recovery was only attained at C35, C33
and then C30 for the 47th, 69th and 104th subsequent injection, respectively. The use
5
of an anti-stiction coating (AMC18 treatment, AMCX) can greatly improve the longevity of the vespel-graphite rotor used to provide the high temperature seal. Through use of this coating, a typical 2–4 week lifespan based on 24 analyses or sample injections per day can be extended by as much as a factor of four (B. J. Williams, personal communi-cation, 2014). Inconsistent results even with this coating, however, are the rule.
10
Figure 5c demonstrates the long term stability and inherent reliability of the prototype VLI during laboratory evaluations. The relative recovery of the same standard used for the 6-port valve evaluation is shown for the beginning and end of a 173 sequence of injections during which no changes were made to the injection system. The average
relative transfer efficiency is given for four repeated injections at the beginning and end
15
of this series with error bars equal to±1 standard deviation for each set of injections.
The initial, short and long term performance equals or exceeds the performance of
the 6-port valve, particularly above C30. Restricting a comparison to C22 to C38, the
median relative standard deviation for the 6-port valve was 6 % and 7 % for rotor one and two, respectively, while both the initial and final median relative standard deviation
20
for the VLI system was 2 %. During the development and testing of the dual cell SV-TAG instrument, over four thousand successful injections were performed using just two integrated manifolds.
4.3 Application to in-situ field measurements
The prototype VLI was first deployed in the TAG instrument during a 2010 California
25
AMTD
7, 7531–7567, 2014High temperature valveless injection
for on-line GC
N. M. Kreisberg et al.
Title Page
Abstract Introduction
Conclusions References
Tables Figures
◭ ◮
◭ ◮
Back Close
Full Screen / Esc
Printer-friendly Version Interactive Discussion
Discussion
P
a
per
|
Discus
sion
P
a
per
|
Discussion
P
a
per
|
Discussion
P
a
per
|
retention times for these compounds were highly stable with standard deviations from the mean ranging from 0.8 to 1.5 s for all internal standards, including oxygenates (not
shown) more volatile than n-hexatriacontane (C36). These variations are an order of
magnitude smaller than the typical GC peak widths exhibited by all compounds eluting
with or beforen-dotriacontane (C32).
5
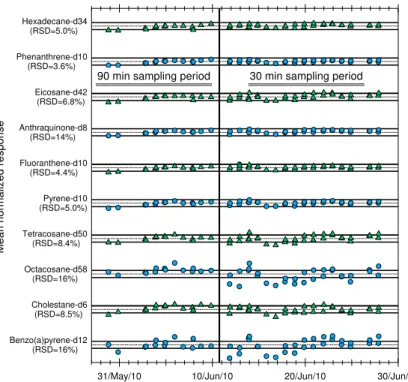
Peak integrals for each of ten perdeuterated internal standards is shown as mean
normalized and off-set time series in Fig. 6 arranged top to bottom by decreasing
volatil-ity (increasing boiling point) with the relative standard deviation (RSD) for each
com-pound. The compounds chosen span 16 to 28 carbon atoms, namely n-hexadecane
purely in the gas phase up ton-octacosane almost fully in the particle phase. The two
10
study periods employing different sampling durations show the same steady response.
All compounds show consistent but varying levels of variability with all saturated
hy-drocarbons less volatile than n-tetracosane varying from 4–7 % of the mean (heavy
dashed lines) while compounds with decreasing volatility demonstrate increasing vari-ations about the mean in response to matrix changes including sample size.
15
Comparing the two study periods illustrates the role of sample size on recovery.
For the first period in which sampling was conducted for 90 min, little to no effect of
the denuding of gas phase component is detectable. For the latter period, however, in which the sampling period was reduced to 30 min to improve temporal resolution, the absence or presence of the gas phase contribution is readily observable across
20
all compounds but especially forn-tetracosane and below in volatility. We surmise that
with 90 min samples, sufficient particulate material is collected to reduce the effect of
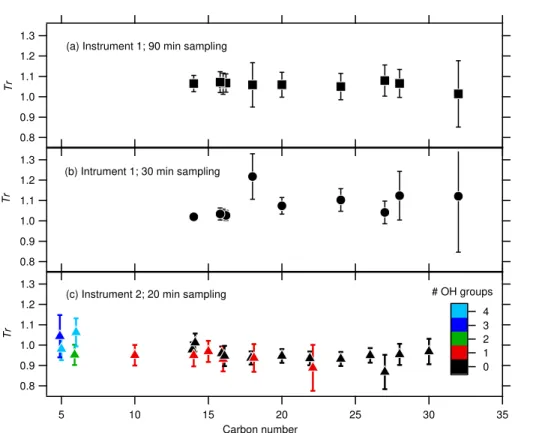
the vapor phase being present or not as determined by use of a carbon denuder. The lack of any long term trending is further evidence of long term consistency of sample injection using the VLI system. Figure 7a and b shows the ratio of first half
25
AMTD
7, 7531–7567, 2014High temperature valveless injection
for on-line GC
N. M. Kreisberg et al.
Title Page
Abstract Introduction
Conclusions References
Tables Figures
◭ ◮
◭ ◮
Back Close
Full Screen / Esc
Printer-friendly Version Interactive Discussion
Discussion
P
a
per
|
Discus
sion
P
a
per
|
Discussion
P
a
per
|
Discussion
P
a
per
|
t-distribution for the error estimate. Taken together, these data demonstrate implicitly the lack of any long term degradation in performance in the prototype VLI system.
With the introduction of on-line derivatization with Instrument 2, the VLI performance can be evaluated using a broader range of compound moieties. Using the same trend metric as above, Fig. 7c shows the resulting change in response over 343 sample
5
injections in the course of 19 days of uninterrupted sampling in which 899 sample injections total were performed for both cells. A small decrease in recovery on the order of 5 % is observed that is flat and without significant carbon number or most significantly polarity (number of OH groups) dependence. This small flat reduction is most likely
attributable to detector sensitivity decline and is small enough to not affect the ability
10
to use the response of these internal standards to fully quantify the concentrations of ambient organic species including those that are highly oxygenated.
4.4 Dual cell carry-over
Average cell-to-cell carryover in the dual-cell TAG system was quantified through a set of four 1 h samples of ambient air in Berkeley, CA collected on Cell 2 followed by
sub-15
sequent analyses of an empty Cell 1. An example of the resulting chromatograms for
total ion abundance and the most abundant hydrocarbon ion (57 m/z) is shown in
Fig. 8a in which the background-subtracted blank on Cell 1 is shown (red dashed) with the analyzed sample on Cell 2 (solid color). Starred peaks are compounds known to be present as internal contaminants. The fraction of carry-over was calculated for the
20
100 most abundant ions or 400 individual ion measurements using Eq. (5) (i.e. blue/red dashed line divided by blue line).
Figure 8b shows the cumulative distribution of fcarry-over and its histogram (inset)
demonstrating a cell to cell carry-over of less than 4.4 % for 95 % of measured masses, with a median of 2.4 %. In addition to individual ions, total carryover was also
mea-25
sured using the total ion chromatogram and found to be 2.6±0.1 % for the 4 sample
sets. Further evidence of <3 % carryover comes from a long, continuous dataset of
AMTD
7, 7531–7567, 2014High temperature valveless injection
for on-line GC
N. M. Kreisberg et al.
Title Page
Abstract Introduction
Conclusions References
Tables Figures
◭ ◮
◭ ◮
Back Close
Full Screen / Esc
Printer-friendly Version Interactive Discussion
Discussion
P
a
per
|
Discus
sion
P
a
per
|
Discussion
P
a
per
|
Discussion
P
a
per
|
components were removed in the other cell; in these measurements, the gas-phase fraction of a highly volatile compound, pinonic acid, was regularly measured to have a signal 2–3 % of the whole air sample, providing a comparable upper bound for poten-tial cell carry-over.
5 Conclusions 5
A persistent goal for all versions of the TAG instrument is to collect continuous, hourly in-situ measurements in the field over several weeks to months. It is only with this type of data set that robust statistical analyses on the resulting data can be employed. In-troduction of the valveless injection system has greatly contributed to increasing the reliability of the TAG instrument, taking advantage of the collection flow rate being
sig-10
nificantly higher than the detector flow rate. The capillary flow model was shown to be
sufficiently accurate to allow designing VLI systems for a variety of applications under
different operating conditions and detectors. Laboratory and field data demonstrated
that this method of sample introduction provides for increased long term reliability and
improved reproducibility without any trade-offs. Since its introduction on the TAG
sys-15
tem, no VLI failures have been experienced in four separate field campaigns. Extension to a dual cell interface was made demonstrating less than 3 % carry-over between cells that greatly facilitates a more direct measurement of gas/particle partitioning. The VLI system is highly flexible and should be able to provide improvements in reliability for other on-line though not necessarily chromatography based instruments that employ
20
sample concentration prior to analysis.
Appendix A: EPC flow capillary
Sample diversion at the split point (Psplit in Fig. 1) is a concern for the case where
sample species are highly diffusive relative to injection time and length scales. The
resulting migration of these species up along the pathway towards the EPC can lead
AMTD
7, 7531–7567, 2014High temperature valveless injection
for on-line GC
N. M. Kreisberg et al.
Title Page
Abstract Introduction
Conclusions References
Tables Figures
◭ ◮
◭ ◮
Back Close
Full Screen / Esc
Printer-friendly Version Interactive Discussion
Discussion
P
a
per
|
Discus
sion
P
a
per
|
Discussion
P
a
per
|
Discussion
P
a
per
|
to split peak injections as the diverted sample transfers to the analytical column after the primary transferred sample has moved towards the detector. To avoid this potential
sample diversion an extra control capillary,Cepc, replaces the solenoid valve shown in
Fig. 1b and c, inserted between the EPC and the VLI split pressure point to provide enough pressure drop to permit control of a minimum flow out of the EPC during
sam-5
ple injection (see Fig. A1). This constant but minor flow prevents any sample diversion during injection. The original prototype took this approach and the modeling formula-tion is presented here. Although for the range of TAG analytes currently studied this approach has proven unnecessary, application of the VLI to gas phase species could employ this approach rather than resorting to cryofocusing on the analytical column to
10
insure consolidated sample injections.
The three flows of interest for modeling the VLI in the case of the presence ofCepc
are the column flowQcol, the cell flowQcelland the EPC flowQepc, which follow directly
from Eq. (1):
Qcol=acol
Psplit2 −Pdet2 Pref
T
ref
Tcol
(A1)
15
Qcell=acell
Psplit2 −Pcell2 Pref
T
ref
T1
(A2)
Qepc=aepc
Pepc2 −P 2 split
Pref
T
ref
T2
(A3)
where we have introduced “conductance” factorsafor each capillary:
acol=πdcol4 /256ηLcol acell=πd14/256ηL1 aepc=πd24/256ηL2
20
with the implicit understanding that the viscosities in theafactors are evaluated using
AMTD
7, 7531–7567, 2014High temperature valveless injection
for on-line GC
N. M. Kreisberg et al.
Title Page
Abstract Introduction
Conclusions References
Tables Figures
◭ ◮
◭ ◮
Back Close
Full Screen / Esc
Printer-friendly Version Interactive Discussion
Discussion
P
a
per
|
Discus
sion
P
a
per
|
Discussion
P
a
per
|
Discussion
P
a
per
|
During sampling and flow calibrations of the capillaries, the non-column flow exiting
the split point,Qcell, is equal to the sum of the flow exiting the vent plus the bleed flow
into the cell. During testing the cell is sealed offand all of this flow exits the vent where
it can be conveniently measured. Whether this flow is directed entirely out the vent or
split between the vent and the cell has only a minor effect on this flow even when the
5
cell is at half an atmosphere during critical flow sampling.
We arbitrarily define the flow to be positive in the direction leading from the EPC into the split point and then out towards the cell and through the column. By mass
conservation, the EPC flow Qepc equals Qcol+Qcell at the split point so substituting
using Eqs. (A1)–(A3) and making the simplification that the two capillaries Cepc and
10
Ccell are at the same temperature such that Tepc=Tcell≡Tc and taking the reference
pressure and temperature to be that at the split point, i.e. (Tref,Pref)=(Tsplit,Psplit) we obtain the relationship:
aepc
Pepc2 −Psplit2
=acol
Psplit2 −Pdet2 Tc/Tcol+acell
Psplit2 −Pcell2 (A4)
15
Eq. (A4) can be solved forPepc to obtain
Pepc= v u u t
aepc+acell+acolTc/Tcol
Psplit2 −acolPdet2 Tc/Tcol−acellPcell2
aepc (A5)
Equation (A5) governs the VLI operating flows during both sample injection and
anal-ysis. To express the control parameter Pepc as a function of flow rate, either Eq. (1)
20
can be solved algebraically or Eq. (4) can be solved numerically for the split pressure
Psplit and substituted into Eq. (A5) for the case of either specified outlet or average col-umn flow, respectively. During analysis, the EPC pressure is adjusted to provide the
appropriate GC column head pressure Psplit. For the VLI sample injection mode, we
want to maximize the sample delivery flow rateQcellby selecting the smallestPepc that
25
AMTD
7, 7531–7567, 2014High temperature valveless injection
for on-line GC
N. M. Kreisberg et al.
Title Page
Abstract Introduction
Conclusions References
Tables Figures
◭ ◮
◭ ◮
Back Close
Full Screen / Esc
Printer-friendly Version Interactive Discussion
Discussion
P
a
per
|
Discus
sion
P
a
per
|
Discussion
P
a
per
|
Discussion
P
a
per
|
the column by imposing the conditionPepc–Psplit be maintained greater than the
prac-tical resolution of the pressure controller. For the Agilent 6890 used in this work, this
constraint was typically taken to be∼10 kPa.
Acknowledgements. Funding for this work was provided by the Department of Energy under
STTR Grants 05ER 86235 and 08ER86335 and SBIR Grant
DE-FG02-5
08ER85160. G. Isaacman is supported by the National Science Foundation (NSF) Graduate Research Fellowship (NSF Grant: DGE 1106400).
References
Blumberg, L. M.: Temperature-Programmed Gas Chromatography, Wiley-VCH, Weinheim, Ger-many, 2010.
10
Davankov, V. A., Onuchak, L. A., Kudryashov, S. Y., and Arutyunov, Y. I.: Averaging the pressure and flow rate of the carrier gas in a gas chromatographic column, Chromatographia, 49, 449– 453, 1999.
Deans, D. R.: Sample injection in gas chromatography, in: Patent, Google Patents, 1972. Deans, D. R.: Gas flow switching method and apparatus, in: Patent, Google Patents, 1973.
15
Deans, D. R.: A new gas sampling device for gas chromatography, J. Chromatogr. A, 289, 43–51, 1984a.
Deans, D. R.: Sample injection, in: Patent, Google Patents, 1984b.
Giddings, J. C.: Role of column pressure drop in gas chromatographic resolution, Anal. Chem., 36, 741–744, 1964.
20
Goldstein, A. H. and Galbally, I. E.: Known and unexplored organic constituents in the earth’s atmosphere, Environ. Sci. Technol., 41, 1514–1521, 2007.
Hamilton, J. F., Webb, P. J., Lewis, A. C., Hopkins, J. R., Smith, S., and Davy, P.: Partially oxidised organic components in urban aerosol using GCXGC-TOF/MS, Atmos. Chem. Phys., 4, 1279–1290, doi:10.5194/acp-4-1279-2004, 2004.
25
Isaacman, G., Kreisberg, N. M., Worton, D. R., Hering, S. V., and Goldstein, A. H.: A versatile and reproducible automatic injection system for liquid standard introduction: application to in-situ calibration, Atmos. Meas. Tech., 4, 1937–1942, doi:10.5194/amt-4-1937-2011, 2011. Isaacman, G., Kreisberg, N. M., Yee, L. D., Worton, D. R., Chan, A. W. H., Moss, J. A., Hering, S.