Explain Variation in Feed Intake and Growth of Sole
(Solea solea)
Reared in Captivity
Julia Mas-Mun˜oz1,2,3*, Hans Komen2, Oliver Schneider3, Sander W. Visch1, Johan W. Schrama1
1Aquaculture and Fisheries Group, Wageningen University, Wageningen, The Netherlands,2Animal Breeding and Genetics Group, Wageningen University, Wageningen, The Netherlands,3Wageningen IMARES, Yerseke, The Netherlands
Abstract
The major economic constraint for culturing sole (Solea solea) is its slow and variable growth. The objective was to study the relationship between feed intake/efficiency, growth, and (non-) feeding behaviour of sole. Sixteen juveniles with an average (SD) growth of 2.7 (1.9) g/kg0.8/d were selected on their growth during a 4-week period in which they were housed communally with 84 other fish. Selected fish were housed individually during a second 4-week period to measure individual feed intake, growth, and behaviour. Fish were hand-fed three times a day during the dark phase of the day until apparent satiation. During six different days, behaviour was recorded twice daily during 3 minutes by direct observations. Total swimming activity, frequency of burying and of escapes were recorded. At the beginning and end of the growth period, two sequential behavioural tests were performed: ‘‘Novel Environment’’ and ‘‘Light Avoidance’’. Fish housed individually still exhibited pronounced variation in feed intake (CV = 23%), growth (CV = 25%) and behavior (CV = 100%). Differences in feed intake account for 79% of the observed individual differences in growth of sole. Fish with higher variation in feed intake between days and between meals within days had significantly a lower total feed intake (r =20.65 and r =20.77) and growth. Active fish showed significantly higher feed intake (r = 0.66) and growth (r = 0.58). Boldness during both challenge tests was related to fast growth: (1) fish which reacted with a lower latency time to swim in a novel environment had significantly higher feed intake (r =20.55) and growth (r =20.66); (2) fish escaping during the light avoidance test tended to show higher feed intake (P,0.1) and had higher growth (P,0.05). In conclusion, feeding consistency, swimming activity in the tank, and boldness during behavioral tests are related to feed intake and growth of sole in captivity.
Citation:Mas-Mun˜oz J, Komen H, Schneider O, Visch SW, Schrama JW (2011) Feeding Behaviour, Swimming Activity and Boldness Explain Variation in Feed Intake and Growth of Sole(Solea solea)Reared in Captivity. PLoS ONE 6(6): e21393. doi:10.1371/journal.pone.0021393
Editor:Lewis George Halsey, Roehampton University, United Kingdom
ReceivedFebruary 22, 2011;AcceptedMay 27, 2011;PublishedJune 27, 2011
Copyright:ß2011 Mas-Mun˜oz et al. This is an open-access article distributed under the terms of the Creative Commons Attribution License, which permits unrestricted use, distribution, and reproduction in any medium, provided the original author and source are credited.
Funding:This research project has been funded by Wageningen University and IMARES institute in The Netherlands, which together are integrated in a project theme on development and production in sea and coastal areas. Moreover this research is supported by the Zeeuwse Tong Project (Zeeland Sole Project), co-funded by the European Fisheries Fund. The funders had no role in the study design, data collection and analysis, decision to publish, or preparation of manuscript.
Competing Interests:The authors have declared that no competing interests exist.
* E-mail: [email protected]
Introduction
Dover Sole (Solea solea) has a high potential for commercial aquaculture in Europe because of its consumer popularity and high market values [1,2]. Currently, larvae of cultured sole are produced by natural reproduction of captured wild broodstock. Despite attempts for selective breeding and optimization of diets attractiveness, the species is still in an early stage of domestication. Possibly this explains the variable and low growth of sole in culture conditions, which remains one of the most important economic constraints for commercial sole in aquaculture [1,2,3,4,5].
Individual differences in growth are common in cultured animals, but fish generally show more pronounced variability than other livestock animals, with body weights ranging from 20– 40% of the mean for most fish species [6]. Also in cultured sole, high growth variations have been reported, 30–50% forSolea solea [7] and 24–29% forSolea senegalensis[8].
Individual fish often show pronounced variation in both growth and behaviour within a group [9,10,11,12,13]. Most studies on individual differences in growth have focused on social interactions
explained in terms of the changing trade-off between foraging and predator avoidance in nature [27,28].
In nature, under predation risk, prey animals, such as young fish, face a conflict between two competing motivations: hunger and fear for predation. Studies on the foraging behaviour of prey species under predation risk show that individuals within a population show a continuum in their responses, from ‘‘bold’’ to ‘‘shy’’, representing different strategies in terms of survival. ‘‘Bold’’ animals show active foraging behaviour regardless of predation risk, while ‘‘shy’’ animals try to limit predation risk at the expense of foraging [29,30]. These coherent set of behavioural and physiological differences between individuals from the same population which are consistent over time and across situations are referred to as personality, coping styles, temperament or behavioural syndromes [31,32]. ‘‘Bold or proactive’’ (active coping or fight-flight response) animals are often characterized by being more aggressive, explorative and more active in unfamiliar situations whereas ‘‘shy or reactive’’ (passive coping or conserva-tion-withdrawal response) animals are considered to be more fearful or timid, and less active in the same situations [33]. These different ‘‘coping styles’’ result from genetic, environmental or ontogenetic factors and their interactions [34,35,36]. Previous studies have shown that innate behavioural and physiological traits represent different responses and adaptive strategies to environ-mental challenges [12]. Proactive individuals have a tendency to dominate and outcompete reactive ones in a stable environment with feed in excess. Nevertheless, the latter appear to respond better in an unpredictable or variable environment [31,37].
In nature, selection pressures on behaviour may vary across time as it depends on environmental circumstances which coping type will be in advantage, thus variation in behavioural strategies is maintained [38]. Farmed fish reared in captivity have no accessibility to shelter, are reared at high densities, with predictable food delivery, and in the absence of predators thus, it is suggested that bold individuals with high competitive ability, more active and with risk-prone feeding behaviour display higher growth rates [37,39]. Previous studies have reported positive associations between boldness and growth in captive or domesti-cated animals [27,40,41,42].
Sole utilizes a detection minimization strategy to reduce predation risk in nature: they match the colour of sediment [43], spend long times buried in it [44], show low activity levels [45] and nocturnal feeding [46]. Therefore, it is hypothesized that individual variation in risk-prone feeding behaviour and activity (bold versus shy fish), may be related with the behavioural flexibility/capacity of fish to adapt to captive conditions and therefore explaining high individual differ-ences in feed intake and thereby in growth of cultured sole.
This study aims to examine the inherent causes of individual variation in growth of sole(Solea solea). The objective is to assess whether individual variation in feeding and non-feeding behaviour may explain differences in feed intake/efficiency and growth of sole reared in captivity.
Materials and methods Ethics
All procedures involving animals were conducted in accordance with the Dutch law on experimental animals and were approved by the Ethical Committee for Animal Experiments (DEC) of Wageningen University.
Experimental animals and housing
Juvenile sole (Solea solea, N = 100, not selected for sex) with an initial weight of 59.566.5 g were obtained from a local
commercial farm (Solea BV, Ijmuiden, The Netherlands). Upon arrival fish were communally housed in one 400 L black tank of 26160.4 m (L6W6H) connected to a RAS system. The RAS system consisted of two sludge settlers and one bio-filter containing lava rock filled with artificial sea water (25%). Water temperature (17.860.1uC), pH (7.9–8.2), dissolved O2(.7 mg/l), salinity (256 0.1%), NH4+(,1 mg/ l) NO22(,1 mg/ l) and NO32(,50 mg/ l) were monitored daily. Ammonia, nitrite, nitrate were main-tained below this levels by exchanging sea water when necessary.
Fish were allowed to adapt to the experimental facilities for two weeks. After adaptation, they were individually weighted and PIT-tagged (Trovan ID100, DORSET GP, Aalten, Netherlands) while anesthetized with 2-phenoxyethanol (1 ml of solution/litre of system water).
The experimental period consisted of two growth periods, each of 28 days duration. During the first growth period, the 100 fish were group housed in the same 400 L tank. Based on the realized growth rate (GR, g/kg0.8/d) of this period, fish were categorized into eight different growth classes (Table 1). Two fish from each growth class were randomly selected. The 16 selected fish were individually housed in 30-L glass tanks (0.3060.560.3 m) during a second growth period to measure individual feed intake and behaviour in the absence of social interactions. Tanks were connected to the same RAS systems as before and side walls were covered with black plastic to avoid any visual contact between fish. At the end of both growth periods fish were weighed and behavioural tests were performed.
A 12D:12L photoperiod was maintained using artificial fluorescent lights. As juvenile sole are nocturnal feeders [46] the light regime was reversed with lights on from 21:00 h till 9:00 h. During the dark period of the day red lights were used to provide sufficient light to feed and to perform video recordings.
Feeding method
Fish were fed with a commercial feed diet, DAN-EX 1562 (DANA FEED A/S, Denmark, sinking pellet). Fish received 2 mm size pellets (61% protein, 20% fat and 24 kJ/g energy on dry matter basis) during period 1 and were switched to mm pellets (63% protein, 19% fat and 23 kJ/g energy on dry matter basis) during period 2 when fish had grown bigger.
During period 1 group housed fish were fed in access (between 0.5–1% body weight d21
) by an automated belt feeder, which distributed feed in two blocks of 3 hours. Feeding periods were from 9:00 h till 12:00 h and 13:00 h till 16:00 h. After each feeding all uneaten pellets were removed. To ensure feeding until apparent satiation daily rations were adjusted based on the feed intake of previous day.
The 16 individually housed fish in period 2 were hand fed three times a day at 8.00, 12.00 and 17.00 h until apparent satiation. For all fish the feeding period started with a feed ration of 15 pellets (0.27 g) and whenever pellets where eaten 5 extra pellets (0.09 g) were added. Through this procedure there would always be at least 5 pellets of feed in each tank during the feeding time. Feeding continued after pellet addition for a maximum of 20 minutes and five minutes later remaining pellets were siphoned and counted.
Live behavioural observations
frequency of burying attempts on the bare bottom (#/3 min) and frequency of escapes (#/3 min) were recorded following the ethogram presented in Table 2. In total 12 observations per fish were made.
Behavioural Tests
At the end of each growth period two sequential behavioural tests: ‘‘Novel Environment Test’’ and ‘‘Light avoidance Test’’, were performed to each fish individually during the dark phase of the day. Red lights were used as illumination to allow video recording. Twenty-four hours prior to the behavioural tests fish were not fed to increase their potential activity.
The testing was performed in two successive rounds. During each round eight random fish were screened individually in eight 120 L (0.660.560.4 m) glass barren-bottom tanks at the same time for the conduction of the tests. The test-tanks were filled up to 20 cm with water from the RAS system and were refreshed completely at the end of each testing round to avoid chemical cues to interfere in the behavioural response. The test-tanks were
visually isolated from each other by black acrylic sheets covering three sides of the tank. Each test-tank was divided into two equal sections (section A and B) by a plastic lid. Section A was open on the top and had a fluorescent light above, while section B was covered with a plastic lid on the top and was in complete darkness. Behavioural responses were recorded with two video cameras, one above and one on the side in section A of each tank.
During the ‘‘Novel Environment Test’’, fish were restricted to section A. The test started with the introduction of the fish into the test-tank after which fish were monitored for 15 min. The reaction of each fish to this new environment was analysed following the ethogram in Table 2.
The second test, the ‘‘Light avoidance test’’, started 45 minutes after the introduction of the fish into the test-tank. The test started with the opening of the connection to section B by lifting the plastic lid 12–15 cm and simultaneously increasing the light intensity in section A (approx. 600 Lux), whereas section B stayed dark (0 Lux). The behavioural response was recorded using the ethogram (Table 2) for a maximum of 15 minutes.
For each behavioural test the activity patterns were expressed as the percentage of total observation time. Burying and escapes bouts (frequency) were recorded during each test. Latency time to swim during the novel environment test and latency time to move towards section B during light avoidance test was measured as elapsed time in seconds from the time the test started. When no activity was performed at all during the 15 minutes of test, the fish was given as latency time a score of 15 minutes for statistical convenience. Total activity time was calculated as 100-Time resting (%).
Each test was performed twice with each fish, at the start and at the end of period 2. Due to technical problems (short-circuit) videos from 8 fish of the second testing day (end of period 2) were damaged and thus excluded from the analysis. Therefore, the data used for the behavioural analysis was the mean of all observations per fish. Video recordings from the behavioural tests were analysed using the ‘‘The Observer XT 9.0’’ software package (Noldus, Wageningen, The Netherlands).
Data analysis
In the present study, fish were considered as experimental unit. Growth rate (GR) and feed intake (FI) were expressed per
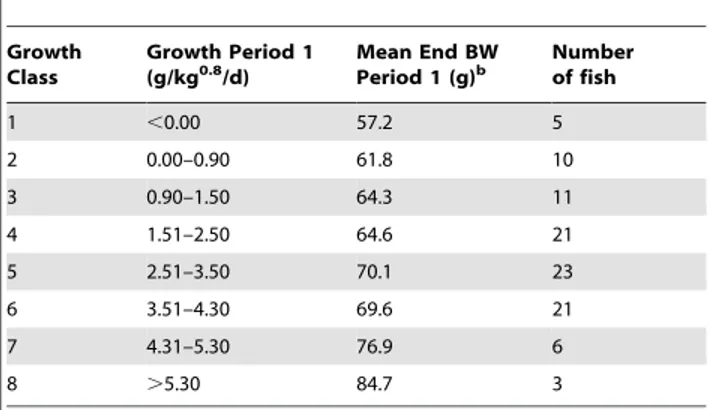
Table 1.Classification of fish based on their growth in period 1a.
Growth Class
Growth Period 1
(g/kg0.8/d) Mean End BWPeriod 1 (g)b Numberof fish
1 ,0.00 57.2 5
2 0.00–0.90 61.8 10
3 0.90–1.50 64.3 11
4 1.51–2.50 64.6 21
5 2.51–3.50 70.1 23
6 3.51–4.30 69.6 21
7 4.31–5.30 76.9 6
8 .5.30 84.7 3
aTwo random fish per growth class were selected.
bBW = Body weight is averaged over the total number of fish categorized in
each growth class.
doi:10.1371/journal.pone.0021393.t001
Table 2.Ethogram used for behavioural observations.
Behavioural
element Description
Live Observations
Novel Environment
Light Avoidance
Resting Lying motionless on the bottom or against the side of the tank without performing any other described behaviour (state event)
x x x
Swimming Displacement of the body using body or fin movement as propulsion (state event)
x x x
Small Movement Fish moves slowly with no real displacement of the body, maximum distance covered is,half of fish length (state event)
x x x
Burying Fish makes an attempt to bury by performing quick wave movements with its whole body (point event)
x x x
Escape Fish moves its body straight up in the water column and is pushing its head out of the water surface (point event)
x x x
Activity The total observation time minus the time spent resting x x x
latency time to swim
Time elapsed from the time the fish went to rest for the first time until it performs any other active behaviour
- x
-Latency to go to dark Time elapsed until the fish moves from Section A to Section B - - x
Time in dark Time the fish stays in the dark, section B - - x
metabolic body weight as units of g BW (kg)20.8 d21
. This was done to correct for the variation in fish size as it is known that larger fish have a greater absolute metabolic requirement of feed compared to smaller fish [47]. BW is the geometric mean of the weight calculated as:
BW~exp 1n=2 ln (ð W1)zln (W2)Þo, where W1 is the initial
weight (g) at the beginning of each growth period and W2the end weight at the end of each growth period. Feed conversion ratio (FCR) was calculated by dividing total feed intake by weight gain during the period.
Feed efficiency was analysed using RFI (g/kg0.8/d). RFI was calculated as the difference between feed consumed by an animal and its consumption as predicted from a linear regression model involving the maintenance requirements and growth as indepen-dent variables FI = M+bGR+e, where FI is the feed intake (g/ kg0.8/d), M is the maintenance (g/kg0.8/d) and GR the growth (g/ kg0.8/d) [48]. Animals with a low RFI (i.e. negative RFI) are assumed to be more feed efficient than animals with a high RFI (i.e. positive RFI).
Coefficient of variation (CV, %) was calculated as CV = s m
100, wheresis the standard deviation andmthe observation mean. The CV of feed intake between days (FIdays, %) was calculated using the standard deviation of FI between days and the average FI per day. The CV of feed intake between meals within days (FImeals, %) was calculated using the average standard deviation between meals in the day and the average FI per meal.
During the experiment one individually housed fish did not eat during period 2 (28 days starving) and was considered an outlier thus only data from 15 fish were included in the analysis.
Statistical analyses were performed using SAS system [49]. Data was analysed using linear regression models and performing Pearson’s correlations between quantitative traits or if qualitative traits were defined significant effects were analysed using one-way analysis of variance (ANOVA) followed by the Turkey’s HSD post-hoc test. The error terms of these analyses were tested for homogeneity of variances and normality, using the Levene’s test and the Shapiro-Wilk test, respectively. Behavioural data was squared rooted (frequencies) or log transformed (latencies) when necessary. Results were considered statistically significant when p-values were below 0.05. Data is reported as mean6SE.
Results
Growth during group housing conditions (Period 1) The average growth of all the fish when group housed was 2.5560.15 g/kg0.8/d (n = 100) and of the selected fish was 2.7060.49 g/kg0.8/d (n = 15), displaying a wide range in growth (CV = 70%) during period 1. Body weight of selected sole at the end of period 1 was of 69.2963.03 g (CV = 17%).
Growth and feed intake/efficiency of individually housed sole (Period 2)
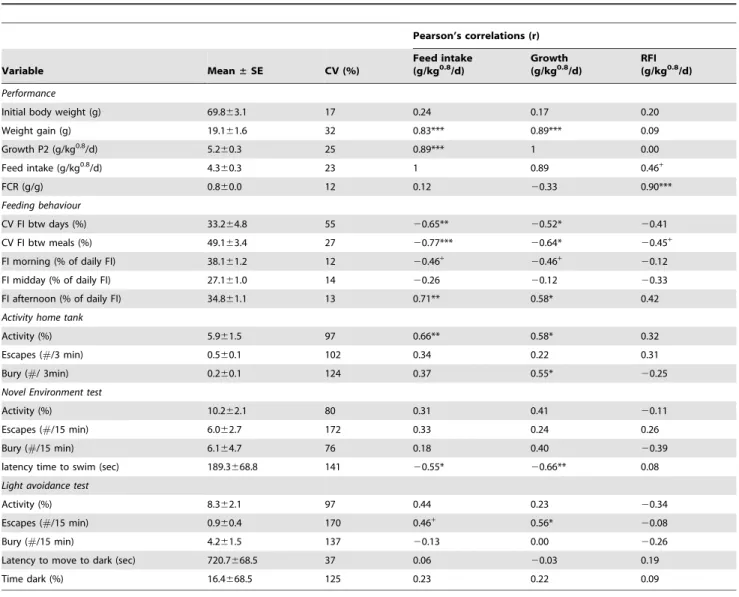
The average growth of the 15 individually housed fish was 5.260.3 g/kg0.8/d. Feed intake and FCR were of 4.360.3 and 0.8460.03 g/kg0.8/d, respectively (mean 6SE, Table 3). No significant correlation was found between growth of individually housed sole and initial body weight (r = 0.17, P.0.1). The fish still exhibited pronounced variation in growth (CV = 25%) and feed intake (CV = 23%) during period 2.
The growth (GR, in g/kg0.8/d) of sole juveniles individually housed was strongly correlated to individual differences in feed intake (FI, g/kg0.8/d) and was described through the regression equation FI = m + b*GR + e (m= 0.7960.52; b= 0.6860.09; R2= 0.79; P,0.001, Figure 1). According to the estimated linear
regression on average 79% of the individual variation in feed intake was explained by variation in growth. The remaining 21% of variation in feed intake is the residual feed intake (RFI, g/kg0.8/ d) which represents individual differences in feed efficiency and measuring errors. The average maintenance ration (m), feed intake at which growth is zero obtained from the regression line, was 0.7960.52 g/kg0.8/d.
Relationship between feeding behaviour and feed intake/efficiency and growth
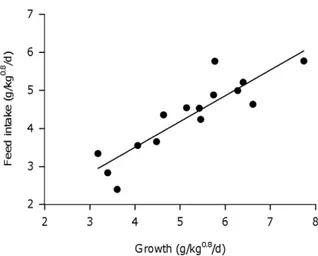
The feed intake of individually housed sole showed high variation between days and between meals within days with CV = 55% and 27%, respectively (Table 3). Differences in day to day variation in feed intake ranged from 14–85% and variation in feed intake between meals within a day varied from 38–75%.
The CV of feed intake between days (FIdays, %) and between meals within days (FImeals, %) was negatively correlated with feed intake (g/kg0.8/d) of sole (FI = 5.49–0.04*FIdays, R2= 0.43; P,0.01 and FI = 7.17–0.06*FImeals, R2= 0.60; P,0.001, Figure 2). Correspondingly a significant negative correlation was found between the CV of feed intake and growth (g/kg0.8/d) (Pearson’s correlations with FIdays and FImeals of r =20.52 and r =20.64, P,0.05, Table 3). However, no significant correlations were found with feed efficiency (RFI, g/kg0.8/d) (P.0.1, Table 3).
The feeding pattern within day showed that during the three meals given at 9:00, 12:00 and 17:00 h, sole consumed on average 38.161.2, 27.161.0 and 34.861.1% of their total FI respectively (means6SE, Table 3). Fish which showed a higher percentage of feeding at 17.00 h had higher feed intake (r = 0.71, P,0.01) and growth rate (r = 0.58, P,0.05) during period 2. Whereas fish which showed high feeding levels during the first meal of the day (9:00 h) tended to have a lower total feed intake and growth (r =20.46, P,0.1, Table 3). The percentage of FI during the midday meal (12:00 h) was significantly lower than the other two meals (P,0.05) and showed no significant relationship with feed intake or growth.
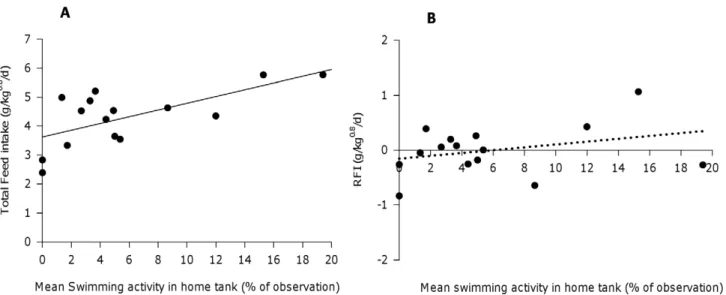
Relationship between swimming activity and feed intake/efficiency and growth
Feed intake was positively correlated with the average swimming time (SWIM, in %) during live observations in the tank (in between feeding periods) (FI = 3.63+0.12*SWIM, R2= 0.44, P,0.05). More-over, feed efficiency was not affected by differences in swimming activity (RFI =20.15+0.03*SWIM, R2= 0.1, P.0.1, Figure 3). Correspondingly, a positive correlation was found with growth (r = 0.58, P,0.05, Table 3). Active swimmers were also feeding more consistently with a significantly lower CV of feed intake between meals within days (r =20.61, P,0.05) and a trend for lower CV of feed intake between days (r =20.47, P,0.1, Table 3).
Sole that were escaping during live observations (n = 10 fish) had higher feed intake than fish which did not (n = 5 fish) (FI: 4.760.3 versus 3.660.4 g/kg0.8/d, P,0.05, Table 4). However, fish escaping during observations also tended to be less feed efficient compared to those that were not seen displaying this behaviour (RFI: 0.160.1 vs.
20.360.2 g/kg0.8/d, P,0.1, Table 4) but no significant differences were found regarding growth (P.0.1, Table 4).
The frequency of burying in the barren tank during live observations was positively correlated with growth but not with feed intake (r = 0.55, P,0.05 and r = 0.37, P.0.1, Table 3).
Boldness during behavioural tests and its relationship with feed intake/efficiency and growth
traits ranging from 36–170% (Table 3). Behavioural tests were relatively consistent in time with Pearson’s correlation of individual behavioural responses between both testing periods ranging from 0.4–0.7. Individual’s responses to novelty and to light showed to be related with their feed intake and growth in captivity.
1. Novel environment test. Sole responded to a new environment with a swimming activity of 10.262.1% of observation, with on average of 6.062.7 escapes and 6.164.7of burying attempts (Table 3). The average latency time to swim and to start exploring the new environment (as a measure of boldness) was 189669 sec, and was negatively correlated with total feed intake (r =20.55, P,0.05) and growth (r =20.66, P,0.01, Table 3). Sole which responded with escaping (n = 10 fish) did not show a significance difference in growth compared to sole which did not escape (n = 5 fish) (P.0.1, Table 4).
2. Light avoidance test. Sole subjected to the ‘‘Light avoidance test’’ showed in the illuminated area an average activity of 8.362.1% of observation, and displayed on average 0.960.4 escapes and 4.2 61.5 burying attempts. The average latency to go to the dark section of the tank (section B) was 720.7668.5 seconds and the total time in the dark was of 16.465.3% (Table 3). Sole showed two opposite coping styles when exposed to a high light intensity: 1) Proactive fish which escaped and, 2) Reactive fish which remained in the bottom. The frequency of escaping during the light test tended to be positively correlated with feed intake (P,0.1, Table 3) and significantly with growth (P,0.05, Table 3). However, no significant relationship was found with feed efficiency (P.0.1, Table 3). Sole which responded with escaping (n = 5 fish) had a higher growth compared to sole which did not escape (n = 10 fish) (6.160.5 vs. 4.760.4 g/kg0.8/d, P,0.05, Table 4).
Table 3.Pearson’s correlations between growth, feed intake, feed efficiency (RFI), and behaviour of individually housed sole (n = 15).
Pearson’s correlations (r)
Variable Mean±SE CV (%)
Feed intake (g/kg0.8/d)
Growth (g/kg0.8/d)
RFI (g/kg0.8/d)
Performance
Initial body weight (g) 69.863.1 17 0.24 0.17 0.20
Weight gain (g) 19.161.6 32 0.83*** 0.89*** 0.09
Growth P2 (g/kg0.8/d) 5.2
60.3 25 0.89*** 1 0.00
Feed intake (g/kg0.8/d) 4.360.3 23 1 0.89 0.46+
FCR (g/g) 0.860.0 12 0.12 20.33 0.90***
Feeding behaviour
CV FI btw days (%) 33.264.8 55 20.65** 20.52* 20.41
CV FI btw meals (%) 49.163.4 27 20.77*** 20.64* 20.45+
FI morning (% of daily FI) 38.161.2 12 20.46+
20.46+
20.12
FI midday (% of daily FI) 27.161.0 14 20.26 20.12 20.33
FI afternoon (% of daily FI) 34.861.1 13 0.71** 0.58* 0.42
Activity home tank
Activity (%) 5.961.5 97 0.66** 0.58* 0.32
Escapes (#/3 min) 0.560.1 102 0.34 0.22 0.31
Bury (#/ 3min) 0.260.1 124 0.37 0.55* 20.25
Novel Environment test
Activity (%) 10.262.1 80 0.31 0.41 20.11
Escapes (#/15 min) 6.062.7 172 0.33 0.24 0.26
Bury (#/15 min) 6.164.7 76 0.18 0.40 20.39
latency time to swim (sec) 189.3668.8 141 20.55* 20.66** 0.08
Light avoidance test
Activity (%) 8.362.1 97 0.44 0.23 20.34
Escapes (#/15 min) 0.960.4 170 0.46+ 0.56*
20.08
Bury (#/15 min) 4.261.5 137 20.13 0.00 20.26
Latency to move to dark (sec) 720.7668.5 37 0.06 20.03 0.19
Time dark (%) 16.4668.5 125 0.23 0.22 0.09
Significant differences are indicated by ***p,0.001;
**p,0.01; *p,0.05;
+p,0.1.
Discussion
The present study showed that sole(Solea solea)housed individually, in the absence of social interactions, still exhibits high individual differences in feed intake, growth and behaviour (on average CV of 23, 25 and 100% respectively), which has also been observed in other species when held in isolation [9,10,11,50]. Growth variation of sole housed individually was lower than when communally held in a group of 100 fish (CV was 25% in period 2 compared to 70% in period 1, P,0.05). This results are in line with studies in other fish species were the reported variation in feed consumption within grouped fish showed a marked increase compared to variation in feed intake when fish were held in isolation, on average 60–100% versus 25–40% [16,24,51,52]. There are three main causes of phenotypic variation among individuals in a population: 1) genetic; 2) environmental; 3) interaction between genetic and environmental factors. In this study, individual differences were measured in the absence of social interactions and with equal and predominantly constant
environ-mental conditions, which suggests that differences in feed intake, growth and behaviour have a genetic basis.
This study showed that under ad libitum conditions and individual housing, differences in feed intake account for 79% of the observed individual differences in the growth of sole. These results are in agreement with other studies in fish showing that the variation in the growth of fish is mainly due to variation in feed intake [16,19,24,53]. Data on individual feed intake of sole on dry feed is limited in literature and generally difficult to compare as feed intake depends on the respective diet nutrients, feeding protocol, size of the fish, temperature and origin of the fish. However, our results (4.3 g/kg0.8/d or 0.87%/d) are comparable to feed intake of grouped housed Solea solea of similar weight class from studies of S. Ende et al., 2009 (Personal communication) and [54]. Mean growth rate in this study (5.2 g/kg0.8/d or 0.86%/d) is within the higher level of displayed growth of grouped housed Solea solea with values in literature ranging from 0.86–0.3%/d [54,55,56].
Feeding behaviour was expressed as individual differences in feeding consistency over time and the daily feeding pattern: the coefficient of variation of intra-individual feed intake between days and between meals in the day was measured. A low CV indicated that the meal size or feed intake of an individual fish was similar from day to day and/or between the daily meals whilst a high CV indicated a more varied feed intake. Variation in feed intake
between days is caused by a combination of endogenous and exogenous factors which can influence appetite and it appears to be a common feature of feeding in fish [24,57]. The observed individual variations in CV of feed intake between days (14–85%) in sole were quite high compared to studies in other species held in isolation such as carp, with ranging values of 16–22% [24] or with minnows with values ranging from 21–27% [58]. Moreover, the present results show that fish which feed more consistently over time (within day and over days), show higher feed intake and growth but also tend to be less feed efficient. The influence that the regularity of feeding has on growth and feed efficiency is yet not well understood. However, it has been reported that the rate of protein synthesis is correlated with growth, which accounts for large proportion of total energy costs in fish and thus contributing to individual variations in growth efficiency [22,59]. These Figure 1. Relationship between feed intake (g/kg0.8/d) and
growth (g/kg0.8/d) of 15 individually housed sole. (FI = 0.79+
0.68*GR, R2= 0.79, P
,0.001).
doi:10.1371/journal.pone.0021393.g001
Figure 2. Relationship between total feed intake (g/kg0.8/d) and the CV of feed intake between days (A) and between meals within days (B).Regression equations are A) y = 5.4920.046(R2= 0.43, P,0.01) and B) y = 7.1720.066(R2= 0.60, P,0.001).
findings are in accordance with a study in grass carp where fish with larger variability in feed intake had lower growth rates and hence lower rates of protein synthesis [24]. Recent studies also reported that differences in feed efficiency (residual feed intake) were related to the feeding motivation in African catfish [11] and to feeding activity in Nile Tilapia [53]. Additionally, we found that the daily feeding pattern also explained variation in feed consumption and growth of sole. Fish which showed a higher percentage of feeding during the last meal of the day (afternoon meal at the end of dark period, 17.00 h) had higher feed intake and growth. In line with our results, studies on other flatfish showed that individual variations in the feeding behaviour of halibut were stable across time and situations and were related to feed intake and growth [12]. The feeding rhythm of sole can be described by two major meals: one in the morning and one in the afternoon (at the beginning and the end of the dark period), where feed intake was significantly higher than during the midday meal. These results agree with other studies in which juvenile sole were found to have two main activity/feeding peaks during the night, one at sunset and another shortly before dawn [46,60]. Other
species, such as Atlantic salmon, also show feed intake peaks during the early morning and late afternoon [61].
Results suggests that for sole endogenous factors already explain high individual differences in food consumption, which indicate consistent differences in feeding strategies between individuals. Individual differences in feeding behaviour could be related to differences in the behavioural flexibility (or adaptive capacity) between fish to feed and grow in captivity, where coping styles might play an important role, as bold or active fish were also found to feed more consistently.
Active sole had significantly higher feed intake and growth, which agrees with results on Chinese sturgeon [10]. Activity time was not correlated with feed efficiency (RFI), thus individual differences in maintenance costs due to different activity levels in sole seem to have a relative small effect on RFI. In accordance, other studies highlighted that flatfish probably spend relatively less energy in swimming and allocate more food energy on growth than (pelagic) round fish [62]. The high feed intake of active fish might be due to the fact that individuals that spend more time swimming have higher appetite and increase their feed intake which may Figure 3. Relationship between swimming activity (%) in the home tank and A) total feed intake (g/kg0.8/d) and B) residual feed intake (g/kg0.8/d) of 15 individually housed sole.Regression equations are A) FI = 3.63
+0.12*SWIM (R2= 0.44, P,0.05) for feed intake and B) RFI =20.15+0.03*SWIM (R2= 0.10, P.0.1) for residual feed intake.
doi:10.1371/journal.pone.0021393.g003
Table 4.Comparison of growth, feed intake and feed efficiency (RFI) between fish displaying escape behaviour (present vs.
absent)b.
Home tank observations Novel environment test Light avoidance test
Variable
Escape (n = 10)
No Escape
(n = 5) P
Escape (n = 10)
No Escape
(n = 5) P
Escape (n = 5)
No Escape
(n = 10) P
Growth P2
(g/kg0.8/d) 5.560.4 4.660.6 ns 5.460.4 4.760.6 ns 6.160.5 4.760.4 *
Feed intake (g/kg0.8/d) 4.7
60.3 3.660.4 * 4.560.3 4.060.5 ns 4.960.4 4.060.3 ns RFIa
(g/kg0.8/d) 0.160.1 20.360.2 + 20.0160.15 0.0260.21 ns 20.0660.21 0.0360.15 ns
Values are means6SE. Significant differences are indicated by; *p,0.05;
+p,0.1; ns = not significant.
aRFI = Residual feed intake/feed efficiency.
overcompensate differences in maintenance costs. Another expla-nation for this can be that more active individuals are often seen as better competitors, expropriating resources from less active individuals [30]. Fish displaying escaping behaviour at the water surface also showed a higher feed intake, however tended to be less feed efficient and no differences in growth were found. This type of behaviour is considered to be indicative for abnormal or stereotypic behaviour in flatfish (reflecting a stressed state of the fish). Contrary to this, findings in Atlantic halibut showed that surface swimming was an indicator for low growth rate [63]. However, surface swimming in this case was a combination of escapes and swimming close to water surface as it was measured with a pit antenna, thus the behaviour measured is a different behavioural trait. Furthermore, halibut were group housed, so this behaviour could have also been triggered by social interactions. Both behaviour and housing conditions were different, thus the comparison between results from both studies is difficult.
Moreover, boldness of sole measured as the reaction to an unknown/novel environment and to a sudden increase in light intensity proved to be related to feed intake and growth but not with feed efficiency (RFI). Sole which resume activity earlier in a novel environment and those that reacted escaping when confronted with a light stimulus had higher feed intake and growth. These results suggest that individual differences in behaviour when confronted to environmental challenges explain individual variations in feeding behaviour and growth, where proactive sole seem to be more successful in their feeding behaviour and thus display higher growth under captive conditions. Accordingly, animal personality traits, such as boldness, activity and aggressiveness have been reported in many species and have been found to be also positively correlated with feed intake or growth in captivity: Wilson et al.(1993) developed the shy-bold continuum for juvenile pumpkinseed sunfish with positive correlations between predator inspection, speed acclimation to the laboratory, foraging behaviour and parasitic infection [33]. Boldness towards predators was also positively correlated with growth and dispersal in killifish [29] and activity, foraging and growth in larval salamanders [64]. Salmonid fish also show individual variation in behaviours such as space use [65], boldness [42], and aggressiveness
[66] where behavioural characteristics proved to be related with growth differences [41,42] . Studies on Paradise fish, found that behavioural responses to a Novel environment were highly inherited [35,36]. Thus, as coping styles seem to have a genetic base [32] these results suggest that selecting for growth in fish under such conditions will promote risk-prone feeding behaviour and high activity in tanks.
Conclusion
The wide inherent individual variations in behaviour, feed intake and growth of sole suggest scope for improvement in sole aquaculture. Individual differences in feeding consistency, swim-ming activity and behavioural reactions under challenging situations (novel environment; increased light intensity) explain variations in feed intake and growth. Both feeding consistency and escaping behaviour also tended to explain differences in feed efficiency (RFI). These results suggest the existence of coping styles in sole which can influence their adaptive capacity to farming conditions: Proactive fish seem to have a more successful feeding strategy in captivity, displaying higher feed intake and growth . Therefore, behavioural traits may be of interest to have into account for selection in breeding programs. Additionally, high feed intake was related with the presence of more escaping behaviour which has been considered to be stereotypical behaviour in flatfish (reflecting a stressed state of the fish) which might be of importance when considering welfare and performance of fish in captivity.
Acknowledgments
The authors are very grateful to Johan Verreth and Johan van Arendonk for their constructive comments, and Menno ter Veld and the personnel of experimental facility ‘De Haar Vissen’, for their assistance in conducting the experiment.
Author Contributions
Conceived and designed the experiments: JM HK OS SV JS. Performed the experiments: JM SV. Analyzed the data: JM SV JS. Contributed reagents/materials/analysis tools: JM HK OS JS. Wrote the paper: JM HK OS JS.
References
1. Howell BR (1997) A re-appraisal of the potential of the sole,Solea solea(L.), for commercial cultivation. Aquaculture 155: 355–365.
2. Imsland AK, Foss A, Conceic¸a˜o LEC, Dinis MT, Delbare D, et al. (2003) A review of the culture potential ofSolea soleaandS. senegalensis. Reviews in Fish Biology and Fisheries 13: 379–408.
3. Exadactylos A, Geffen AJ, Thorpe JP (1998) Population structure of the Dover sole, Solea solea L., in a background of high gene flow. Journal of Sea Research 40: 117–129.
4. Dinis MT, Ribeiro L, Soares F, Sarasquete C (1999) A review on the cultivation potential of Solea senegalensis in Spain and in Portugal. Aquaculture 176: 27–38. 5. Howell BR, Conceic¸a˜o LEC, Prickett R, Can˜avate JP, Man˜anos E (2009) Sole
farming: nearly there but nor quite?! Aquaculture Europe 34(1): 24–26. 6. Gjedrem T (2000) Genetic improvement of cold-water fish species. Aquaculture
Research 31: 25–33.
7. Blonk RJW, Komen H, Kamstra A, van Arendonk JAM (2010) Effects of grading on heritability estimates under commercial conditions: A case study with common sole,Solea solea. Aquaculture 300: 43–49.
8. Araga˜o C, Corte-Real J, Costas B, Dinis MT, Conceic¸a˜o LEC (2008) Stress response and changes in amino acid requirements in Senegalese sole (Solea senegalensis; Kaup 1858). Amino Acids 34: 143–148.
9. Wang N, Hayward RS, Noltie DB (1998) Variation in food consumption, growth, and growth efficiency among juvenile hybrid sunfish held individually. Aquaculture 167: 43–52.
10. Quian X, Cui Y, Xie S, Lei W, Zhu X, et al. (2002) Individual variations in growth, food intake and activity in juvenile Chinese sturgeonAcipenser sinensis Gray. Applied Ichthyology 18: 695–698.
11. Martins CI, Schrama JW, Verreth JAJ (2005) The consistency of individual differences in growth, feed efficiency and feeding behaviour in African catfish Clarias gariepinus(Burchell 1822) housed individually. Aquaculture Research 36: 1509–1516.
12. Kristiansen TS, Ferno¨ A (2007) Individual behaviour and growth of halibut (Hippoglossus hippoglossusL.) fed sinking and floating feed: Evidence of different coping styles. Applied Animal Behaviour Science 104: 236–250.
13. Berghahn R, Lu¨demann K, Ruth M (1995) Differences in individual growth of newly settled 0-group plaice (Pleuronectes PlatessaL.) in the intertidal of neighbouring wadden sea areas. Netherlands Journal of Sea Research 34: 131–138. 14. Ryer CH, Olla BL (1996) Growth depensation and aggression in laboratory
reared coho salmon: the effect of food distribution and ration size. Journal of Fish Biology 48: 686–694.
15. Metcalfe NB (1986) Intraspecific variation in competitive ability and food intake in salmonids: consequences for energy budgets and growth rates. Journal of Fish Biology 28: 525–531.
16. Jobling M, Baardvik BM (1994) The influence of environmental manipulations on inter- and intra- individual variation in food acquisition and growth performance of Arctic charr, Salvelinus alpinus. Journal of Fish Biology 44: 1069–1087.
17. Cutts CJ, Betcalfe NB, Caylor AC (1998) Aggression and growth depression in juvenile Atlantic salmon: the consequences of individual variation in standard metabolic rate. Journal of Fish Biology 52: 1026–1037.
18. Jobling M (1985) Physiological and social constraints on growth of fish with special reference to Arctic charr,Salvelinus alpinusL. Aquaculture 44: 83–90. 19. Koebele BP (1985) Growth and the size hierarchy effect: an experimental
assessment of three proposed mechanisms; activity differences, disproportional food acquisition, physiological stress. Environmental Biology of Fishes 12: 181–188.
20. Jobling M, Wandsvik A (1983) Effect of social interactions on growth rates and conversion efficiency of Artic charr,Salvelinus alpinusL. Journal of Fish Biology 22: 577–584.
22. McCarthy ID, Houlihan DF, Carter CG (1994) Individual Variation in Protein Turnover and Growth Efficiency in Rainbow Trout, Oncorhynchus mykiss (Walbaum). Proceedings: Biological Sciences 257: 141–147.
23. Grima L, Chatain B, Ruelle F, Vergnet A, Launay A, et al. (2010) In search for indirect criteria to improve feed utilization efficiency in sea bass (Dicentrarchus labrax): Part II: Heritability of weight loss during feed deprivation and weight gain during re-feeding periods. Aquaculture 302: 169–174.
24. Carter CG, Houlihan DF, McCarthy ID, Brafield AE (1992) Variation in the food intake of grass carp,Ctenopharyngodon idella(Val.), fed singly or in groups. Aquat Living Resour 5: 225–228.
25. Bridcut E, Giller S (1995) Diet variability and foraging strategies in brown trout (Salmo trutta): an analysis from subpopulations to individuals. Can J Fish Aquat Sci 52: 2543–2552.
26. Gotceitas V (1990) Foraging and Predator Avoidance: A Test of a Patch Choice Model with Juvenile Bluegill Sunfish. Oecologia 83: 346–351.
27. Biro PA, Abrahams MV, Post JR, Parkinson EA (2006) Behavioural trade-offs between growth and mortality explain evolution of submaximal growth rates. Journal of Animal Ecology 75: 1165–1171.
28. Lima SL, Dill LM (1990) Behavioral decisions made under the risk of predation: a review and prospectus. Can J Zool 68: 619–640.
29. Fraser DF, Gilliam JF, Daley MJ, Le AN, Skalski GT (2001) Explaining Leptokurtic Movement Distributions: Intrapopulation Variation in Boldness and Exploration. The American Naturalist 158: 124–135.
30. Werner EE, Anholt BR (1993) Ecological Consequences of the Trade-Off between Growth and Mortality Rates Mediated by Foraging Activity. The American Naturalist 142: 242.
31. Sih A, Bell A, Johnson JC (2004) Behavioural syndromes: an ecological and evolutionary overview. Trends in Ecology & Evolution 19: 372–378. 32. Koolhaas JM, Korte SM, De Boer SF, Van Der Vegt BJ, Van Reenen CG, et al.
(1999) Coping styles in animals: current status in behavior and stress-physiology. Neuroscience & Biobehavioral Reviews 23: 925–935.
33. Wilson DS, Coleman K, Clark AB, Biederman L (1993) Shy-Bold Continuum in Pumpkinseed Sunfish (Lepomis gibbosus): An Ecological Study of a Psychological Trait. Journal of Comparative Psychology 107: 250–260.
34. Caro TM, Bateson P (1986) Organization and ontogeny of alternative tactics. Animal Behaviour 34: 1483–1499.
35. Gerlai R, Crusio WE, Csa´nyi V (1990) Inheritance of species-specific behaviors in the paradise fish (Macropodus opercularis): A diallel study. Behavior Genetics 20: 487–498.
36. Gervai J, Csa´nyi V (1985) Behavior-genetic analysis of the paradise fish, Macropodus opercularis. I. Characterization of the behavioral responses of inbred strains in novel environments: A factor analysis. Behavior Genetics 15: 503–519. 37. Huntingford FA (2004) Implications of domestication and rearing conditions for
the behaviour of cultivated fishes. Journal of Fish Biology 65: 122–142. 38. Dingemanse NJ, Re´ale D (2005) Natural selection and animal personality.
Behaviour 142: 1159–1184.
39. Huntingford FA, Adams C (2005) Behavioural syndromes in farmed fish: implications for production and welfare. Behaviour 142: 1207–1221. 40. Biro PA, Stamps JA (2008) Are animal personality traits linked to life-history
productivity? Trends in Ecology & Evolution 23: 361–368.
41. Johnsson JI, Petersson E, Jo¨nsson E, Bjo¨rnsson BT, Ja¨rvi T (1996) Domestication and growth hormone alter antipredator behaviour and growth patterns in juvenile brown trout,Salmo trutta. Can J Fish Aquat Sci 53: 1546–1554. 42. Sundstro¨m LF, Petersson E, Ho¨jesjo¨ J, Johnsson JI, Ja¨rvi T (2004) Hatchery
selection promotes boldness in newly hatched brown trout (Salmo trutta): implications for dominance. Behavioral Ecology 15: 192–198.
43. Ryer CH, Lemke JL, Boersma K, Levas S (2008) Adaptive coloration, behavior and predation vulnerability in three juvenile north Pacific flatfishes. Journal of Experimental Marine Biology and Ecology 359: 62–66.
44. Ellis T, Hoowell BR, Hughes RN (1997) The cryptic responses of hatchery-reared sole to a natural sand substratum. Journal of Fish Biology 51: 389–401. 45. Burrows MT, Gibson RN (1995) The effects of food, predation risk and endogenous rhythmicity on the behaviour of juvenile plaice,Pleuronectes platessaL. Animal Behaviour 50: 41–52.
46. Lagarde`re JP (1987) Feeding ecology and daily food consumption of common sole,Solea vulgarisQuensel, juveniles on the French Atlantic coast. Journal of Fish Biology 30: 91–104.
47. Hepher B (1988) Nutrition of Pond Fishes. Cambridge: Cambridge University Press. 388 p
48. Luiting P, Urff EM (1991) Optimization of a model to estimate residual feed consumption in the laying hen. Livestock Production Science 27: 321–338. 49. SAS (2002) SASOnlineDoc, Version 9.1. Cary, NC, USA: SAS Institute Inc. 50. Ragland GJ, Carter PA (2004) Genetic covariance structure of growth in the
salamanderAmbystoma macrodactylum. Heredity 92: 569–578.
51. McCarthy ID, Carter CG, Houlihan DF (1992) The effect of feeding hierarchy on individual variability in daily feeding of rainbow trout,Oncorhynchus mykiss (Walbaum). Journal of Fish Biology 41: 257–263.
52. Jobling M, Baardvik BM, Jørgensen EH (1989) Investigation of food-growth relationships of Arctic charr,Salvelinus alpinusL., using radiography. Aquaculture 81: 367–372.
53. Martins CIM, Conceic¸a˜o LEC, Schrama JW (2011) Feeding behavior and stress response explain individual differences in feed efficiency in juveniles of Nile tilapiaOreochromis niloticus. Aquaculture 312: 192–197.
54. Fonds M, Drinkwaard B, Resink JW, Eysink GGJ, Toet W (1989) Measurements of metabolism, food intake, and growth ofS. solea(L.) fed with muscle meat or with dry food. Aquaculture - A biotechnology in progress Eds N De Pauw, E Jaspers, H Ackefors, N Wilkins (Eds) European Aquaculture Society, Bredene, Belgium.
55. Overton JL, Steenfeldt SJ, Pedersen PB (2010) The effects of grading on the growth and survival of juvenile Dover sole (Solea soleaL.). Aquaculture Research 42: 31–39.
56. Schram E, Van der Heul JW, Kamstra A, Verdegem MCJ (2006) Stocking density-dependent growth of Dover sole (Solea solea). Aquaculture 252: 339–347. 57. Smagula C, Adelman CB (1982) Day-to-day variation in food consumption by largemouth bass. Transactions of the American Fisheries Society 111: 543–548. 58. Cui Y, Wootton RJ (1988) Effects of ration, temperature and body size on the body composition, energy content and condition of the minnow,Phoxinus phoxinus (L.). Journal of Fish Biology 32: 749–764.
59. Carter CG, Brafield AE (1991) The bioenergetics of grass carp,Ctenopharyngodon idella(Val.): energy allocation at different planes of nutrition. Journal of Fish Biology 39: 873–887.
60. De Groot SJ (1971) On the interrelationships between morphology of the alimentary tract, food and feeding behaviour in flatfishes (pisces: pleuronecti-formes). Netherlands Journal of Sea Research 5: 121–196.
61. Kadri S, Metcalfe NB, Huntingford A, Thorpe JE (1997) Daily feeding rhythms in Atlantic salmon II. Size related variation in feeding patterns of post-smolts under constant environmental conditions. Journal of Fish Biology 50: 273–279. 62. Fonds M, Cronie R, Vethaak AD, Van Der Puyl P (1992) Metabolism, food consumption and growth of plaice (Pleuronectes platessa)and flounder (Platichthys flesus) in relation to fish size and temperature. Netherlands Journal of Sea Research 29: 127–143.
63. Kristiansen TS, Ferno A, Holm JC, Privitera L, Bakke S, et al. (2004) Swimming behaviour as an indicator of low growth rate impaired welfare in Atlantic halibut (Hippoglossus hippoglossusL.) reared at three stocking densities. Aquaculture. pp 137–151.
64. Sih A, Kats LB, Maurer EF (2003) Behavioural correlations across situations and the evolution of antipredator behaviour in a sunfish-salamander system. Animal Behaviour 65: 29–44.
65. Lahti K, Laurila A, Enberg K, Piironen J (2001) Variation in aggressive behaviour and growth rate between populations and migratory forms in the brown trout,Salmo trutta. Animal Behaviour 62: 935–944.
66. Armstrong JD, Braithwaite VA, Huntingford FA (1997) Spatial Strategies of Wild Atlantic Salmon Parr: Exploration and Settlement in Unfamiliar Areas. Journal of Animal Ecology 66: 203–211.