Relationship between residual feed intake and enteric methane emission in
Nellore cattle
Maria Eugênia Zerlotti Mercadante1, Ana Paula de Melo Caliman1, Roberta Carrilho Canesin1, Sarah Figueiredo Martins Bonilha1, Alexandre Berndt2, Rosa Toyoko Shiraishi Frighetto3,
Elaine Magnani1, Renata Helena Branco1
1 Instituto de Zootecnia, Centro Avançado de Pesquisa Tecnológica do Agronegócio de Bovinos de Corte, Sertãozinho, SP, Brasil. 2 Embrapa Pecuária Sudeste, São Carlos, SP, Brasil.
3 Embrapa Meio Ambiente, Jaguariúna, SP, Brasil.
ABSTRACT - Feed intake and average daily gain (ADG) in Nellore cattle were determined to calculate residual feed intake in two performance tests: first during the growth phase (RFIgrowth) and then during a measurement of the methane emission phase (RFImet). During the RFIgrowth test, 62 males and 56 females were classified as low-, medium-, and high-RFI. Enteric methane emission was measured in 46 animals; 23 males used for RFImet measurement plus 23 females (22 low-RFIgrowth and 24 high-RFIgrowth). Diet consisted of Brachiaria brizantha cv. Marandu hay (445 g/kg DM) and concentrate (555 g/kg DM). During the RFIgrowth and RFImet phases, DMI was lower in the animals with low RFI, with no difference in ADG. Residual feed intake was −0.359 and 0.367 kg DM/d for low- and high-RFI animals. Enteric methane emission (g/d, g/kg BW0.75 and g/kg ADG) did not differ between RFIgrowth classes.Enteric methane emission (g/d) was higher in high RFImet and lower in low RFImet males. Spearman correlations among traits obtained during both tests, which were high between metabolic BW (r = 0.959) and between DMI (r = 0.718), and zero between ADG (r = −0.062), resulted in moderate correlation between RFIgrowth and RFImet (r = 0.412).However, it is not possible to confirm that high-efficiency animals release less enteric methane, since different results were obtained when enteric methane was compared between the RFIgrowth and RFImet classes.
Key Words: beef cattle, enteric methane production, feed efficiency, performance, sulfur hexafluoride
ISSN 1806-9290
www.sbz.org.br R. Bras. Zootec., 44(7):255-262, 2015
Received March 19, 2015 and accepted May 29, 2015. Corresponding author: mercadante@iz.sp.gov.br http://dx.doi.org/10.1590/S1806-92902015000700004
Copyright © 2015 Sociedade Brasileira de Zootecnia. This is an Open Access article distributed under the terms of the Creative Commons Attribution Non-Commercial License, which permits unrestricted non-commercial use, distribution, and reproduction in any medium, provided the original work is properly cited.
Introduction
Residual feed intake (RFI) is an attractive measure of feed efficiency, as it does not depend on body size, growth rate, or body composition measures (Durunna et al., 2012). High-efficiency animals exhibit low RFI and consume less feed than expected for maintenance and production, whereas low-efficiency animals have high RFI and observed feed intake higher than the predicted feed intake.
The possibility of improving production efficiency by exploiting the genetic variation in RFI and possible variation in traits related to emission of greenhouse gases is of great economic importance for beef cattle production. Studies have shown that selection of animals for low RFI (high feed efficiency) reduces methane emissions in cattle (Nkrumah et al., 2006; Hegarty et al., 2007; Fitzsimons et al., 2013). However, there are inconsistencies in relation to differences in feed intake and corresponding methane
emissions between low- and high-RFI animals. Fitzsimons et al. (2013) offered grass silage to heifers and observed that both DMI and methane emission (g/d) were lower for low-RFI compared with high-RFI animals, and Jones et al. (2011) reported that DMI was similar between divergent RFI groups and that methane emission was similar when animals grazed quality pastures but were lower for low-RFI compared with low-RFI animals when grazing high-quality pastures. The conflicting observations regarding the variation in methane emission of high- and low-efficiency animals between studies suggest that selection of cattle for increasing feed efficiency does not necessarily result in a reduction in methane emission (Freetly and Brown-Brandl, 2013). To date, published studies relating RFI and methane emission are limited to Bos taurus cattle, and little information is available on Bos indicus cattle.
In view of these considerations, the objective of the present study was to evaluate the relationship between enteric methane emission and residual feed intake in Nellore cattle fed a high-roughage diet.
Material and Methods
in accordance with Guidelines of Animal Welfare and Humane Slaughter (São Paulo State law number 11.977).
The study was conducted in Sertãozinho, northern region of the state of São Paulo, Brazil (21°10' South latitude and 48°5' West longitude). The climate of the region is tropical humid, with average annual temperature and rainfall of 24 °C and 1,312 mm, respectively.
For RFI identification, Nellore cattle born in 2010 were evaluated in individual performance tests, in an incomplete block design. One hundred eighteen animals, consisting of 62 males (starting at 261±23.1 d of age and 243±40.1 kg of BW) and 56 females (starting at 290±26.3 d of age and 216±30.8 kg BW), were evaluated for RFIgrowth to identify high- (low RFI), intermediate- (medium RFI) and low-efficiency (high RFI) animals. After RFIgrowth identification, enteric methane emission measurement was performed in 46 animals (23 males and 23 females). Next, in order to obtain an estimate of individual feed intake and RFI at the time of enteric methane emission measurement, a new RFI (RFImet) was calculated, but only in males (n = 23; starting at 351 d of age and 343 kg BW).
Animals were fed twice a day (08.00 h and 15.00 h), with ad libitum access to feed and water. The diet consisted of Brachiaria brizantha cv. Marandu hay (445 g/kg dry matter, DM), ground corn (322 g/kg DM), cottonseed meal (214 g/kg DM), urea (4.5 g/kg DM), and mineral salt (14.5 g/kg DM) (Table 1), for 0.800 kg/d of ADG (NRC, 2000).
Animals were housed in individual pens: one facility destined for males and two other facilities for females to fit the number of evaluated animals. Voluntary feed intake was calculated as the difference between feed supplied and refusals. The amount of feed offered was adjusted daily based on the intake observed on the previous day to
maintain refusals at about 10% of the feed supplied. Diet samples were collected at intervals of 28 d and the refusals per animal were weighed daily and sampled twice a week. The samples were stored in properly labeled plastic bags and frozen.
Samples of feed and refusals were oven-dried at 55 °C for 72 h and ground through a 1-mm screen (Wiley mill, Arthur Hill Thomas Co., Philadelphia, PA). These samples were analyzed for nitrogen (N) (AOAC Official Method 984.13), ash (AOAC Official Method 942.05), and EE (AOAC Official Method 920.39) contents, in accordance with the AOAC (1990). Neutral (NDF) and acid (ADFom) detergent fiber analyses were based on procedures described by Mertens (2002). Lignin (sa) was estimated as described by Van Soest and Robertson (1985). Gross energy was determined using an adiabatic bomb calorimeter (model 6300, Parr Instrument Company, Moline, IL, USA).
Two performance tests (males and females) were conducted to calculate RFIgrowth.For males, the performance test lasted 107 d, whereas for females it lasted 112 d (Figure 1). The adaptation periods were 35 and 28 d for males and females, respectively, and these data were not included in the RFIgrowth period. Therefore, serial BW and individual feed intake data were obtained for 72 (July 5 to September 14, 2011) and 83 d (August 3 to October 25, 2011) for males and females, respectively. The males’ ADG was determined based on two records per week on consecutive days at intervals of 14 d without fasting (total of 22 weight records). For females, individual BW records were obtained at intervals of 28 d, with deprivation of water and feed for 16 h (total of four weight records).
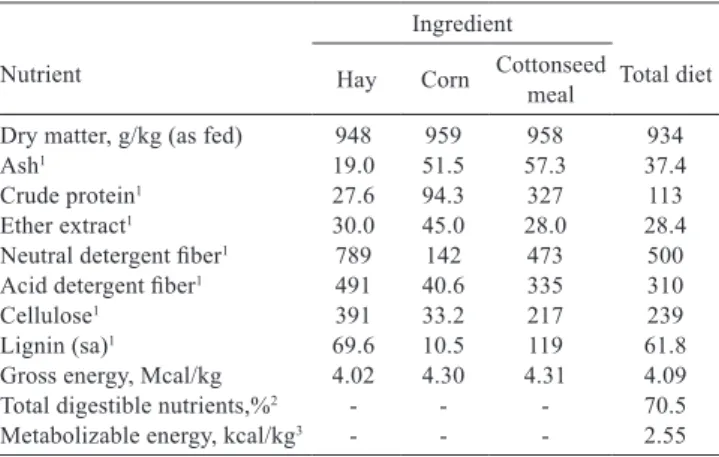
Table 1 - Nutrient composition of the ingredients and total diet offered to the animals during the period of evaluation of residual feed intake
Nutrient
Ingredient
Total diet Hay Corn Cottonseed meal
Dry matter, g/kg (as fed) 948 959 958 934
Ash1 19.0 51.5 57.3 37.4
Crude protein1 27.6 94.3 327 113
Ether extract1 30.0 45.0 28.0 28.4
Neutral detergent fiber1 789 142 473 500
Acid detergent fiber1 491 40.6 335 310
Cellulose1 391 33.2 217 239
Lignin (sa)1 69.6 10.5 119 61.8
Gross energy, Mcal/kg 4.02 4.30 4.31 4.09
Total digestible nutrients,%2 - - - 70.5
Metabolizable energy, kcal/kg3 - - - 2.55
1 Expressed as percentage of dry matter (g/kg DM). 2 Values calculated by Weiss’ equation (Weiss, 1999). 3 Values calculated by NRC (2000) level 2.
RFIgrowth - residual feed intake in the growth phase; RFImet - residual feed intake in
the methane emission phase.
After the RFIgrowth period, 23 males were sampled for RFImet analysis — 11 lowest RFIgrowth and 12 highest RFIgrowth. These animals continued for an additional 45 d in individual pens (including the period of methane collection) with daily records of DMI. However, to meet the herd selection criteria (Mercadante et al., 2003), one fasting weighing was performed on d 9, causing the first 13 d to be invalidated. Therefore, the performance test was conducted over the last 32 d (September 27 to October 30, 2011) (Figure 1). Average daily gain was determined based on nine weighing records of animals without previous fasting, which allowed for the calculation of a new RFI (RFImet), more representative of the methane-emission measurement period. This was done despite the fact that at least 63 d of evaluation are necessary to obtain accurate estimates of ADG (Wang et al., 2006).
Enteric methane emission (g/d) was measured in 46 animals (Figure 2) — 22 low-RFIgrowth animals (11 males and 11 females) and 24 high-RFIgrowth animals (12 males and 12 females). Data were collected for six consecutive days over a period of 24 h, from the 148th to the 153th day for males (October 25 to October 30, 2011) and from the 175th to the 181th day for females (November 21 to November 27, 2011) (Figure 1), using the sulfur hexafluoride (SF6) tracer gas technique as described by Johnson and Johnson (1995), adapted by Primavesi et al. (2004). The permeation tubes were filled with approximately 1.0 g SF6. To confirm the emission rate of SF6, the permeation tubes were kept in a water bath at 39 °C and weighed eight times to construct an 8-point regression curve. The tubes were administered orally to each animal in a random manner 4 d before the beginning of methane sampling.
Expired and eructated gases, together with ambient air, were sampled in 60-mm class 20 polyvinyl chloride (PVC) canisters through a stainless steel capillary tube (inner diameter: 0.127 mm) fixed to the halter of the animals. The sampling canisters were evacuated before placement into the animals and gases were analyzed about 5 d after sample collection, as the experiment was conducted far from the laboratory of gas analysis.
To correct atmospheric concentrations of methane inside the facility, gas samples were collected from ambient air with two sampling canisters per day (“blank”), hung at the entrance and exit of the facility. At the end of the sampling period, SF6 and CH4 concentrations in the samples were determined by gas chromatography using an HP6890 gas chromatograph equipped with a flame ionization detector (FID) and Plot HP-Al/M megabore column (0.53 μm, 30 m) for CH4, and with an electron capture detector (μ-ECD) and HP-MolSiv megabore column for SF6, using two 0.5-cm3
loops coupled to two 6-way valves. The canisters were pressurized with nitrogen 5.0 (White Martins, Praxair Inc) until reaching a pressure of approximately 1.2 atm. Pressure readings were obtained with a digital pressure meter. The calibration curves were constructed, using gas standards certified by White Martins (Praxair Inc), as described by Westberg et al. (1998). The flow rate of CH4 released by the animal was calculated in relation to the flow of SF6, correlating the results with the known release rate of SF6 in the rumen, subtracted from baseline CH4 concentrations (Westberg et al., 1998): QCH4 = QSF6 × ([CH4]Y − [CH4]B)/[SF6], in which QCH4= emission rate of CH4 by the animal; QSF6 = known release rate of SF6; [CH4]Y = concentration of CH4 in the canister; [CH4]B = concentration of CH4 in the blank; and [SF6] = concentration of sulfur hexafluoride in the canister. The equation of Blaxter and Clapperton (1965), corrected by Wilkerson et al. (1995), was used to calculate the loss of gross energy in the form of methane: CH4/GEI = [(CH4 × 0.0133)/GEI] × 100, in which GEI is the gross energy intake and 0.0133 is the gross energy in Mcal/g CH4 (Holter and Young, 1992).
Residual feed intake was calculated as the difference between observed DMI and DMI predicted by regressing DMI on ADG and average BW0.75 (Koch et al., 1963). The dry matter intake was calculated based on the mean of feed intake values obtained during each test period (RFIgrowth and RFImet) multiplied by the dry matter concentration of the diet. The average daily gain in each test was estimated as the linear regression coefficient of BW on j days of test: yi = α + β × Doti + εi, in which yi = BW in the i-th observation; α = intercept of the regression equation corresponding to the initial BW; β = linear regression coefficient corresponding
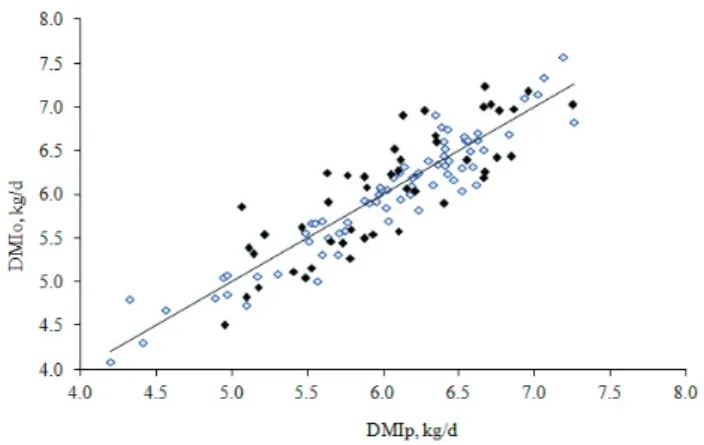
Open symbols represent all animals tested for residual feed intake during the growth phase (RFIgrowth; n = 118) and black solid symbols represent animals used for measurement of enteric methane emission (n = 46).
to ADG; Doti = days of test for the i-th observation; and εi = random error associated with each observation. The mean BW0.75 during the test was calculated as: BW0.75 = [α + β × (Dot / 2)]0.75, with α and β assuming the values obtained by the equation described above (Grion et al., 2014).
Residual feed intake was estimated using the following regression equation: DMI = βT × TG + βTA × TG × ADG + βTB × TG × BW0.75 + ε (i.e., RFI), in which βT, βTA, and βTB are regression coefficients of the classificatory variable test group (TG) and of the interactions between TG and the covariates ADG and BW0.75, respectively; and ε is the residual of the equation (i.e., RFI). TG is the test group [sex and two facilities only for females, TG = 1 (male, n = 62), 2 (female, n = 31), and 3 (female, n = 25)]. Animals were classified into three groups: low RFIgrowth (<mean – 0.5 SD; n = 40); medium RFIgrowth (± 0.5 SD of the mean; n = 42), and high RFIgrowth (>mean + 0.5 SD; n = 36), taking into consideration the standard deviation (SD) of the mean RFI (SD = 0.309 kg DMI for males and SD = 0.329 kg DMI for females). For RFImet,males were classified as low-RFI (<zero) and high-RFI (>zero), considering that the mean high-RFI is zero.
Variables were compared between two RFI classes (low and high) by the least square method. The statistical model included the effects of RFIgrowth class (low or high RFI) and sex (male or female), or the effect of RFImet class. The interaction between RFIgrowth class and sex was not significant for the analyzed variables and was therefore removed from the model. Spearman correlations were computed to compare ADG, DMI, BW0.75, and RFI across the two test periods for the male calves.
Results
No significant differences in initial BW, final BW, BW0.75, or ADG were observed between low- and high-RFI
growth animals (Table 2). RFIgrowth was −0.359 and 0.367 kg DM/d for low- and high-RFIgrowth animals, respectively, corresponding to a difference of 0.720 kg/d in DMI between high and low-efficiency animals. Animals classified as high-RFIgrowth consumed 11% more than low-RFIgrowth animals. Enteric methane emission (g/d and g/kg BW0.75) did not differ when compared between RFIgrowth classes (P>0.05). On the other hand, methane emission expressed as g/kg DMI was higher in low-RFIgrowth animals (P<0.001). No effect on enteric methane emission was found in RFIgrowth when expressed as g/kg ADG (P = 0.304) (Table 2).
After the RFImet test period (32 d), males were re-ranked as low- and high-RFImet (n = 23). The animals did not differ in terms of BW0.75 or ADG (P>0.05) between RFI
met classes. However, DMI was higher in bulls classified as high-RFImet
(8.12±0.14 kg/d) compared with the low-RFImet (7.09±0.17 kg/d). The same was observed for gross energy intake (GEI), which was 33.5±0.55 Mcal/d and 29.5±0.69 Mcal/d for high- and low-RFImet animals, respectively. Results of −0.506 and 0.362 kg DM/d were found for animals with low and high RFImet, respectively, with a variation of 0.868 kg/d in DMI between high and low-efficiency animals, corresponding to a 13% higher intake in high RFImet animals (Table 3). When methane emission (g/d) was compared between RFImet classes, it was higher for high RFImet than low RFImet animals (P<0.05). Methane emission (g/kg DMI and %GEI) did not differ between RFImet classes (P>0.05).
A positive correlation was observed for BW0.75 (r = 0.959) and DMI (r = 0.718) between RFIgrowth and RFImet, even considering the short duration of the RFImet test (32 d).
Table 2 - Performance traits, enteric methane emission, and feed efficiency of Nellore males and females classified as low- and high-residual feed intake (RFIgrowth)
Trait
RFIgrowth
P-value Low (n = 22) High (n = 24)
Initial BW, kg 238±6.83 236±6.54 0.795
Final BW, kg 297±7.01 293±6.72 0.693
BW0.75, kg 66.1±1.26 65.0±1.26 0.781
DMI, kg/d 5.66±0.120 6.38±0.120 <0.001
ADG, kg/d 0.754±0.020 0.744±0.020 0.810
RFI, kg DM/d −0.359±0.040 0.367±0.030 <0.001 Enteric methane emission
CH4, g/d 142±3.81 144±3.64 0.691
CH4, g/kg BW0.75 2.16±0.056 2.21±0.054 0.500 CH4, g/kg DMI 25.1±0.588 22.8±0.563 <0.001
CH4, g/kg ADG 191±7.99 203±7.65 0.304
BW - body weight; BW0.75 - metabolic body weight; DMI - dry matter intake; ADG - average daily gain; RFI - residual feed intake.
Table 3 - Performance traits, enteric methane emission, and feed efficiency of young Nellore males classified as low-and high-residual feed intake (RFImet)
Trait
RFImet
P-value Low (n = 9) High (n = 14)
Initial BW, kg 326±11.4 332±9.60 0.699
Final BW, kg 351±10.8 358±9.13 0.613
BW0.75, kg 78.9±1.90 80.2±1.60 0.611
DMI, kg/d 7.09±0.163 8.12±0.140 <0.001
GEI, Mcal/d 29.5±0.690 33.5±0.550 <0.001
ADG, kg/d 0.467±0.170 0.547±0.150 0.726
RFI, kg DM/d −0.506±0.076 0.362±0.064 <0.001 Enteric methane emission1
CH4, g/d 144±6.08 163±4.87 0.024
CH4, g/kg BW0.75 2.69±0.087 2.37±0.700 0.013
CH4, g/kg DMI 24.4±1.10 25.7±0.879 0.381
CH4, % GEI 6.49±0.200 6.46±0.160 0.937
CH4, g/kg ADG 186±10.7 191±8.57 0.689
However, a correlation close to zero was observed for ADG (r = −0.062) between test periods. Spearman correlation showed a positive association between RFIgrowth and RFImet (r = 0.412) (Table 4), with strong evidence of animal re-ranking between RFIgrowth and RFImet.
77% for heifers fed corn silage and a concentrate diet (Kelly et al., 2010). Apparently, in the present study, the coefficient of determination of the model used for the estimation of RFI is not associated with the dietary energy density, as reported by Fitzsimons et al. (2013). A lower coefficient of determination (R2 = 0.54) was obtained for the estimation of RFImet when the same diet was offered, explaining 54% of the variation in DMI. This value was higher than the 43% observed by Lancaster et al. (2009) for heifers fed alfalfa-based diet and concentrate, and the 38% observed by Freetly and Brown-Brandl (2013) for heifers fed a high-roughage diet. The short duration (32 d) of ADG measurement may have compromised the calculation of RFImet. In that equation, ADG was not significant (P = 0.07) and BW0.75 explained most of the variation in DMI.
When RFI is used as a measure of feed efficiency, efficient animals consume less than their inefficient counterparts for the same production performance (Fitzsimons et al., 2013). As a consequence, it would be expected that animals with low RFI would release less methane proportionally to their lower feed intake. However, studies have shown variations in methane emission between low- and high-efficiency animals. Fitzsimons et al. (2013) observed less methane emission (g/d and g/kg BW0.75) in low-RFI heifers and Hegarty et al. (2007) showed that steers selected for low RFI also have reduced daily methane emission (g/d). These results agree with the observations in the RFImet test, in which Nellore bulls classified as low-RFImet released less enteric methane (g/d) (P = 0.024). Taken together, the results suggest the potential selection of cattle for feed efficiency and reduced enteric methane emission. On the other hand, no difference (P>0.05) in enteric methane emission (g/d and g/kg BW0.75) was observed in the present study when it was compared between animals of low and high RFIgrowth.
The methane emission data (g/d) are similar to those reported by Possenti et al. (2008), who observed emission of 147.5 g CH4/d in cattle fed coast-cross hay with 200 g/kg of leucaena, and lower than those estimated by Johnson and Johnson (1995) for beef cattle (164 to 194 g CH4/d). The values expressed as kg/year (51-53 kg CH4/kg year) agree with the estimates reported by Cederberg et al. (2009) for young cattle in Brazil (47-56 kg CH4/year), and by the IPCC (2006), which estimated an average emission of 49 kg CH4/year for young cattle (230 kg BW) in Latin America. These data corroborate the findings of Jones et al. (2011), who observed similar daily methane emissions (g/kg BW) in cows with low and high RFI grazing on low-quality pasture.
When methane emissions were expressed as unit of feed consumed (g/kg DMI during RFIgrowth), high-efficiency animals (low-RFIgrowth) released more methane (25.1 g/kg
Table 4 - Spearman correlation coefficients between performance traits and residual feed intake (RFI) of Nellore cattle obtained during the two evaluation periods of RFI (RFIgrowth and RFImet)
Traitmet BW0.75
growth 0.959***
DMIgrowth 0.718***
ADGgrowth −0.062 ns
RFIgrowth 0.412*
BW - body weight; DMI - dry matter intake; ADG - average daily gain; BW0.75 - metabolic body weight; ns - not significant.
*P<0.05; ***P<0.0001.
Discussion
No differences in ADG were observed between RFIgrowth classes (Table 2), despite a difference in DMI between low- and high-RFIgrowth animals (P>0.001) due to the definition of RFI itself (Koch et al., 1963). This fact has also been reported in recent studies demonstrating that RFI is independent of ADG in cattle (Fitzsimons et al., 2013; Durunna et al., 2012; Lawrence et al., 2012; Cruz et al., 2010). The ADG of animals classified as low- and high-RFI (0.754 vs 0.744 kg/d, P = 0.810) during the RFIgrowth test was moderate and is consistent with that observed for weaned Nellore animals fed Brachiaria brizantha hay-based diet and concentrate. Similar ADG values (0.820 kg/d) were reported by Sobrinho et al. (2011) for Nellore bulls selected for post-weaning weight that received a similar diet. On the other hand, ADG was numerically lower in the animals classified as low- and high-RFI (0.466 and 0.547 kg/d, respectively; P = 0.726) during the RFImet test when the animals received the same diet. Even though the diet and facility were the same and the DMI expressed as percentage of average test BW (2.2%) were similar in growth and methane phases, lower ADG was observed during RFImet compared with RFIgrowth, probably due to the daily management for CH4 emission measurement.
DMI) than their low-efficiency counterparts (22.8 g/kg DMI) (P<0.05). In this case, the enteric methane emission is probably related to higher digestibility and a higher ruminal fermentation rate, increasing the total production of short-chain fatty acids with a proportional increase in the production of methane. Previous research (Magnani et al., 2013) reported higher DM digestibility for low-RFI Nellore heifers than high-low-RFI heifers (49.14% vs 45.38%, respectively). Richardson et al. (1996) observed that steers and heifers with low or high feed efficiency tend to differ in their capacity to digest DM, by about one percentage unit (DM digestibility of 68%), and this difference in digestibility was responsible for 14% of the difference in DMI. However, digestibility and ruminal digestion products were not evaluated in the present study, but studies suggest that the efficiency of animals classified as low-RFI is associated with a greater digestive capacity (Herd and Arthur, 2009; Richardson and Herd, 2004). Freetly and Brown-Brandl (2013) suggested that methane emission may increase with increasing feed efficiency and that selection of cattle for increased feed efficiency will not necessarily reduce enteric methane emission.
The results reported by Freetly and Brown-Brandl (2013) also do not support the hypothesis that increased feed efficiency reduces methane emission. The authors observed that measures of feed efficiency, BW gain:DMI ratio, and RFI, are not associated with methane emission in cattle fed a high-corn diet (828 g/kg). When the animals were fed a high-roughage diet (600 g/kg of corn silage, 30 g/kg of alfalfa hay), RFI was not related to methane emission, but the association between BW gain:DMI ratio and methane emission was positive. According to the authors, the increase in the methane emission rate with increasing feed efficiency (BW gain:DMI) may have been due to the higher fermentation of feed, increasing nutrient availability and methane emission. In contrast, no differences in methane emission (g/kg DMI) were observed between animals classified as low- and high-RFImet (P = 0.915), despite differences in DMI between low- and high-RFImet animals (7.09 and 8.12 kg/d, respectively) and a moderate positive Pearson correlation (r = 0.62) between CH4 (g/d) and DMI (kg/d). Likewise, regression analysis indicated that an increase of 1 kg in DMI was associated with an increase of 17 g/d in methane emission (r = 0.38). Fitzsimons et al. (2013) and Hegarty et al. (2007) also observed no difference in methane produced as a function of DMI between RFI classes; however, Nkrumah et al. (2006) observed that low- RFI steers released less methane per unit of DMI.
The methane emission values (expressed as g/kg DMI) estimated in the present study (20.1 to 25.1 g/kg DMI)
agrees with those reported in the literature for animals fed high-roughage diets. McGeough et al. (2010) observed methane emissions of 35.6 g/kg DMI in beef cattle fed grass silage plus 2.60 kg of supplemental concentrate DM, and 15.3 g/kg DMI for animals offered concentrate ad libitum. These results suggest that animals fed high-forage diets generally tend to release more methane (g/kg DMI) than animals offered high-concentrate diets (Janssen, 2010). In the present study, no difference in methane emissions, expressed as g/kg ADG during RFIgrowth or RFImet, was observed between more and less efficient animals (P>0.05). This finding was expected, since no significant difference in ADG was observed during both studied periods (P>0.05).
The loss of energy in methane form, defined as the percentage of enteric methane emitted and expressed as a function of gross energy intake (%GEI), was on average 6.5% during the RFImet period. This value agrees with those predicted by the IPCC (2006) for beef cattle raised under tropical conditions (6.5% to 7.5%). However, these values are lower than those reported by McGeough et al. (2010) for continental crossbred steers fed corn silage-based diets (7.3% to 8.4% GEI) using SF6 gas tracer techniques, and by Fitzsimons et al. (2013) for grass silage-based diets offered to Simmental heifers (12.6% GEI), with values established at the upper end of variation of 2% to 12% GEI as reported by Johnson and Johnson (1995).
High-efficiency animals show a significant reduction in DMI; however, it is not possible to confirm that more efficient animals release less enteric methane, since different results were obtained when enteric methane was compared between RFIgrowth classes and RFImet classes. These results may be expected, since the duration of the tests differed, as also did the number of days between each test and methane measurement. While RFIgrowth was based on measurements obtained in the middle of the test, about 65 days before methane sampling, RFImet was measured exactly during the measurement of methane emission. In addition, the period of 32 d to obtain RFImet may not be sufficient for the accurate measurement of ADG (Wang et al., 2006). This would explain the Spearman correlations between traits obtained during both tests, which were high between BW0.75 and DMI and zero between ADG, resulting in a correlation of medium magnitude between RFIgrowth and RFImet, with evidence of re-ranking of the animals for RFI.
have been proposed to reduce greenhouse gas emission, many of them designed to reduce enteric methane emission. The selection of animals with low DMI and similar ADG could be a strategy to reduce greenhouse gases emissions in the beef production system as a whole since these animals are highly efficient in feed utilization.
Conclusions
There is no evidence that high-efficiency animals release less enteric methane, even with lower dry matter intake and same performance than their inefficient counterpart.
References
AOAC - Association of Official Analytical Chemists. 1990. Official methods of analysis. 15th ed. AOAC, Arlington, VA.
Blaxter, K. L. and Clapperton, J. L. 1965. Prediction of the amount of methane produced by ruminants. British Journal of Nutrition 19:511-522.
Cederberg, C.; Meyer, D. and Flysjö, A. 2009. Life cycle inventory of greenhouse gas emissions and use of land and energy in Brazilian beef production. In: SIK, ed. The Swedish Institute for Food and Biotechnology, Swedish.
Cruz, G. D.; Rodriguez-Sanchez, J. A.; Oltjen, J. W. and Sainz, R. D. 2010. Performance, residual feed intake, digestibility, carcass traits, and profitability of Angus-Hereford steers housed in individual or group pens. Journal of Animal Science 88:324-329.
Durunna, O. N.; Colazo, M. G.; Ambrose, D. J.; McCartney, D.; Baron, V. S. and Basarab, J. A. 2012. Evidence of residual feed intake reranking in crossbred replacement heifers. Journal of Animal Science 90:734-741.
Fitzsimons, C.; Kenny, D. A.; Deighton, M. H.; Fahey, A. G. and McGee, M. 2013. Methane emissions, body composition, and rumen fermentation traits of beef heifers differing in residual feed intake. Journal of Animal Science 91:5789-5800.
Freetly, H. C. and Brown-Brandl, T. M. 2013. Enteric methane production from beef cattle that vary in feed efficiency. Journal of Animal Science 91:4826-4831.
Grion, A. L.; Mercadante, M. E. Z.; Cyrillo, J. N. S. G.; Bonilha, S. M. F.; Magnani, E. and Branco, R. H. 2014. Selection for feed efficiency traits and correlated genetic responses in feed intake and weight gain of Nellore cattle. Journal of Animal Science 92:955-965.
Hegarty, R. S.; Goopy, J. P.; Herd, R. M. and McCorkell, B. 2007. Cattle selected for lower residual feed intake have reduced daily methane production. Journal of Animal Science 85:1479-1486. Herd, R. M. and Arthur, P. F. 2009. Physiological basis for residual
feed intake. Journal of Animal Science 87:E64–E71.
Holter, J. B. and Young, A. J. 1992. Nutrition, feeding and calves: methane prediction in dry and lactating Holstein cows. Journal of Dairy Science 75:2165-2175.
IPCC - Intergovernmental Panel on Climate Change. 2006. Chapter 3. Livestock’s role in climate change and air pollution. Agriculture, forestry and other land use. 4:3.1-3.20.
Janssen, P. H. 2010. Influence of hydrogen on rumen methane formation and fermentation balances through microbial growth kinetics and fermentation thermodynamics. Animal Feed Science and Technology 160:1-22.
Johnson, K. A. and Johnson, D. E. 1995. Methane Emissions from Cattle. Journal of Animal Science 73:2483-2492.
Jones, F. M.; Phillips, F. A.; Naylor, T. and Mercer, N. B. 2011. Methane emissions from grazing Angus beef cows selected for divergent residual feed intake. Animal Feed Science and Technology 166:302-307.
Kelly, A. K.; McGee, M.; Crews, D. H. Jr.; Fahey, A. G.; Wylie, A. R. and Kenny, D. A. 2010. Effect of divergence in residual feed intake on feeding behavior, blood metabolic variables, and body composition traits in growing beef heifers. Journal of Animal Science 88:109-123.
Koch, R. M.; Swiger, L. A.; Chambers, D. and Gregory, K. E. 1963. Efficiency of feed use in beef cattle. Journal of Animal Science 22:486-494.
Lancaster, P. A.; Carstens, G. E.; Crews, D. H. Jr.; Welsh Jr., T. H.; Forbes, T. D. A.; Forrest, D. W.; Tedeschi, L. O.; Randel, R. D. and Rouquette, F. M. 2009. Phenotypic and genetic relationships of residual feed intake with performance and ultrasound carcass traits in Brangus heifers. Journal of Animal Science 87:3887-3896. Lawrence, P.; Kenny, D. A.; Earley, B. and McGee, M. 2012. Grazed
grass herbage intake and performance of beef heifers with predetermined phenotypic residual feed intake classification. Animal 6:1648-1661.
Magnani, E.; Nascimento, C. F.; Branco, R. H.; Bonilha, S. F. M.; Ribeiro, E. G. and Mercadante, M. E. Z. 2013. Relações entre consumo alimentar residual, comportamento ingestivo e digestibilidade em novilhas Nelore. Boletim de Indústria Animal 70:187-194. Mercadante, M. E. Z.; Packer, I. U.; Razook, A. G.; Cyrillo, J. N.
S. G. and Figueiredo, L. A. 2003. Direct and correlated responses to selection for yearling weight on reproductive performance of Nelore cows. Journal of Animal Science 81:376-384.
McGeough, E. J.; O’Kiely, P.; Hart, K. J.; Moloney, A. P.; Boland, T. M. and Kenny, D. A. 2010. Methane emissions, feed intake, performance, digestibility, and rumen fermentation of finishing beef cattle offered whole-crop wheat silages differing in grain content. Journal of Animal Science 88:2703-2716.
Mertens, D. R. 2002. Gravimetric determination of amylase-treated neutral detergent fiber in feeds with refluxing in beakers or crucibles: collaborative study. Journal of AOAC International 85:1217-1240.
Nkrumah, J. D.; Okine, E. K.; Mathison, G. W.; Schmid, K.; Li, C.; Basarab, J. A.; Price, M. A.; Wang, Z. and Moore, S. S. 2006. Relationships of feedlot feed efficiency, performance, and feeding behavior with metabolic rate, methane production, and energy partitioning in beef cattle. Journal of Animal Science 84:145-153.
NRC - National Research Council. 2000. Nutrient requirements of beef cattle. 7th ed. National Academy Press, Washington, DC. Possenti, R. A.; Franzolin, R.; Schammas, E. A.; Demarchi, J. J. A.
A.; Frighetto, R. T. S. and Lima, M. A. 2008. Efeitos de dietas contendo Leucaena leucocephala e Saccharomyces cerevisiae
sobre a fermentação ruminal e a emissão de gás metano em bovinos. Revista Brasileira de Zootecnia 37:1509-1516.
Primavesi, O.; Frigheto, R. T. S.; Pedreira, M. S.; Lima, M. A.; Berchielli, T. T.; Demarchi, J. J. A. A.; Manella, M. Q.; Barbosa, P. F.; Johnson, K. A. and Westberg, H. H. 2004. SF6-tracer technique for bovine ruminal methane field measurements: adaptations to Brazilian conditions. Embrapa Pecuária Sudeste, São Carlos. (Document 39).
Richardson, E. C. and Herd, R. M. 2004. Biological basis for variation in residual feed intake in beef cattle. 2. Synthesis of results following divergent selection. Australian Journal of Experimental Agriculture 44:431-440.
of net feed conversion efficiency. Proceedings of the Australian Society of Animal Production 21:901-908.
Sobrinho, T. L.; Branco, R. H.; Bonilha, S. M. F.; Castilhos, A. M.; Figueiredo, L. A.; Razook, A. G. and Mercadante, M. E. Z. 2011. Residual feed intake and relationships with performance of Nellore cattle selected for post weaning weight. Revista Brasileira de Zootecnia 40:929-937.
Van Soest, P. J. and Robertson, J. B. 1985. Analysis of forages and fibrous foods. Cornell University, Ithaca.
Wang, Z.; Nkrumah, J. D.; Li, C.; Basarab, J. A.; Goonewardene, L. A. and Okine, E. K. 2006. Test duration for growth, feed intake, and
feed efficiency in beef cattle using the GrowSafe System. Journal of Animal Science 84:2289-2298.
Weiss, W. P. 1999. Energy prediction equations for ruminant feeds. p.176-185. In: Proceedings of the 61st Cornell Nutrition Conference for Feed Manufactures. Cornell University, Ithaca.
Westberg, H.; Johnson, K. A.; Cossalman, M. W. and Michal, J. J. A. 1998. SF6 tracer technique: methane measurement from ruminants. Washington State University, Pullman, Washington.