Submitted11 December 2015 Accepted 23 February 2016 Published15 March 2016
Corresponding author Nathan F. Bendik,
Academic editor Jean Clobert
Additional Information and Declarations can be found on page 20
DOI10.7717/peerj.1817
Copyright 2016 Bendik et al.
Distributed under
Creative Commons CC-BY 4.0
OPEN ACCESS
Movement, demographics, and occupancy
dynamics of a federally-threatened
salamander: evaluating the adequacy of
critical habitat
Nathan F. Bendik1, Kira D. McEntire1,2and Blake N. Sissel1,3 1Watershed Protection Department, City of Austin, Austin, TX, United States of America
2Current affiliation: Warnell School of Forestry and Natural Resources, University of Georgia, Athens, GA,
United States of America
3Current affiliation: Natural Resources, Travis County, Austin, TX, United States of America
ABSTRACT
Critical habitat for many species is often limited to occupied localities. For rare and cryptic species, or those lacking sufficient data, occupied habitats may go unrecognized, potentially hindering species recovery. Proposed critical habitat for the aquatic Jollyville Plateau salamander (Eurycea tonkawae) and two sister species were delineated based on the assumption that surface habitat is restricted to springs and excludes intervening stream reaches. To test this assumption, we performed two studies to understand aspects of individual, population, and metapopulation ecology ofE. tonkawae. First, we examined movement and population demographics using capture-recapture along a spring-influenced stream reach. We then extended our investigation of stream habitat use with a study of occupancy and habitat dynamics in multiple headwater streams. Indications of extensive stream channel use based on capture-recapture results included frequent movements of >15 m, and high juvenile abundance downstream of the spring. Initial occupancy ofE. tonkawaewas associated with shallow depths, maidenhair fern presence and low temperature variation (indicative of groundwater influence), although many occupied sites were far from known springs. Additionally, previously dry sites were three times more likely to be colonized than wet sites. Our results indicate extensive use of stream habitats, including intermittent ones, byE. tonkawae. These areas may be important for maintaining population connectivity or even as primary habitat patches. Restricting critical habitat to occupied sites will result in a mismatch with actual habitat use, particularly when assumptions of habitat use are untested, thus limiting the potential for recovery.
SubjectsConservation Biology, Ecology, Environmental Sciences, Zoology
Keywords Multi-strata capture-recapture, Caudata, Dynamic occupancy models, Endangered species,Eurycea tonkawae, Plethodontidae
INTRODUCTION
Taylor, Sucking & Rachlinski, 2005;Kerkvliet & Langpap, 2007), and its shortcomings have been attributed to its practice and implementation rather than its intent (Camaclang et al., 2015). In many cases, data limitation appears to be the reason for inadequate delimitations of critical habitat (Camaclang et al., 2015). Accurate delimitation of habitat essential for the conservation of species requires basic information on both habitat associations and habitat availability (Rosenfeld & Hatfield, 2006). Conservation actions may fall short when this information is inaccurate, incomplete or disregarded (Takekawa & Beissinger, 1989; Turner et al., 2004). In practice, critical habitat is often limited only to known localities, excluding unoccupied habitats that may be important for translocations or colonization (Camaclang et al., 2015). For rare, cryptic or otherwise data-deficient species, areas that are essential to species conservation may be underrepresented by designated critical habitats, particularly if it is limited only to areas known to be occupied.
the Edwards Plateau where springs emerge to feed headwater streams, potentially creating suitable habitat for salamanders within the stream or linking habitat patches (e.g., spring outlets) as a corridor for dispersal. If intervening surface habitat between spring outlets is important, either for dispersal or as primary habitat, limited critical habitat designations and other conservation policy decisions could miss a crucial aspect of TexasEurycea ecology, increase the risk of extinction for listed species and decrease their probability of recovery. Therefore, a better understanding of stream habitat and the extent to which these salamanders occupy it is necessary.
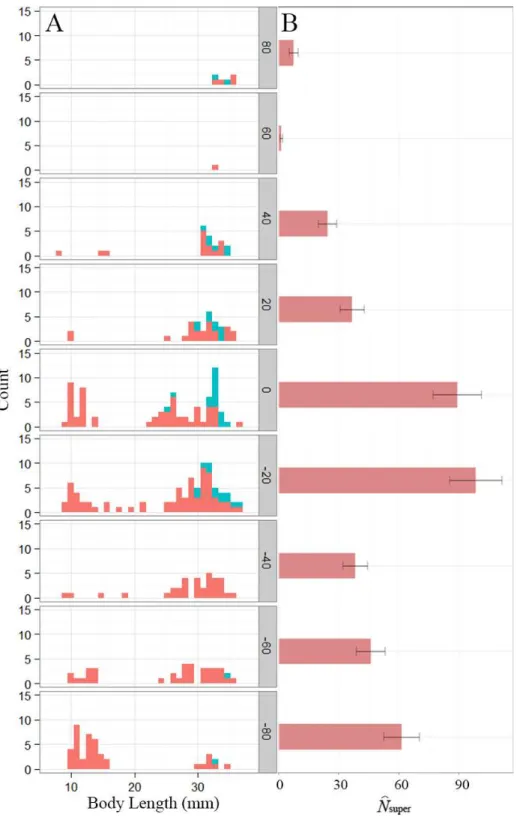
We performed two studies to examineE. tonkawaeecology at the individual, population and metapopulation scale to understand surface habitat use of this threatened, aquatic salamander endemic to the metropolitan area of Austin, Texas. Our first study was motivated by the surface critical habitat initially proposed for this and two similar species, which was based on the maximum distance (50 m) E. naufragiahad been recorded to move during a single study near a spring (US Fish and Wildlife Service, 2012). Using data from repeated capture-recapture surveys during a single season, we generated estimates of superpopulation size at various distances upstream and downstream from the spring, quantified the movement of individuals between these areas, and documented the demographic structure of the population to determine whether the proposed critical habitat boundaries adequately reflect habitat used or potentially used byE. tonkawae.
For our second study, we extended our inquiry beyond a single population to a broad-scale study of site occupancy dynamics and habitat associations to determine the extent to whichE. tonkawaeuses headwater stream habitat. We used multi-season occupancy models to examine habitat characteristics associated withE. tonkawaesite occupancy (MacKenzie et al., 2006) and simultaneously modeled habitat suitability dynamics in the context of wet or dry site conditions (e.g.,Falke et al., 2012), which may differ among urban and rural streams. Urban streams may exhibit altered hydrologic regimes (Walsh et al., 2005), including artificially enhanced recharge from urban leakage (Sharp, 2010), potentially resulting in more wetted habitat for salamanders to use. By jointly modeling habitat and occupancy (Martin et al., 2010;Mackenzie et al., 2011), we account for imperfect detection as well as variation in stream hydrology while addressing specific questions about habitat associations and occupancy dynamics. Specifically, we ask (1) How does urbanization influence habitat availability and site occupancy? (2) What habitat characteristics are important forE. tonkawae occurrence? (3) How do intermittent habitat patches influence occupancy dynamics? We combine inferences from a small-scale capture-recapture effort and an expansive assessment of headwater stream occupancy and habitat dynamics to develop a better understanding of habitat use by E. tonkawae. We then discuss the implications of our results with regard to critical habitat.
METHODS
Study area
Cayonlands Preserve, a local preserve system dedicated for the protection of endangered avian and karst invertebrate fauna. Lanier Spring emerges from alluvial deposits and discharges into Bull Creek several meters from the spring opening. The presence of potential habitat upstream and downstream of the Lanier Spring confluence in the form of shallow, clear water with abundant rock cover (Bowles, Sanders & Hansen, 2006) made it an ideal site to study aspects of population biology and individual movement of E. tonkawae in the context of a spring-stream habitat gradient.
Headwater streams in Bull Creek are spring-fed, gaining streams (i.e., discharge increases with stream length) with flows that undulate between the surface and subsurface, particularly during dry periods. We conducted occupancy surveys within five tributaries of Bull Creek, including those whose catchments were predominantly within the Balcones Canyonlands Preserve (Mainstem/Trib. 8 & Trib. 7) and streams surrounded mostly by urban development (Trib. 4, Barrow Hollow, & Trib. 2).
Study 1: movement and distribution around a spring
We surveyed Lanier Spring every two weeks from January through April 2013 and delimited nine 5 m survey sections around the spring outlet (four upstream, four downstream, and one at the spring outlet) every 15 m. The wetted channel boundaries determined the survey width, as each 5 m section was surveyed from bank to bank. Based on previous capture-recapture work at this site (Bendik et al., 2013b), we suspected the number of salamanders available for capture (and recapture) would be enough to detect upstream or downstream movements of individuals between sections. Detection of movement was restricted to the stream channel because this species is aquatic and overland movements are not possible. Sections were exhaustively searched for salamanders by flipping cover objects such as rocks and leaf litter. Once detected, salamanders were caught using dip nets and photographed on a standardized 0.5 cm grid. Measurements of body length were obtained from photographs (followingBendik & Gluesenkamp, 2013) using Image J (Rasband, 1997). We cropped photos to include only the head and used Wild-ID (Bolger et al., 2012) for individual identification based on pigmentation patterns. A previous study demonstrated that identification errors using this technique were lower (false rejection rate =0.76%) compared to visible implant elastomers (VIE; false rejection rate=1.90%) forE. tonkawae (Bendik et al., 2013b). Therefore, we were confident in our ability to correctly identify individuals. In addition to documenting intra-seasonal movement, we were interested in the presence and location of VIE individuals (N=1,115 marked from 2007 to 2011) from a prior study at this site. Their presence in areas beyond the spring outlet may indicate dispersal from the spring.
and superpopulation size by section. We also investigated the effect of body length onp andφ.
To calculate the probability of movement while accounting for detection error, we used a multi-state model with live-recaptures in program MARK 8.0 (White, 2015). This is an extension of the Cormack–Jolly–Seber model for calculating apparent survival and detection probability in open populations that allows for movement between strata with transition probabilities (Hestbeck, Nichols & Malecki, 1991;Brownie et al., 1993). We considered models whereby salamanders could either remain in their current position, or move to a new section. Transition probabilities estimate the rate movement between sections, an average distance of 20 m. Movement probability was calculated as twice the transition probability, since transitions in both directions indicate movement. Our model set included all combinations of time variance for apparent survival (φ), detection (p) and transition probabilities (ψ), but we did not incorporate differences among states. We also tested for the influence of body length on apparent survival, detection, and transition probability. Program U-CARE (Choquet et al., 2009) was used to estimate theˆcratio, a measure of goodness-of-fit, for both the multi-state and POPAN models.
Study 2: habitat-occupancy dynamics
Starting at the downstream confluence below the nearest knownE. tonkawae locality, we surveyed 97 sites in 2013, and surveyed an additional 30 sites in 2014 and 2015, for a total of 127 sites (encompassing over 12 km of linear stream channel). Of those, 118 contained wetted habitat at some point during our sampling. The distribution of sites was nearly evenly split between those occurring within preserves (n=57) and those in urbanized tributaries (n=61). With the exception of avoidance of deep pools (>0.6 m) such as man-made impoundments, we selected sites in a systematic, random fashion. Site selection started at a random point 0–100 m from the confluence and proceeded upstream, while maintaining equal distances among sites. Because we were targeting an even distribution of sites among tributaries and urban/non-urban catchments, sites in Barrow Hollow, Trib. 2, Trib. 4 and Trib. 7 were spaced 70 m apart, while those in Mainstem/Trib. 8 were spaced 140 m apart due to the larger size of that tributary. Each site was 10 m in length (from downstream to upstream) and the wetted channel boundaries determined the width of each site. Sites were surveyed each year from 2013 through 2015; our survey seasons generally started in late March and ended in early May. Because sampling occurred once per year, we use the term ‘‘year’’ to refer to occupancy seasons. Two experienced observers simultaneously performed a time-limited search removing cover objects for 5 min at each site, three times per year, at a minimum interval of one week. During our surveys, we documented new spring localities where we observed water issuing from conduits within or near the stream channel and included previously documented springs (City of Austin, 2015) to compare to the distribution of occupied sites.
Information 1. We conducted one-way ANOVAs among continuous predictor variables and site groupings (tributary or urbanization) and Chi-squared tests among categorical variables and groupings. The program R (R Core Team, 2014) was used for data preparation and preliminary statistical analyses. Significance was evaluated atα=0.05.
We used a model that integrates both habitat and occupancy dynamics to fit detection/non-detection data and changes in habitat suitability (Mackenzie et al., 2011). We used a simplified version of this model, with only three possible states: suitable, but species undetected; suitable with species detected; or unsuitable and unoccupied. Because neotenic Euryceaare stream-dwelling, aquatic organisms, we classified sites that had flowing water during some portion of our sampling season as suitable (S) and those that were either dry during the entire period, or initially stagnant and later became dry, as unsuitable (U). In this context, ‘‘suitable’’ habitat refers to a minimum condition for the presence of an aquatic species, and beyond that does not imply that such habitat is necessarily of good quality. Following the notation ofMackenzie et al. (2011), the parameterπ[S]represents the probability of a site being suitable habitat during the first year. The probability of habitat changing state between years is represented by two parameters:η[tS,S]represents the probability of habitat remaining suitable between yeartandt+1;η[tU,S]is the probability of habitat transitioning from unsuitable to suitable between yeartandt+1. The probabilities of habitat to transition from suitable to unsuitable, or to remain unsuitable are 1−η[tS,S]
and 1−ηt[U,S], respectively. The probability the species was initially present at a site is represented by ψ[S] (initial occupancy probability for unsuitable sites is fixed at zero). The probability a species colonizes a site between yearst andt+1 is described by two parameters,γt[S,S]andγt[U,S]. The probability a species goes extinct at a site between years t andt+1 isε[tS,S]. By definition, when habitat becomes unsuitable, colonization does not occur (γt[S,U]=γt[U,U]=0) and extinction does (ε[tS,U]=1). Detection probability of habitat state was assumed to be perfect and we also assumed that species occupancy had no bearing on habitat suitability. A primary assumption of the occupancy model we used required that both habitat suitability and occupancy remained constant within each sampling season.
With regard to habitat dynamics, we predicted that habitat suitability would be dependent upon the prior state because spring locations and other geomorphological factors that influence hydrologic periodicity are assumed to be relatively constant. We therefore compared models where habitat suitability exhibited a first-order Markovian pattern of state dependence (represented by two parameters,η[tS,S] andη[tU,S]) to those where habitat suitability was independent of the previous state (ηt[S,S]=η[tU,S]). Our first year of sampling was also the driest, so we expected that urban tributaries would have more wet sites than non-urban tributaries because of artificial groundwater recharge from irrigation and leaking treated water and wastewater infrastructure (Christian, Banner & Mack, 2011). To test for this effect, we considered models where the initial habitat stateπ[S]
having markedly higher water conductivity (Supplemental Information 1andFigure S4) and are surrounded by residential development.
We also tested the importance of TRIB and URB groupings with regard to site occupancy and colonization. The initial descriptive analysis we performed indicated both tributary and urbanization groupings could be explained by certain environmental covariates. Therefore, we modeled the effects of group and environmental explanatory variables on the parameters of interest separately.
of measurements for those covariates) in lieu of excluding those sites from our analysis. Twelve survey events with available occupancy data were missing most covariate values due to having a single visit (e.g., temperature variation measurements required at least two visits), and were dropped from the analysis.
To understand how habitat instability influences occupancy dynamics, we compared models where colonization was dependent on the prior habitat state (γt[U,S],γt[S,S]) or was random with respect to prior habitat (γt[U,S]=γt[S,S]). Estimates ofγt[U,S]are a measure of the ability to colonize a previously dry site, which may indicate migration between stable spring habitats and/or an ability to take advantage of habitats throughout the stream during wetter years. Our sampling occurred over a period of progressively wetter conditions, so we were able to determine whether dry sites were eventually colonized or not. Covariates were mirrored amongψandγt to simplify the model set, and because we were interested in the set of covariates that most consistently predicted whether a site could be occupied or not. For example, if we included WD (from year 1) as a covariate onψ[S],γ1andγ2
were also modeled with WD (corresponding to year 2 and year 3, respectively). The effect of environmental variables on colonization was assumed to be consistent regardless of the prior habitat state. Continuous covariates were standardized for analysis by subtracting the arithmetic mean from each value.
covariate coefficients (followingLukacs, Burnham & Anderson, 2010). Finally, because we used a multi-stage approach to model building, we re-tested detection and habitat model structures based on the top model to see if they were consistent with the initial decisions made in the model testing process.
RESULTS
Study 1: movement and distribution around a spring
Unique individuals were recaptured in all nine survey sections. Individuals moved frequently between sections along the spring-stream gradient. Throughout the four-month period we captured 215 unique individuals (>25 mm total length) and recaptured 81 at least once. Of the recaptured animals, 21 were identified in two different sections, implying a minimum movement distance of 15 m at least once. Fourteen moved one section (an average distance of 20 m), four moved two sections (40 m), two moved three sections (60 m) and one moved four sections (80 m). We did not observe strong directionality in movement: 10 moved downstream, 11 moved upstream. We observed VIE-tagged individuals in all but two sections, including both sections 80 m from the spring (Fig. 1). Incidentally, during the 2014 occupancy surveys, we observed a single VIE-tagged individual over 500 m upstream of Lanier Spring. This individual had been last observed in 2010.
The single-state goodness-of-fit analysis indicated a significant effect of transience, which is expected given the movement between sections we observed. There was also some evidence of overdispersion in the POPAN model (ˆc=1.58), therefore adjusted QAICc values were used for model selection and model-averaging. Model-averaged estimates of superpopulation size were greatest near the spring and 20 m downstream, although the section farthest downstream had the third highest estimate (Fig. 1). Small juveniles (<25 mm total length) were most abundant downstream, with the largest proportion (32%) occurring in the most distant section (Fig. 1), possibly accounting for the high superpopulation size estimate in that section. Body length was an important covariate in our model set, contributing to 98% of the QAICc weights (including any model where body length was a covariate), although the most optimal models only included body length on eitherφ orp, not both (Table 1). Model-averaged estimates of bi-weekly survival and detection probability based on mean body length (24.8 mm) ranged from 0.44–0.66 and 0.35–0.53, respectively.
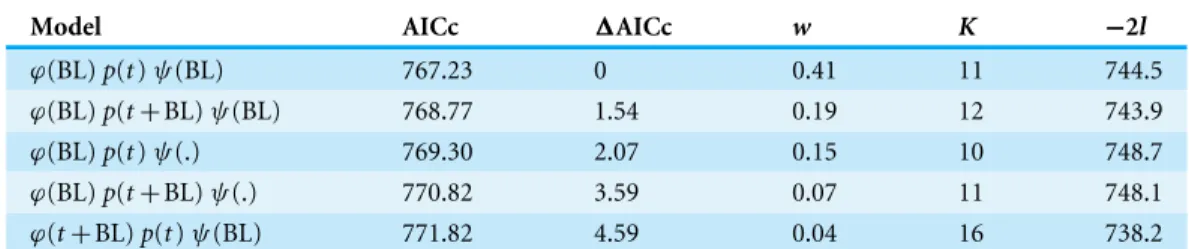
For the multi-state capture-recapture model, goodness-of-fit was adequate and we did not find evidence of overdispersion (ˆc=0.91). Body length was also an important predictor of both survival and movement probability (Table 2), and was positively correlated with both (Fig. 2). The sum of AICc weights for models including body length as a covariate for
ϕ andψ was 0.92 and 0.74, respectively. Model-averaged estimates of bi-weekly survival and detection probability based on mean body length (24.8 mm) ranged from 0.61–0.66 and 0.11–0.55, respectively. Movement probability, corrected for imperfect detection, was 0.15 (SE=0.07) for an average length salamander. A full list of model selection results and model-averaged parameter estimates for both capture-recapture analyses are provided in
Table 1 Model selection results for the top five POPAN models.
Model QAICc 1QAICc w K −2l
ϕ(BL)p(.)PENT(t)N(section) 599.44 0 0.24 18 561.5 ϕ(t)p(BL)PENT(t)N(section) 600.22 0.77 0.16 24 548.8 ϕ(.)p(BL)PENT(t)N(section) 600.69 1.24 0.13 18 562.8 ϕ(t+BL)p(.)PENT(t)N(section) 600.94 1.50 0.11 24 549.6 ϕ(BL)p(t)PENT(t)N(section) 601.43 1.99 0.09 25 547.7
Notes.
ϕ, apparent survival;p, detection probability; PENT, probability of entrance;N, superpopulation size; BL, body length co-variate; t, time variation; (.), constant.
Shown are quasi-likelihood Akaike’s Information Criterion values corrected for small samples (QAICc) and difference from the top model (1QAICc), the QAICc model weight (w), total number of parameters (K) and twice the negative log-likelihood for each model adjusted for overdispersion (−2l).
Table 2 Model selection results for the top five multi-state models.
Model AICc 1AICc w K −2l
ϕ(BL)p(t)ψ(BL) 767.23 0 0.41 11 744.5
ϕ(BL)p(t+BL)ψ(BL) 768.77 1.54 0.19 12 743.9
ϕ(BL)p(t)ψ(.) 769.30 2.07 0.15 10 748.7
ϕ(BL)p(t+BL)ψ(.) 770.82 3.59 0.07 11 748.1
ϕ(t+BL)p(t)ψ(BL) 771.82 4.59 0.04 16 738.2
Notes.
ϕ, apparent survival;p, detection probability;ψ, transition probability; BL, body length covariate;t, time variation; (.), con-stant.
Shown are Akaike’s Information Criterion values corrected for small samples (AICc) and difference from the top model (1AICc), the AICc model weight (w), total number of parameters (K) and twice the negative log-likelihood for each model (−2l).
Table 3 Mean±1 SD of continuous covariates among all occupancy sites.
Variable 2013 2014 2015
aTemperature variation (◦
C) 2.11±1.62b 1.77±1.14b,c 1.21±0.685b,c
aDepth (cm) 13.3±7.50 14.4±7.29 15.7±7.48
Rock cover (%) 44.5±33.8b,c 35.8±28.8b,c 35.5±29.6b,c
Notes.
aSignificant trend among years determined by linear regression.
bSignificant difference among tributaries determined by one-way ANOVA.
cSignificant difference among urbanized and non-urbanized tributaries determined by one-way ANOVA.
Study 2: habitat-occupancy dynamics
Figure 2 Model-averaged estimates (solid lines) of apparent survival (A) and movement probability (B) vs. body length with 95% confidence intervals (dashed lines) from multi-state capture-recapture analysis.
Figure 3 Map ofE. tonkawaerange (A) and occupancy study sites (B–E).(A) All known localities of
E. tonkawae, watershed boundaries, and creek centerlines for major tributaries of Bull Creek. (B–E) Sur-vey sites indicatingE. tonkawaedetection, location of known springs, and whether site was dry during any prior survey among sub-watersheds of Bull Creek. (B) Barrow Hollow. (C) Trib. 2. (D) Trib. 4. (E) Trib. 7 (top) and Mainstem/Trib. 8 (bottom). Road centerlines adjacent to tributaries are shown as an indicator of urbanization within each catchment.
detection- and habitat-based model structures on the top model did not alter the model hierarchy. The following results are based on model-averaged estimates from the top two models.
Initial habitat suitability was higher in urbanized streams (πˆ[S]=0.89, SE=0.05) compared to those in preserves (πˆ[S]=0.63, SE=0.07). The probability of a site remaining wet from 2013 to 2014 was high (ηˆ[1S,S]=0.96, SE=0.02), while the probability of a site transitioning from dry to wet during the same time period was lower (ηˆ[1U,S]=0.26, SE= 0.10). All sites were wet during the final year of sampling, resulting in both estimates ofη2
Table 4 Summary of the top five occupancy models.
Model AICc 1AICc w K −2l
ψ[S]γ[S,U]γ[S,S](TS
t+WDt+MH) 753.76 0 0.51 24 703.74
ψ[S] γ[S,U]
γ[S,S](TS
t+WDt+CA+MH) 753.87 0.11 0.48 26 699.50
ψ[S] γ[S,U]
γ[S,S](TS
t+WDt) 762.62 8.86 0.01 22 716.92
ψ[S]γ[S,U]γ[S,S](CA+TS
t+WDt) 766.14 12.38 0 24 716.12
ψ[S] γ[S,U]
γ[S,S](RC
t+TSt+WDt) 769.74 15.98 0 25 717.55
Notes.
TS, standard deviation of temperature; WD, water depth; RC, rock cover; CA, calcium carbonate deposition; MH, maiden-hair fern presence.
All models shown included the following structure:ε[S,S]
(t),π[S]
(URB),η[S,S]
(t),η[U,S]
(t),p(TRIB). Effective sample size was assumed to be 620. Covariates were applied to all parameters represented above and their effect on colonization probabilities was assumed to be consistent regardless of prior habitat state.tindicates yearly variation. Shown are the Akaike’s Information Criterion values corrected for small samples (AICc) and difference from the top model (1AICc), the AICc model weight (w), total number of parameters (K) and twice the negative log-likelihood for each model (−2l).
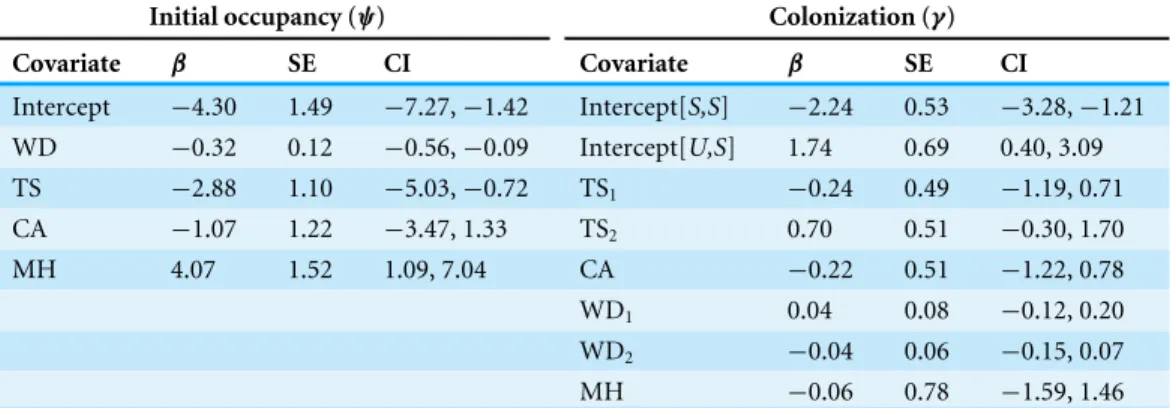
Table 5 Model-averaged coefficients (β), unconditional standard errors (SE) and 95% confidence in-tervals (CI) of intercepts and top covariates on initial occupancy scale) and colonization (logit-scale) estimating dynamic occupancy ofE. tonkawaefrom 2013 to 2015 in Bull Creek, Travis County, Texas.
Initial occupancy (ψ) Colonization (γ)
Covariate β SE CI Covariate β SE CI
Intercept −4.30 1.49 −7.27,−1.42 Intercept[S,S] −2.24 0.53 −3.28,−1.21 WD −0.32 0.12 −0.56,−0.09 Intercept[U,S] 1.74 0.69 0.40, 3.09 TS −2.88 1.10 −5.03,−0.72 TS1 −0.24 0.49 −1.19, 0.71
CA −1.07 1.22 −3.47, 1.33 TS2 0.70 0.51 −0.30, 1.70
MH 4.07 1.52 1.09, 7.04 CA −0.22 0.51 −1.22, 0.78
WD1 0.04 0.08 −0.12, 0.20
WD2 −0.04 0.06 −0.15, 0.07
MH −0.06 0.78 −1.59, 1.46
Notes.
TS, standard deviation of temperature; WD, water depth; CA, calcium carbonate deposition; MH, maidenhair fern presence.
The best AICc (effective sample size =620) time-varying covariate models of initial occupancy and colonization contained covariates TS and WD (Supplemental Information 2andTable S13), each with 100% of the relative variable weights compared to 3% relative weight for RC (calculated from the model set including all combinations of TS, WD, and RC). Consistent with our hypotheses, estimates of TS and WD coefficients had a significant negative effect on initial occupancy with 95% confidence intervals excluding zero (Table 5). Inclusion of CA and MH categorical site-level covariates improved upon the continuous covariates model, decreasing the AIC value by over 8 units. MH was positively correlated with salamander presence, while CA was negatively correlated, though not significantly (Table 5).
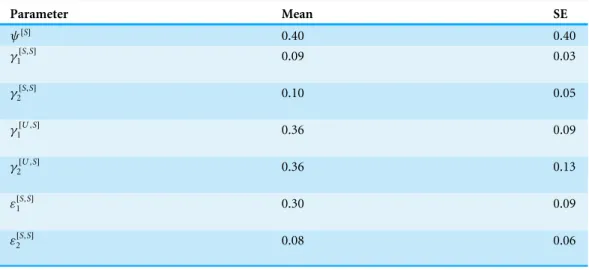
Table 6 Model-averaged estimates of initial occupancy (ψ), colonization (γ), and extinction (ε) pa-rameters, and their standard errors, averaged across all sites.
Parameter Mean SE
ψ[S]
0.40 0.40
γ1[S,S] 0.09 0.03
γ2[S,S] 0.10 0.05
γ1[U,S] 0.36 0.09
γ2[U,S] 0.36 0.13
ε[1S,S] 0.30 0.09
ε[2S,S] 0.08 0.06
habitat state was dry, compared to sites that remained wet (e.g.,γˆ1[S,S]=0.11, SE=0.06; ˆ
γ1[U,S]=0.34, SE=0.06;Table 6). Extinction probabilities among sites that remained wet declined by approximately two-thirds for 2015 compared to the prior year (Table 6).
Odds and odds ratios are a convenient way to interpret the effects of covariates in occupancy models that utilize logistic regression (MacKenzie et al., 2006). Odds ratios based on the top two models did not differ in terms of the ranks of their magnitude (high values and low values were consistent among models), indicating that covariate effects were consistent among models. We therefore present results based on the model-averaged estimates. Sites with average WD and TS, but with MH were less likely to be occupied than unoccupied during 2013, with odds of 0.76:1 (calculated ase−4.35×e4.07×1). Similarly, sites
1 standard deviation (SD) below average WD (SD=7.5 cm) without MH were also less likely to be occupied (odds=0.15:1). Sites 1 SD below average TS (1.62 ◦C), but with
mean WD and no MH were slightly more likely to be occupied than unoccupied (odds= 1.37:1). However, when sites had both MH and low TS (1 SD below average), the overall odds of occupancy vastly improved at 80:1. Even sites with moderate, negative deviations from average covariate values and with MH dramatically improved the odds of occupancy (e.g.,−0.5 SD=26:1 odds in favor of occupancy).
A full list of model selection results for occupancy analyses is provided inSupplemental Information 3.
DISCUSSION
Movement rates, distances individuals traveled, and the presence of recaptured individuals in all of our study sections demonstrated the importance of stream habitat within the spring-influenced stream reach. Movement rates appear to be higher for E. tonkawae compared to those reported in other predominantly stream-dwelling salamanders, although differences in study designs and the length of study periods make direct comparisons difficult. For example, in the closely-relatedE. naufragia, movement rates were reported as 1–2% per month into adjacent 5 m sections over a two-year period (Pierce, McEntire & Wall, 2014). Only 18% ofGyrinophilus porphyriticusindividuals recaptured (N=21/118) moved beyond 1 m of their original capture site during a two-year period (Lowe, 2003). Almost half ofPsuedotriton ruberlarvae moved >5 m between captures during a one-year study (Cecala, Price & Dorcas, 2009). In comparison, we estimated the probability of movement per two-week period between our 15 m sections as 0.15 (SE= 0.07) for an average sized individual, with larger individuals being more likely to move than smaller ones (Fig. 1). Our approach factors in detection error, whereas a naïve estimate using only a comparison of the proportion of recaptures that moved would be negatively biased. Movement distances observed for E. tonkawae (up to 80 m over a four-month period, and one observation of 500 m) were higher than those reported for otherEurycea as well. In an eight-month study ofE. bislineata(N=20), individuals moved a maximum of 30.5 m (Ashton & Ashton, 1978), whileE. naufragiamoved up to 25 m or 50 m (the extents of their spring runs) during a two-year period (Pierce, 2012). Whether movements we observed represented dispersal events or occurred within their home range is uncertain. However, we consider these observations to be an important first step in understanding the movement ecology of this species, a potentially important aspect of amphibian conservation biology (Pittman, Osbourn & Semlitsch, 2014). Furthermore, our results demonstrate the potential of individuals to move the entire linear stream distance of their surface critical habitat, and in at least one case, exceed that distance by over six-fold.
high juvenile abundance well downstream of the large spring outlet indicates the potential importance of these areas for early life-stages ofE. tonkawae, and we believe that these habitats may extend past the arbitrary 80 m buffer delineated as critical habitat.
Expanding our investigation from a single population to a multi-year study of metapopulation dynamics among headwater streams, we found that initial occupancy was strongly associated with the presence of maidenhair ferns, low temperature variation and shallow water depths. Sites with maidenhair ferns and low temperature variation likely indicate areas where springs or subsurface stream conduits emerge from within the stream channel, acting as connections between surface and subterranean habitat. Models where site occupancy was dependent upon the prior occupancy state were highly supported (compared to a random pattern of site occupancy), indicating some site fidelity of E. tonkawae for these habitat types. Prior habitat availability was also important for predicting occupancy dynamics. Previously unoccupied sites were more likely to be colonized if the prior habitat state was dry, demonstrating the propensity ofE. tonkawaeto respond to changing surface habitat conditions and disperse to newly available stream habitats. Yet, habitat characteristics of newly colonized sites were not the same as initially occupied sites, as maidenhair fern presence, temperature variation, and water depth were not consistent predictors of colonization. This result may indicate migration to areas away from groundwater influenced sites during wetter periods, and reflect a general pattern of dynamic occupancy in headwater streams. Shifts in stream occupancy from year to year were also indicated by declines in extinction rates by approximately two-thirds from 2014 to 2015, while colonization rates remained relatively consistent. Colonization of previously dry sites could be occurring from nearby subterranean refugia (e.g.,Bendik & Gluesenkamp, 2013), indicating more extensive subterranean habitat beyond documented spring localities (Fig. 3). This is also consistent with our observations of occupancy in thermally stable habitats, as well as results from dye trace studies showing extensive subsurface stream conduits in these headwater streams (Hatch & Johns, 2015). Alternatively, colonization may be occurring via surface movements, as we have demonstrated that individuals are capable of traveling long distances. Collectively, these dynamic occupancy patterns suggest extensive use of stream channels byE. tonkawae and their ability to colonize intermittent habitats.
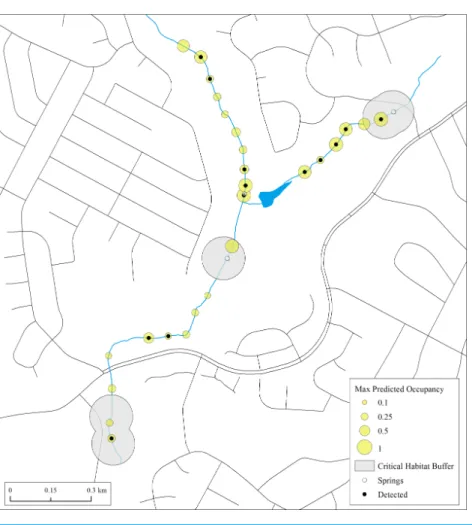
Results of both naïve and predicted occupancy highlight the extent to which E. tonkawae can occur beyond springs and previously documented localities. This is particularly evident in Trib 4, which had never been systematically surveyed prior to our study (Fig. 4). Thus, critical habitat based only on known localities in poorly searched areas may vastly underestimate species presence.
Figure 4 Maximum estimates of predicted occupancy forE. tonkawaefrom 2013–2015 in Bull Creek, Tributary 4, Travis County, Texas.Surface critical habitat is only shown for localities known prior to this study. Predicted values were calculated from initial habitat and occupancy states and their transition prob-abilities. Missing covariate values were replaced with tributary-specific means.
PaedomorphicEuryceaexhibit avoidance behaviors in response to chemical cues from fish (Epp & Gabor, 2008), and individuals may even learn to avoid types of habitat where they have previously encountered predators (Mathis & Unger, 2012). While not the focus of this study, we suggest that further examination of trade-offs between habitat stability, predator occurrence, and other changes to streams associated with urbanization may yield useful insights for management and conservation.
Maintaining population connectivity is of fundamental importance for recovery of amphibian populations (Semlitsch, 2002), and lack of critical habitat protections for stream reaches may increase the likelihood of habitat fragmentation. While land-use changes at the catchment level have the potential to drastically alter stream ecology (Morgan & Cushman, 2005;Walsh et al., 2005) and karst aquifer water quality (Musgrove et al., 2014), habitat continuity within streams is frequently disrupted by culverts, impoundments, utility infrastructure, channelization and other anthropogenic disturbances in urban areas. Even loss of riparian canopy cover can restrict stream-dwelling salamander movement (Cecala, Lowe & Maerz, 2014). Stream modifications (e.g., those requiring a Clean Water Act, Section 404 permit; 404, 33 U.S.C. §1344) are most likely to trigger the type of legal protections that are afforded by critical habitat designation through the interagency cooperation provision of the Endangered Species Act of 1973 (16 U.S.C.§1536(a)(2)). Although some might argue that federal administrative cooperation is the only protection afforded by critical habitat in the United States, these designations and their accompanying assumptions about the distribution and habitat of species may influence other conservation policy decisions as well. One example of this is the 4(d) rule for E. naufragia, which establishes specific conditions where take of this species is permitted. In essence, the rule is a list of guidelines for developers to follow in lieu of requiring an incidental take permit or Habitat Conservation Plan (US Fish and Wildlife Service, 2015b). The 4(d) rule was originally developed as an ordinance by the City of Georgetown and based on (yet-to-be finalized) critical habitat, and allows for disturbance of stream habitats outside 50 m of known localities. IfE. naufragiause stream habitats similarly to E. tonkawae, stream disturbances as allowed by this 4(d) rule could potentially lead to loss of stream habitats and fragmentation among populations. Conservation actions that target species recovery may fall short when critical habitat fails to protect metapopulation connectivity or accurately represent species’ habitat use.
CONCLUSIONS
or translocations to support recovery efforts (Camaclang et al., 2015). Known localities likely only represent a fraction of occupied areas for species that occur in subterranean and intermittent habitats, such as central TexasEurycea, further underscoring the need to test assumptions of habitat use. As others have argued (Hoekstra, Fagan & Bradley, 2002), we believe critical habitat should be designated biologically according to species habitat requirements, not just by historically-occupied sites, and that habitat models should be used to guide these designations. Estimates from species-habitat models may be used to predict occupancy dynamics under varying habitat/climate conditions, in other headwater streams, or for similar species. These predictions may provide guidance for conservation actions such as habitat restoration and site selection for species reintroductions as part of an adaptive management strategy. The success of recovery, however, is dependent upon the accurate recognition and protection of the full range of habitats necessary for species survival.
ACKNOWLEDGEMENTS
We thank the following people for assistance with field-work: Mark Sanders, Matt Westbrook, Liza Colucci, Tom Devitt, Donelle Robinson and Crystal Datri. Darryl MacKenzie and Abel Porras provided useful information on the analysis. Rob Clayton provided data management support. Jacob Owen, Tom Devitt, Donelle Robinson, Andy Gluesenkamp, John Maerz, Jean-Paul Léna and one anonymous reviewer gave helpful comments on the manuscript. We thank the City of Austin and Travis County Balcones Canyonlands Preserve staff for project approval and property access.
ADDITIONAL INFORMATION AND DECLARATIONS
Funding
Funding was provided by the City of Austin. The information in this document has been subject to review and approved by the City of Austin for publication. The funders had no role in study design, data collection and analysis, decision to publish, or preparation of the manuscript.
Grant Disclosures
The following grant information was disclosed by the authors: City of Austin.
Competing Interests
The authors declare there are no competing interests.
Author Contributions
• Nathan F. Bendik conceived and designed the experiments, performed the experiments, analyzed the data, wrote the paper, prepared figures and/or tables, reviewed drafts of the paper.
• Kira D. McEntire performed the experiments, analyzed the data, reviewed drafts of the paper.
Animal Ethics
The following information was supplied relating to ethical approvals (i.e., approving body and any reference numbers):
Methods were approved by state and federal permitting agencies. We performed all studies under the authority of Texas Parks & Wildlife scientific permit SPR-0113-006 and Federal Fish and Wildlife permit TE833851.
Field Study Permissions
The following information was supplied relating to field study approvals (i.e., approving body and any reference numbers):
We performed all studies under the authority of Texas Parks & Wildlife scientific permit SPR-0113-006 and Federal Fish and Wildlife permit TE833851.
Data Availability
The following information was supplied regarding data availability:
Data used for capture-recapture and occupancy analyses are available inSupplemental Information. The full suite of occupancy data is available at the following URL:
https://data.austintexas.gov/d/tzxa-xaix?category=Environmental&view_name=Jollyville-Salamander-Occupancy-Project-Data.
Supplemental Information
Supplemental information for this article can be found online athttp://dx.doi.org/10.7717/ peerj.1817#supplemental-information.
REFERENCES
Ashton RE, Ashton PS. 1978.Movements and winter behavior ofEurycea
bislin-eata(Amphibia, Urodela, Plethodontidae).Journal of Herpetology12:295–298
DOI 10.2307/1563609.
Barrett K, Price S. 2014.Urbanization and stream salamanders: a review, conservation
options, and research needs.Freshwater Science33:927–940DOI 10.1086/677556.
Bendik NF, Gluesenkamp AG. 2013.Body length shrinkage in an endangered amphibian
is associated with drought.Journal of Zoology290:35–41DOI 10.1111/jzo.12009.
Bendik NF, Meik JM, Gluesenkamp AG, Roelke CE, Chippindale PT. 2013a.
Biogeog-raphy, phylogeny, and morphological evolution of central Texas cave and spring salamanders.BMC Evolutionary Biology13:201 DOI 10.1186/1471-2148-13-201. Bendik NF, Morrison TA, Gluesenkamp AG, Sanders MS, O’Donnell LJ. 2013b.
Computer-assisted photo identification outperforms visible implant elas-tomers in an endangered salamander,Eurycea tonkawae.PLoS ONE8:e59424
DOI 10.1371/journal.pone.0059424.
Bendik NF, Sissel BN, Fields JR, O’Donnell LJ, Sanders MS. 2014.Effect of urbanization
Bishop SC, Wright MR. 1937.A new neotenic salamander from Texas.Proceedings of the Biological Society of Washington50:141–143.
Bolger DT, Morrison TA, Vance B, Lee D, Farid H. 2012.A computer-assisted system for
photographic mark–recapture analysis.Methods in Ecology and Evolution3:813–822
DOI 10.1111/j.2041-210X.2012.00212.x.
Bowles BD, Sanders MS, Hansen RS. 2006.Ecology of the Jollyville Plateau salamander
(Eurycea tonkawae: Plethodontidae) with an assessment of the potential effects of urbanization.Hydrobiologia553:111–120DOI 10.1007/s10750-005-5440-0.
Brownie C, Nichols JD, Pollock KH, Hestbeck JB. 1993.Studies for multiple strata
in-cluding non-Markovian transitions.Biometrics49:1173–1187DOI 10.2307/2532259.
Bruce RC. 1976.Population structure, life history and evolution of paedogenesis in the
salamanderEurycea neotenes.Copeia1976:242–249.
Bruce RC. 1986.Upstream and downstream movements ofEurycea bislineataand other
salamanders in a southern Appalachian stream.Herpetologica42:149–155.
Brune G. 1981.Springs of Texas. Volume I. Arlington: Gunnar Brune.
Camaclang AE, Maron M, Martin TG, Possingham HP. 2015.Current practices in
the identification of critical habitat for threatened species.Conservation Biology
29:482–492DOI 10.1111/cobi.12428.
Cecala KK, Lowe WH, Maerz JC. 2014.Riparian disturbance restricts in-stream
move-ment of salamanders.Freshwater Biology59:2354–2364DOI 10.1111/fwb.12439.
Cecala KK, Price SJ, Dorcas ME. 2009.Evaluating existing movement hypotheses
in linear systems using larval stream salamanders.Canadian Journal of Zoology
87:292–298DOI 10.1139/Z09-013.
Chippindale PT, Price AH. 2005. Conservation of Texas spring and cave salamanders
(Eurycea). In: Lannoo M, ed.Amphibian declines: the conservation status of United States species. Berkeley: University of California Press, 193–197.
Chippindale PT, Price AH, Hillis DM. 1993.A new species of perennibranchiate
salamander (Eurycea: Plethodontidae) from Austin, Texas.Herpetologica49:248–259.
Chippindale PT, Price AH, Wiens JJ, Hillis DM. 2000.Phylogenetic relationships and
systematic revision of central Texas hemidactyliine plethodontid salamanders. Herpetological Monographs14:1–80DOI 10.2307/1467045.
Choquet R, Lebreton J-D, Gimenez O, Reboulet A-M, Pradel R. 2009.U-CARE: utilities
for performing goodness of fit tests and manipulating CApture–REcapture data. Ecography32:1071–1074DOI 10.1111/j.1600-0587.2009.05968.x.
Christian LN, Banner JL, Mack LE. 2011.Sr isotopes as tracers of anthropogenic
influences on stream water in the Austin, Texas, area.Chemical Geology282:84–97
DOI 10.1016/j.chemgeo.2011.01.011.
City of Austin. 2015.Springs and seeps online database.Available athttps:// data.
austintexas.gov/ Environmental/ Springs-and-Seeps/ 2jmf-2fa8(Accessed 15 June 2015).
Culver DC, Master LL, Christman MC, Hobbs HH. 2000.Obligate cave fauna of the 48
contiguous United States.Conservation Biology14:386–401
Diaz PH, Fries JN, Bonner TH, Alexander ML, Nowlin WH. 2015.Mesohabitat associations of the threatened San Marcos salamander (Eurycea nana) across its geographic range.Aquatic Conservation: Marine and Freshwater Ecosystems
25:307–321DOI 10.1002/aqc.2559.
Dugger KM, Anthony RG, Andrews LS. 2011.Transient dynamics of invasive
competi-tion: Barred Owls, Spotted Owls, habitat, and the demons of competition present. Ecological Applications21:2459–2468DOI 10.1890/10-2142.1.
Epp KJ, Gabor CR. 2008.Innate and learned predator recognition mediated by chemical
signals inEurycea nana.Ethology114:607–615DOI 10.1111/j.1439-0310.2008.01494.x.
Falke JA, Bailey LL, Fausch KD, Bestgen KR. 2012.Colonization and extinction in
dynamic habitats: an occupancy approach for a Great Plains stream fish assemblage. Ecology 93:858–867DOI 10.1890/11-1515.1.
Fenolio DB, Niemiller ML, Bonett RM, Graening GO, Collier BA, Stout JF. 2014.Life
history, demography, and the influence of cave-roosting bats on a population of the Grotto Salamander (Eurycea spelaeae) from the Ozark Plateus of Oklahoma (Caudata: Plethodontidae).Herpetological Conservation and Biology9:394–405.
Grant EHC, Nichols JD, Lowe WH, Fagan WF. 2010.Use of multiple dispersal
pathways facilitates amphibian persistence in stream networks.Proceedings of the National Academy of Sciences of the United States of America107:6936–6940
DOI 10.1073/pnas.1000266107.
Hatch RL, Johns DA. 2015. Results of tracing for Lanier and Hog Wallow Springs in the
Balcones Canyonlands Preserve, Bull Creek. In:City of Austin Watershed Protection Department Report SR-15-02. 27 pages.Available atwww.austintexas.gov/ watershed_ protection/ publications/ document.cfm?id=230084.
Haurwitz RKM. 1993.Amphibian finds itself in middle of Austin debate: endangered
or not, the tiny Barton Springs salamander is becoming center of urban-growth argument.Austin-American Statesman(July 19, 1993): Section A4.
Haurwitz RKM. 1995.Bush opposes salamander protection.Austin-American Statesman
(July 26, 1995): Section A9.
Hestbeck JB, Nichols JD, Malecki RA. 1991.Estimates of movement and site fidelity
using mark-resight data of wintering Canada geese.Ecology72:523–533
DOI 10.2307/2937193.
Hillis DM, Chamberlain DA, Wilcox TP, Chippindale PT. 2001.A new species of
subterranean blind salamander (Plethodontidae: Hemidactyliini:Eurycea: Typhlo-molge) from Austin, Texas, and a systematic revision of central Texas paedomorphic salamanders.Herpetologica57:266–280.
Hines JE. 2006.PRESENCE- Software to estimate patch occupancy and related
parame-ters.Available athttp:// www.mbr-pwrc.usgs.gov/ software/ presence.html.
Hoekstra JM, Fagan WF, Bradley JE. 2002.A critical role for critical habitat in
the recovery planning process? Not yet.Ecological Applications12:701–707
Kerkvliet J, Langpap C. 2007.Learning from endangered and threatened species recovery programs: a case study using US Endangered Species Act recovery scores.Ecological Economics63:499–510DOI 10.1016/j.ecolecon.2006.12.007.
Krausse H. 1989.San Marcos River a war zone in fight against extinction.
Austin-American Statesman(April 9, 1989): Section B4.
Lee DE, Bond ML. 2015.Previous year’s reproductive state affects Spotted Owl site
occupancy and reproduction responses to natural and anthropogenic disturbances. The Condor117:307–319 DOI 10.1650/CONDOR-14-197.1.
Lowe WH. 2003.Linking dispersal to local population dynamics: a case study using a
headwater salamander system.Ecology84:2145–2154
DOI 10.1890/0012-9658(2003)084[2145:LDTLPD]2.0.CO;2.
Lukacs PM, Burnham KP, Anderson DR. 2010.Model selection bias and
Freed-man’s paradox.Annals of the Institute of Statistical Mathematics62:117–125
DOI 10.1007/s10463-009-0234-4.
Mackenzie DI, Bailey LL, Hines JE, Nichols JD. 2011.An integrated model of habitat
and species occurrence dynamics.Methods in Ecology and Evolution2:612–622
DOI 10.1111/j.2041-210X.2011.00110.x.
MacKenzie DI, Nichols JD, Royle JA, Pollock KH, Bailey LL, Hines JE. 2006.Occupancy
estimation and modeling: inferring patterns and dynamics of species occurrence. London: Academic Press.
MacKenzie DI, Seamans ME, Gutiérrez RJ, Nichols JD. 2012.Investigating the
popu-lation dynamics of California spotted owls without marked individuals.Journal of Ornithology 152:597–604DOI 10.1007/s10336-010-0544-6.
Martin J, Chamaillé-Jammes S, Nichols JD, Fritz H, Hines JE, Fonnesbeck CJ,
Macken-zie DI, Bailey LL. 2010.Simultaneous modeling of habitat suitability, occupancy,
and relative abundance: African elephants in Zimbabwe.Ecological Applications
20:1173–1182DOI 10.1890/09-0276.1.
Martin SD, Harris BA, Collums JR, Bonett RM. 2012.Life between predators and a small
space: substrate selection of an interstitial space-dwelling stream salamander.Journal of Zoology287:205–214DOI 10.1111/j.1469-7998.2012.00905.x.
Mathis A, Unger S. 2012.Learning to avoid dangerous habitat types by aquatic
salaman-ders,Eurycea tynerensis.Ethology118:57–62DOI 10.1111/j.1439-0310.2011.01987.x.
Matthysen E. 2005.Density-dependent dispersal in birds and mammals.Ecography
28:403–416DOI 10.1111/j.0906-7590.2005.04073.x.
Miller DAW, Brehme CS, Hines JE, Nichols JD, Fisher RN. 2012.Joint estimation
of habitat dynamics and species interactions: disturbance reduces co-occurrence of non-native predators with an endangered toad.Journal of Animal Ecology
81:1288–1297DOI 10.1111/j.1365-2656.2012.02001.x.
Milstead WW. 1951.A new locality record for the Texas neotenic salamander,Eurycea
latitans.Herpetologica7:57–58.
Morgan RP, Cushman SF. 2005.Urbanization effects on stream fish assemblages in
Maryland, USA.Journal of the North American Benthological Society24:643–655
Musgrove M, Katz BG, Fahlquist LS, Crandall CA, Lindgren RJ. 2014.Factors affecting public-supply well vulnerability in two karst aquifers.Groundwater 52:63–75
DOI 10.1111/gwat.12201.
Petranka JW. 1998.Salamanders of the United States and Canada. Washington D.C.:
Smithsonian Institution Press.
Pierce BA. 2012. Ecological studies of the Georgetown salamander (Eurycea naufragia)
at two sites in Williamson County, Texas, July 2011–July 2012. In:Report to the Williamson County Conservation Foundation, Georgetown, Texas. Georgetown: Williamson County Conservation Foundation, 34.
Pierce BA, Christiansen JL, Ritzer AL, Jones TA. 2010.Ecology of Georgetown
salaman-ders (Eurycea naufragia) within the flow of a spring.The Southwestern Naturalist
55:291–297DOI 10.1894/WL-30.1.
Pierce BA, McEntire KD, Wall AE. 2014.Population size, movement, and reproduction
of the Georgetown salamander,Eurycea naufragia.Herpetological Conservation and Biology9:137–145.
Pittman SE, Osbourn MS, Semlitsch RD. 2014.Movement ecology of amphibians: a
missing component for understanding population declines.Biological Conservation
169:44–53DOI 10.1016/j.biocon.2013.10.020.
R Core Team. 2014.R: a language and environment for statistical computing. Vienna: R
Foundation for Statistical Computing.Available athttp:// www.R-project.org/.
Rachlinski JJ. 1997.Noah by the numbers: an empirical evaluation of the Endangered
Species Act.Cornell Law Review82:356–389.
Rasband WS. 1997.ImageJ. Available athttp:// imagej.nih.gov/ ij/.
Reddell JR. 1994. The cave fauna of Texas with special reference to the western Edwards
Plateau. In: Elliot WR, Veni G, eds.The caves and karst of Texas. Huntsville: National Speleological Society, 31–50.
Rosenfeld JS, Hatfield T. 2006.Information needs for assessing critical habitat of
freshwater fish.Canadian Journal of Fisheries and Aquatic Sciences63:683–698
DOI 10.1139/f05-242.
Semlitsch R. 2002.Critical elements for biologically based recovery plans of aquatic
breeding amphibians.Conservation Biology16:619–629
DOI 10.1046/j.1523-1739.2002.00512.x.
Sharp JM. 2010.The impacts of urbanization on groundwater systems and recharge.
AQUAmundiAm01008:51–56DOI 10.4409/Am-004-10-0008.
Steffen M, Irwin K, Blair A, Bonett R. 2014.Larval masquerade: a new species of
paedo-morphic salamander (Caudata: Plethodontidae:Eurycea) from the Ouachita Moun-tains of North America.Zootaxa3786:423–442 DOI 10.11646/zootaxa.3786.4.2.
Stejneger L. 1896.Description of a new genus and species of blind tailed batrachians
from the subterranean waters of Texas.Proceedings of the United States National Museum18:619–621DOI 10.5479/si.00963801.1088.619.
Stoneburner D. 1978.Salamander drift: observations on the two-lined salamander
(Eurycea bislineata).Freshwater Biology8:291–293
Sweet SS. 1978.The evolutionary development of the TexasEurycea(Amphibia: Plethodontidae). Ph.D. thesis, University of California, Berkeley.
Sweet SS. 1982.A distributional analysis of epigean populations ofEurycea neotenesin
central Texas, with comments on the origin of troglobitic populations.Herpetologica
38:430–444.
Sweet SS. 1984.Secondary contact and hybridization in the Texas cave salamanders
Eurycea neotenesandE. tridentifera.Copeia1984:428–441DOI 10.2307/1445201.
Takekawa JE, Beissinger SR. 1989.Cyclic drought, dispersal, and the conservation of
the snail kite in Florida: Lessons in critical cabitat.Conservation Biology3:302–311
DOI 10.1111/j.1523-1739.1989.tb00090.x.
Taylor MFJ, Sucking KF, Rachlinski JJ. 2005.The effectiveness of the Endangered
Species Act: a quantitative analysis.BioScience55:360–367
DOI 10.1641/0006-3568(2005)055[0360:TEOTES]2.0.CO;2.
Tumlison R, Cline GR. 1997.Further notes on the habitat of the Oklahoma Salamander,
Eurycea tynerensis.Proceedings of the Oklahoma Academy of Science77:103–106.
Tupa DD, Davis WK. 1976.Population dynamics of the San Marcos salamander,Eurycea
nanaBishop.Texas Journal of Science27:179–195.
Turner JC, Douglas CL, Hallum CR, Krausman PR, Ramey RR. 2004.Determination
of critical habitat for the endangered Nelson’s bighorn sheep in southern California. Wildlife Society Bulletin32:427–448
DOI 10.2193/0091-7648(2004)32[427:DOCHFT]2.0.CO;2.
US Fish and Wildlife Service. 2009.Endangered and threatened wildlife and plants;
par-tial 90-day finding on a petition to list 475 species in the southwestern united states as threatened or endangered with critical habitat.Federal Register 74:66866–66905.
US Fish and Wildlife Service. 2012.Endangered status for four central texas salamanders
and designation of critical habitat; proposed rule.Federal Register 77:50768–50854.
US Fish and Wildlife Service. 2013.Designation of critical habitat for the Austin Blind
and Jollyville Plateau salamanders; final rule.Federal Register 78:51328–51379.
US Fish and Wildlife Service. 2015a.Endangered and threatened wildlife and plants;
90-Day findings on 31 petitions.Federal Register 80:37568–37579.
US Fish and Wildlife Service. 2015b.Endangered and threatened wildlife and plants;
4(d) Rule for the Georgetown Salamander.Federal Register 80:47418–47428. Walsh CJ, Roy AH, Feminella JW, Cottingham PD, Groffman PM, Morgan II
RP. 2005.The urban stream syndrome: current knowledge and the search
for a cure.Journal of the North American Benthological Society 24:706–723
DOI 10.1899/0887-3593(2005)024[0706:TUSSCK]2.0.CO;2.
Wermund B. 2012.Congressman to introduce legislation to block salamander listings.
Austin-American Statesman. Available athttp:// www.statesman.com/ news/ news/ local/ congressman-to-introduce-legislation-to-block-sa-1/ nRpZY/ (accessed 21 October 2015).