www.arch-anim-breed.net/59/435/2016/ doi:10.5194/aab-59-435-2016
© Author(s) 2016. CC Attribution 3.0 License. Archives Animal Breeding
Characterization of morphological and meristic traits and
their variations between two different populations (wild
and cultured) of
Cichlasoma festae
, a species native to
tropical Ecuadorian rivers
Martín A. González1, Jorge M. Rodriguez1, Elena Angón2, Andrés Martínez2, Antón Garcia2, and Francisco Peña2
1Technical State University of Quevedo, Quality Control Department,
Av. Quito km 1.5 Vía Santo Domingo de los Tsáchilas, Quevedo, Ecuador
2University of Córdoba, Animal Production Department, Ctra. Madrid-Cádiz Km. 396-a, 14071 Córdoba, Spain
Correspondence to:Elena Angón ([email protected])
Received: 7 September 2016 – Revised: 13 October 2016 – Accepted: 18 October 2016 – Published: 31 October 2016
Abstract. This study was carried out to determine morphometric and meristic characteristics of two popula-tions (wild and cultured) ofCichlasoma festae and to establish whether populations could be discriminated based on morphometric variability. Twenty-two morphometric and four meristic characters were used to test the hypothesis differentiation. Univariate analysis of variance (ANOVA) from 100 adult specimens showed signif-icant differences (p <0.05) for 21 standardized morphometric measurements out of 26 characters among the means of the wild and culturedCichlasoma festaepopulations tested. Cross correlation amongst certain mor-phometric variables (i.e. body weight, total length, standard length, pre-ventral length, AC1, LC1 and P1) were medium-strong (r≥0.5), while the remaining were weakly correlated (r <0.5). The length–weight relationship parameterband condition factor (K) values were respectively 2.21 and 1.97 (indicating allometric growth) for cultured fish groups and 2.86 and 4.07 (p <0.05) for wild fish groups. The condition factor values were signifi-cantly different from each other and showed that feeding of cultured fish should be improved. Both groups were accurately separated (>80 % success rate) by linear discriminant functions that included only four morphometric measures.
1 Introduction
In Ecuador, human communities in coastal as well as inland areas greatly depend on fishery for their incomes and as their source of animal protein (Espinosa-Lemus et al., 2009). En-vironmental degradation and habitat destruction have caused the decline in the production of fishery resources from the wild, which have diminished greatly (Ajah et al., 2006). Therefore, the domestication of certain fish species is nec-essary for intensive cultivation in captivity.
The morphometric study of fish is a powerful tool for char-acterizing strains and/or stocks of the same species which in-volves the detection of subtle variation in shape, independent of size. These examinations require exact measurements and
partly attributed to intraspecific variability, which is un-der the influence of environmental parameters (Wimberger, 1992). Fish are very sensitive to environmental changes and quickly adapt by changing necessary morphometric charac-ter (Cabral et al., 2003; Hossain et al., 2010). Morphomet-ric variation between stocks may be applicable for studying short-term environmentally induced variation (Pinheiro et al., 2005). In addition, while both morphometric and meristic characters respond to changes in environmental factors, their responses are different in some situations and can differ from species to species. Finally, is important to farmers to know the differences between cultured and wild fish of different species; this could lead them to understand the chemical, physical, nutritional and sensorial profiles of the wild animal and try to reproduce these in their cultured products (Orban et al., 2003).
In Ecuador, fisheries contribute 7 % to the total supply of animal protein, estimated at 391 700 t catches made by cap-ture fisheries in 2011 (FAO, 2011). These catches are made by artisanal fishermen in areas of rivers, lakes, ponds, la-goons, gorges and dams. This activity is performed through-out the year in areas of rivers (Muñoz et al., 2014) or be-tween May and January in other inland areas. Cichlasoma festae, among the freshwater fish (Boulenger, 1899), is a teleost fish (Luna-Figueroa, 2000), native to the continen-tal South America, with a high presence in Ecuador. It is among the nine commercially important species that inhabit the inland waters of Ecuador, Colombia and Peru (Revelo and Elias, 2004). It can be found in rivers, lakes, ponds and dams (Pacheco and Chicaiza, 2008) and noted for its white meat, excellent taste and high acceptance in local cuisine (Barnhill et al., 1974).
In order to produce and preserve this native species, the state administration created the Cachari Experimental Sta-tion, located in Babahoyo in the province of Los Ríos, where a conservation programme for native species is currently be-ing developed by the Subsecretaría de Acuacultura of Minis-terio de Agricultura, Ganadería, Acuacultura y Pesca (MA-GAP). At this experimental station, fingerlings were pro-duced for distribution to farmers and to repopulate the rivers. According to MAGAP, the cultivation ofCichlasoma festae is becoming more and more popular due to its good growth rate, fecundity, ease of manipulation, ability to grow under suboptimal environmental conditions, disease resistance and good consumer acceptance.
Understanding the morphometrics of the fish species will enhance the development of cost-effective aquaculture proto-cols and thus increase in productivity. Although comparisons of the morphology between cultured and wild fishes from several species have already been carried out by a number of authors (Swain et al., 1991; Ponton and Mérigoux, 2000;
been studied and, to the best of our knowledge, this is the first such study that has focused on examining the extent of their morphological variations in cultured and wild environments. Since this information is vital for the proper management of the fisheries and for optimum utilization of the resources, the aim of the current research was to assess the morpholog-ical and meristic traits ofCichlasoma festaecaught in differ-ent habitats (cultured and wild). This will help in planning further breeding and conservation strategies for this fish and improving productivity.
2 Material and methods
2.1 Data and sampling
The study included three areas of the Babahoyo River and a fish farm in the province of Los Ríos (Ecuador). The cli-mate of the area is tropical with an average temperature of 25◦C, an annual rainfall of 2400 mm and a relative
humid-ity of 82 %. The salinhumid-ity of water, both in the river and the fish farm, did not exceed 0.1 %; the pH was between 7.0 and 7.29; the temperature ranged between 19.7◦C in the river and
24.7◦C in cultured fish; and dissolved oxygen was between
6.8 and 8.9 mg L−1 in the river and fish farm, respectively.
The conductivity values were about 145 mS cm−1.
One hundred matured fish samples (following the rules de-scribed by Frost and Kipling, 1980; Chávez-Lomelí et al., 1988; Konings, 1989) ofCichlasoma festae, comprising 50 individuals from natural habitat (wild population) and 50 from a cultured environment (private fish farms, cultured stock), were collected at dawn over the month of May 2016 with the help of standard fishing gears such as cast and hand nets. Since males and females could not be differen-tiated morphologically, sexing of the sampled fish was not carried out. Specimen collection was performed weekly by purchasing representative samples of the two selected popu-lations from local fishermen (wild fish) or a fish farm (cul-tured fish). Wild fish were caught from three different loca-tions within their natural geographic distribuloca-tions in Baba-hoyo River (Los Ríos province, Ecuador). Cultured fish were collected from the fish farm. Directly after catching, the fish were placed at the same time in a mixture of 40 L of ice and 40 L of water (0.8◦C) until their apparent stunning (20 min)
was over. After confirmation of their death, the fish were identified and weighed, and then morphometric measure-ments and meristic counts were performed.
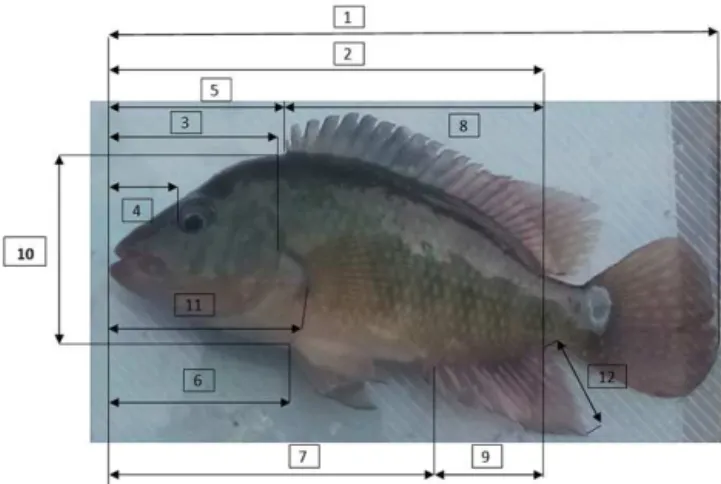
Figure 1.The morphometric measurements registered in each
anal-ysed organism (source: own elaboration). 1: total length (TL); 2: standard length (SL); 3: head length (HL); 4: pre-orbital length (Pre-OL); 5: pre-dorsal length (Pre-DL); 6: pre-ventral length (Pre-VL); 7: pre-anal length (Pre-AL); 8: dorsal fin length (DFL); 9: pharyn-geal bone length (PhBL); 10: maximum height body (MaxBH); 11: pectoral fin length (PFL); 12: anal fin length (AFL).
2.2 Body measurements
Lineal morphometric measurements were taken on the left side of fish, by the same person in order to minimize arti-ficial error, and most of the morphometric characters were measured following the conventional method described by Morales et al. (1998) and Diodatti et al. (2008). The fish were measured using a measuring board, measuring tape and digi-tal callipers graduated in millimetres and then weighed with an electronic weighing balance up to the nearest 0.1 g (Figs. 1 and 2). Meristic characteristics were examined according to Froese and Pauly (2007). A total of 26 body measurements were used, including 21 morphometric variables and 4 meris-tic variables (Table 1).
2.3 Fulton condition factor (K)
The Fulton condition factor (K), which is defined as the well-being of the fish, was calculated. K is a useful index for monitoring of feeding intensity, age and growth rates. The K was calculated with the following equation: K= (100×BW)/SL3, where BW refers to body weight of fish in grams and SL is the standard length of fish in centimetres.
2.4 Length–weight relationship
Length–weight relationships were calculated using the allo-metric regression analysis (Sasi and Berber, 2012). Length– weight was expressed as BW=a×SLb, the logarithm trans-formation of which gives the linear equation log BW=a+ (b×log SL), where BW refers to body weight of fish in grams, SL is the standard length of fish in centimetres,a is the constant for the initial growth index andbis the growth
Figure 2.The morphometric measurements registered in each anal-ysed organism (source: own elaboration). AC1: body depth at the first ray of the dorsal fin; AC2: body depth at the level of the first ray of the anal fin; AC3: body depth at the level of the first radius of the caudal fin; P1: body perimeter of the body at the level of the first ray of the dorsal fin; P2: body perimeter at the level of the first ra-dius of the anal fin; P3: body perimeter at the level of the last ray of the dorsal fin; LC1: head width; LC2: trunk width; LC3: tail width.
coefficient. Constantsa andb represent the point at which the regression line intercepts they axis and the slope of the regression line, respectively.
2.5 Statistical analyses
All statistical analyses were performed using SAS Univer-sity Edition 3.5 (SAS Institute, Cary, NC). Each collection site was considered a priori as a discrete group. To eval-uate whether the data have equal variances, a Bartlett test was done prior to further analyses. Means, standard devia-tion (SD) and coefficient of variadevia-tion (CV %) were recorded for each population.
The morphometric (continuous) and meristic (discrete) data were analysed separately. Since meristic characters are independent of size and did not change during growth (Tu-ran et al., 2006), the raw data were used in analysis. How-ever, to avoid possible biases produced by size effects on the morphometric variables, all morphometric characters were standardized by the following equation (Elliott et al., 1995): Madj=M(Ls/Lo)b, whereM is the original morphometric measurement, Madj the size adjusted measurement,Lo the
standard length of fish andLs the overall mean of standard
length for all fish from all samples for each variable. The parameterb was estimated for each character from the ob-served data as the slope of the regression of logMon logLo,
Morphometric variables
Body weight BW Measured as total weight including gut and gonads
Total length TL Measured from the middle of the upper lip of the mouth to the caudal end of the caudal fin Standard length SL Measured between the central portion of the upper lip of the mouth and the base of the caudal
fin
Head length HL Distance between the most cranial point of the upper lip of the mouth and the rear end of the operculum
Pre-orbital length Pre-OL Distance between the most cranial point of the lower lip of the mouth and the cranial edge of the eye
Pre-dorsal length Pre-DL Distance between the most cranial point of the lower lip and the start of the first dorsal spine Pre-ventral length Pre-VL Distance between the most cranial point of the lower lip and the start of the first spine of the
ventral fin
Pre-anal length Pre-AL Distance between the most cranial point of the lower lip and the beginning of the anal orifice Dorsal fin length DFL Distance from the most cranial point of the base of the fin to the caudal end of the dorsal fin Pharyngeal bone length PhBL Distance from the most cranial point of the base of the fin to the caudal end of the anal fin Maximum height body MaxBH Distance between the most cranial point of the pectoral fin and the lateral line
Pectoral fin length PFL Distance between the base point cranial flap to the rear end of greater radii Anal fin length AFL Distance from the most cranial point of the base of the fin to the end of anal fin Body depth AC1 Measured with a calliper, at the first ray of the dorsal fin
Body depth AC2 Measured with a ruler, at the level of the first ray of the anal fin Body depth AC3 Measured with a calliper, at the level of the first radius of the caudal fin Head width LC1 Distance from side to side at the level of the flow side of the head
Trunk width LC2 Distance from side to side at the level of the most cranial point of the anal fin side Tail width LC3 Distance from side to side at the level of the last thorn on the back side
Body perimeter P1 Measured with measuring tape, at the level of the first ray of the dorsal fin Body perimeter P2 Measured with measuring tape, at the level of the first radius of the anal fin Body perimeter P3 Measured with measuring tape, at the level of the last ray of the dorsal fin
Meristic variables
Dorsal fin rays DFR Count of thorns has the dorsal fin from start to finish
Radius dorsal fin RDF Count of cartilage found in the space between thorns from start to finish Anal fin rays AFR Count of thorns has the anal fin from start to finish
Radius anal fin RAF Count of cartilage found in the space between thorns from start to finish
Size-adjusted morphometric data and meristic characters were compared by univariate analysis of variance (ANOVA procedure) and Kruskal–Wallis test (NPAR1WAY proce-dure), respectively, using the group (cultured or wild) as the fixed effect. In addition, the DISCRIM procedure was used to perform a canonical discriminant analysis of both size-adjusted morphometric data and meristic characters. The variables that would be included as predictors in the canon-ical discriminant function were previously selected with the STEPDISC procedure. The probabilities to enter and to stay in the model were both set at 0.05.
3 Results
3.1 Morphometric characters
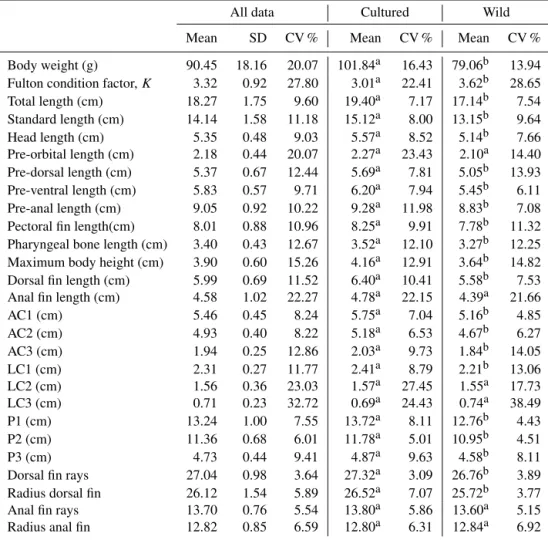
Morphometric and meristic traits mean values ofCichlasoma festaefrom cultured and wild specimens are shown in Ta-ble 2.
Cichla-Table 2.Descriptive statistics of the morphometric and meristic characters (original data) fromCichlasoma festae.
All data Cultured Wild
Mean SD CV % Mean CV % Mean CV %
Body weight (g) 90.45 18.16 20.07 101.84a 16.43 79.06b 13.94 Fulton condition factor,K 3.32 0.92 27.80 3.01a 22.41 3.62b 28.65
Total length (cm) 18.27 1.75 9.60 19.40a 7.17 17.14b 7.54
Standard length (cm) 14.14 1.58 11.18 15.12a 8.00 13.15b 9.64
Head length (cm) 5.35 0.48 9.03 5.57a 8.52 5.14b 7.66
Pre-orbital length (cm) 2.18 0.44 20.07 2.27a 23.43 2.10a 14.40 Pre-dorsal length (cm) 5.37 0.67 12.44 5.69a 7.81 5.05b 13.93
Pre-ventral length (cm) 5.83 0.57 9.71 6.20a 7.94 5.45b 6.11
Pre-anal length (cm) 9.05 0.92 10.22 9.28a 11.98 8.83b 7.08
Pectoral fin length(cm) 8.01 0.88 10.96 8.25a 9.91 7.78b 11.32 Pharyngeal bone length (cm) 3.40 0.43 12.67 3.52a 12.10 3.27b 12.25 Maximum body height (cm) 3.90 0.60 15.26 4.16a 12.91 3.64b 14.82 Dorsal fin length (cm) 5.99 0.69 11.52 6.40a 10.41 5.58b 7.53 Anal fin length (cm) 4.58 1.02 22.27 4.78a 22.15 4.39a 21.66
AC1 (cm) 5.46 0.45 8.24 5.75a 7.04 5.16b 4.85
AC2 (cm) 4.93 0.40 8.22 5.18a 6.53 4.67b 6.27
AC3 (cm) 1.94 0.25 12.86 2.03a 9.73 1.84b 14.05
LC1 (cm) 2.31 0.27 11.77 2.41a 8.79 2.21b 13.06
LC2 (cm) 1.56 0.36 23.03 1.57a 27.45 1.55a 17.73
LC3 (cm) 0.71 0.23 32.72 0.69a 24.43 0.74a 38.49
P1 (cm) 13.24 1.00 7.55 13.72a 8.11 12.76b 4.43
P2 (cm) 11.36 0.68 6.01 11.78a 5.01 10.95b 4.51
P3 (cm) 4.73 0.44 9.41 4.87a 9.63 4.58b 8.11
Dorsal fin rays 27.04 0.98 3.64 27.32a 3.09 26.76b 3.89
Radius dorsal fin 26.12 1.54 5.89 26.52a 7.07 25.72b 3.77
Anal fin rays 13.70 0.76 5.54 13.80a 5.86 13.60a 5.15
Radius anal fin 12.82 0.85 6.59 12.80a 6.31 12.84a 6.92
AC1: body depth at the first ray of the dorsal fin; AC2: body depth at the level of the first ray of the anal fin; AC3: body depth at the level of the first radius of the caudal fin; LC1: head width between the right and left point at the level of the flow side of the head; LC2: trunk width between the right and left at the level of the most cranial point of the anal fin side; LC3: tail width between the right and left at the level of the last thorn on the back side; P1: body perimeter of the body at the level of the first ray of the dorsal fin; P2: body perimeter at the level of the first radius of the anal fin; P3: body perimeter at the level of the last ray of the dorsal fin.
a,bWithin a row, means without a common superscript are different (p <0.05).
soma festaefrom the two populations were not significantly different from each other.
The TL, HL, Pre-VL, AC1, AC2, P1, P2 and P3 showed a coefficient of variation lower than 10 %; SL, Pre-DL and Pre-AL, PFL, PhBL, MaxBH, DFL, AC3 and LC1 showed a coefficient of variation between 10 and 20 %; and the BW, Pre-OL, AFL, LC2 and LC3 showed coefficients of variation greater than 20 %. The coefficients of variation of different morphometric characters were not significantly (p <0.05) different between populations, except for Pre-OL, Pre-DL, Pre-AL, AC3, LC2 and LC3.
The meristic characters showed mean values of 27.04±1.0, 26.12±1.5, 13.70±0.8 and 12.82±0.9 for DFR, RDF, AFR and RAF, respectively, with no sig-nificant difference (p <0.05) among populations. The
coefficients of variation were very low (<7 %) and similar between populations.
dif-and body perimeter (P1, P2, P3) represented 38 %, 28 %, 39 to 14 %, 16 to 5 % and 94 to 34 %, respectively. The ratios of TL, Pre–VL, Pre–VL, DFL, AC1, AC2, P1 and P2 with SL showed a coefficient of variation lower than 10 %; ratios BW, HL, Pre–DL, Pre–AL, PFL, PhBL, MaxBH, AC3, LC1 and P3 with SL showed a coefficient of variation between 10 and 20 %, while ratios of Pre–OL, AFL, LC2 and LC3 showed coefficients of variation greater than 20 %. In gen-eral, the coefficients of variation of the indices are slightly lower than those recorded in the corresponding morphologi-cal measurements.
Among populations, the BW/SL was significantly higher (p <0.05) in the cultured population, while the ratios of HL/SL, Pre-AL/SL, PFL/SL, PhBL/SL, AC1/SL, AC2/SL, LC1/SL, LC2/SL, LC3/SL, P1/SL, P2/SL and P3/SL were significantly higher (p <0.05) in the wild population. Based on these relationships, wild fish were pro-portionately more profound at the cranial level than cultured, without significant differences (p >0.05) at the caudal level. Likewise, at the cranial and caudal levels, they were propor-tionally wider. All of this caused the body perimeter/SL ratios, both at cranial and caudal levels significantly, to be lower (p <0.05) in cultured fish.
After standardizing according to Elliot et al. (1995), the mean values of BW, TL, SL and HL were 90.38±1.87, 18.32±0.13, 14.14±0.16 and 5.36±0.06 cm, respectively. The habitat had a significant effect (p <0.05) in some of the morphometric characters evaluated. BW, TL, SL, HL, Pre-VL, DFL, AC1, AC2, AC3 and P2 were significantly higher (p <0.05) in cultured specimens. AFL, LC1 and P1 tended to be higher (p <0.1) in the cultured population.
3.2 Fulton condition factor
The mean value of the condition factorKwas 3.32±0.9 (Ta-ble 2) for the original data set, with mean values of 3.01 and 3.62 for cultured and wild populations, respectively. The co-efficient of variation was high (27.8 %). Once the data were adjusted to SL (Elliot et al., 1995), the mean value of the condition factorKwas 3.47±0.15, with significantly higher values (p <0.001) in the wild than in the cultured popula-tion, where the values were 4.07±0.24 and 2.86±0.12, re-spectively.
3.3 Length–weight relationship
The parameter b of the fish studied ranged from a mini-mum of 1.57 to a maximini-mum of 2.46, with a mean value of 2.096±0.078, and with a slightly higher average value in cultured fish when compared with wild fish (2.21 vs. 1.97).
Constant −441.77 −375.03
SL 19.77 17.80
Pre-VL 41.88 38.83
AC2 57.95 54.36
AFL 8.19 7.47
SL: standard length; Pre-VL: pre-ventral length; AC2: body depth at the level of the first ray of the anal fin; AFL: anal fin length.
3.4 Relationships between morphometric characters
The morphometric relationships between numerous body parts of fish can be used to determine possible difference between separate unit stocks of the same species (King, 2007). Several significant (p <0.05) positive correlations were found between the morphometric and meristic charac-ters of the two populations (data not shown). Most correla-tion coefficients were between 0.3 and 0.5. The results reveal that the size effect was almost entirely eliminated in the pop-ulations during analysis as there were no significant correla-tions between TL and SL, with most of the remaining param-eters measured with the analysed characters. Meristic charac-ters, except for RDF, are not significantly related (p >0.05) to each other or other morphometric characters.
3.5 Discriminant analysis
Four morphometric variables (SL, Pre-VL, AC2, AF1) out of 23 were selected as predictors in the canonical discrimi-nant analysis (Table 3). Wilks’ lambda (0.39;p <0.001) in-dicated that the data were appropriate for discriminant anal-ysis, whereas the eigenvalue (1.54) and canonical correlation (0.78) showed that the canonical function had very good dis-crimination ability.
Regarding meristic variables, the only RDF was selected as predictor and, despite the Wilks’ lambda statistical sig-nificance (p <0.01), the eigenvalue and the canonical corre-lation were very low (0.09 and 0.29, respectively). The ob-tained Fisher’s linear discriminant functions correctly classi-fied 61 and 58 % of the original grouped cases in the original and cross-validated classification matrices, respectively.
4 Discussion
4.1 Morphometric characters
According to Turan et al. (2006), the introduction and do-mestication of a fish species (especially those from the wild) leads to high adaptation to a wide range of geographical lo-cations, which leads to phenotypic variations with respect to the pure stock (strains) of the brood stock. In order to know the ecological variation and to evaluate morphological dif-ferences between wild and cultured fish of the same species, different authors have used morphometric and meristic vari-ables (Narváez et al., 2005; Fagbuaro et al., 2015; Solomon et al., 2015) to quantify biological variation and identify and ex-plain adaptive processes of different populations of the same species.
On the basis of the classification of Negi and Nau-tiyal (2002), of the morphological characters studies from Barilius bendelisis and Barilius vagra, 12 characters were genetically controlled, 8 characters were intermediate and 7 characters were environmentally controlled. Twenty-one characters have been studied in percentage of standard fish length, from which seven characters were genetically con-trolled, nine characters were intermediate and five characters were environmentally controlled.
In the current study, it has been observed that the meris-tic counts did not change with increasing or decreasing body weight and length of the fish. Similar variations in meristic characters were reported in many fishes such asNematalosa nasus (Al-Hassan, 1987),Pseudobagrus ichikawai (Watan-abe, 1998),Pterophyllum scalare(Bibi-Koshy et al., 2008), Garra gotyla gotyla(Gray) (Brraich and Akhter, 2015).
This study recorded significant differences (p <0.05) be-tween populations in 11 morphometric parameters, in agree-ment with Fagbuaro et al. (2005) and Solomon et al. (2015). Barriga-Sosa et al. (2004), after analysing morphometric characters in natural and domesticated populations of Nile tilapia (Oreochromis niloticus), reported morphological dif-ferences among these populations. Likewise, Narváez et al. (2005) found significant differences between the two populations (wild and cultured) ofOreochromis niloticusin northern Colombia; differences were attributed to food, en-vironmental conditions and the type of habitat (wild and cul-tured). However, in the present study, not all meristic charac-ters registered showed significant differences between pop-ulations, in contrast to the results obtained by Solomon et al. (2005) in Clarias gariepinus. The discrepancy between
results could be attributed to the characters studied in each work.
In the present study, TL/SL and DFL/SL ratios were not significantly (p >0.05) different between cultured and wild specimens, in contrast to results obtained by El-Zaeem et al. (2012). While there is overlap between the two works in the differences between populations (cultured and wild) in the ratio between the standard length and depth and width of the body. These authors point out that the highest mean value of TL/SL in Nile tilapia (Oreochromis niloticus) was recorded by cultured population and differed significantly (P <0.05) from that of the wild population. Also, the mean value of HL/AC1 ratio was not significantly different be-tween populations (wild and cultured), in contrast to the re-sults offered by Narváez et al. (2005), who observed that do-mesticated individuals were characterized by sharper heads than those of naturalized fish. Solomon et al. (2015) recorded significant differences in the ratio HL/SL in wild (23.7) and cultured (26.6) populations ofC. gariepinus. Similarly, Vreven et al. (1998) and Barriga-Sosa et al. (2004) indicated that the biggest differences between wild and cultured popu-lations were presented at the head. The value of this relation-ship and other relationrelation-ships between morphometric charac-ters is closely linked to the species, so it is not surprising that differences can be registered between studies. Thus, Van der Bank et al. (1989) reported mean values from 0.29 to 0.34 for HL/SL and 0.31 to 0.45 for body depth/SL in fifteen ci-chlid fish species endemic to southern Africa, whereas in our study means the values for these ratios were 0.38 and 0.39, respectively. Brraich and Akter (2015) inGarra gotyla gotyla (Gray) recorded mean values of 0.27 and 0.18, respectively. According Vreven et al. (1998) the confinement of domesti-cated fish affects their growth rate, without allowing elongate the body, which would result in a higherKvalue. Contrary to this, in our work the value ofKis higher in wild specimens.
4.2 Fulton condition factor (K)
Condition factor is a useful index for the monitoring of feed-ing intensity, age and growth rates in fish (Oni et al., 1983). It is strongly influenced by both biotic and abiotic environ-mental conditions and can be used as an index to assess the status of the aquatic ecosystem in which fish live.
re-dition factor until the age of 5 years (from 1.6 to 2.5) and a drop below.
In disagreement with Fagbuaro et al. (2015), the condition factorKwas higher in the wild population. This implies that the fish from the cultured population may not have been fed to the required level.
4.3 Length–weight relationship
In the present study, the length–weight relationship parame-terbis lower than in many studies (Abdallah, 2002; Bayhan et al., 2008; Sasi and Berber, 2012) and close (2.27–2.46) to that obtained by Fagbuaro et al. (2015), although it is lo-cated in the range of values (1.51–3.49) indilo-cated by Bok et al. (2011). This study shows that the fish from both the cul-tured and wild fish population have exhibited no isometric relative growth, which does not maintain their specific body shape throughout their life. These results also showed that both wild and cultured habitats do not provide enough food to maintain an isometric growth.
In contrast to the results obtained by Fagbuaro et al. (2015) (2.27 for farmed fish and 2.46 for wild fish), in the present study the parameterbwas higher in the cultured population.
4.4 Correlation among morphometric variables
Out of 26 characters, 2 characters show high values of correlation coefficient and 24 characters show moderate to low correlation coefficient. In Cichlasoma festae, BW was found to be the most correlated part. In general, the cor-relation coefficients between morphological variables were slightly higher among wild fish, and clearly lower than those recorded by Brraich and Akhter (2015) in Garra gotyla gotyla. Chukwuemeka et al. (2014) recorded correlation co-efficients between live weight and standard length of 0.76 to 0.94 in Tilapia galilaea,Tilapia aureaand Auchenogla-nis occidentalis from Tagwai Lake (Nigeria). The varia-tions observed in correlation coefficients of the morphomet-ric and meristic data for wild and culturedCichlasoma festae, aligned with the results obtained by Solomon et al. (2015), could be strongly linked to feeding pattern, environmental conditions and genetic variability. Also, there is sufficient ev-idence to prove the influence of habitat on fish morphology (Turan et al., 2006).
4.5 Discriminant analysis
Canonical discriminant analysis demonstrated a clear influ-ence of origin in the morphometric variables and a low effect in the meristic characters measured in the present work. The fact that only four morphometric variables were needed to
tic counts in the differentiation of populations of the same species. The meristic counts showed a very low variabil-ity and overlapped broadly, showing no divergence among the populations, in agreement with several authors (Gacitúa et al., 2008; El-Zaeem et al., 2012; Solomon et al., 2015). These characters, due to their relative stability, cannot give the necessary variability in measurements which is essential for multivariate analysis and stock discrimination studies.
Although the causes of morphological differences between populations are often quite difficult to explain, the morpho-metric differences between the cultured and wild Cichla-soma festae could have been linked to environmental fac-tors; furthermore, breeding over several years may have di-luted the initial gene pool of the domesticated fish, leading to genetic variation (translating to morphological differences) (Solomon et al., 2015).
5 Conclusions
Our results show that the rearing system significantly influ-ences most of the analysed morphometric and meristic char-acteristics of the two populations (wild and cultured) of Ci-chlasoma festae. Twenty-two morphometric and four meris-tic characters were used to test the hypothesis differentia-tion. Univariate analysis of variance showed significant dif-ferences for 21 standardized morphometric measurements out of 26 characters among the means of the wild and cul-tured populations tested. The condition factor values were significantly different from each other and showed that feed-ing could be improved in the farms. Both groups were ac-curately separated by linear discriminant functions that in-cluded only four morphometric measures. These results are of vital importance for the Ecuadorian population because they will allow for planning of further breeding and conser-vation strategies for this native fish and improving productiv-ity.
6 Data availability
The original data are available upon request to the corre-sponding author.
Edited by: M. Mielenz
References
Abdallah, M.: Length-weight relationship of fishes caught by trawl off Alexandria, Egypt, Naga-The ICLARM Quarterly, 25, 19–20, 2012.
Ajah, P. O., Georgewill, M. N., and Ajay, M. O.: The food and feed-ing habits of five fresh water and brackish water fish species in Nigeria, Afr. J. Aquat. Sci., 31, 313–318, 2006.
Al-Hassan, L. A. J.: Variations in meristic characters ofNematalosa
nasusfrom Iraqi and Kuwaiti waters, Jpn. J. Ichthyol., 33, 422–
425, 1987.
Anene, A.: Condition Factor of Four Cichlid Species of a Man-made Lake in Imo State, Southeastern Nigeria, Turk. J. Fish. Aquat. Sc., 5, 43–47, 2005.
Barnhill, B., Lopez, E., and Les, A.: Estudio sobre biología de los peces del río Vinces, Instituto Nacional de Pesca, Boletín Cientí-fico Técnico, Vol. III, 1974.
Barriga-Sosa, I. D., Jiménez-Badillo, M. D. Ibáñez, A. L., and Arredondo-Figueroa, J. L.: Variability of tilapias (Oreochromis spp.) introduced in Mexico: morphometric, meristic and genetic characters, J. Appl. Ichthyol., 20, 7–14, 2004.
Bayhan, B., Sever, T., and Taskavak, E.: Age, length-weight and diet composition of Scaldfish Arnoglossus laterna (Walbaum, 1792) (Pisces: Bothidae) in Izmit Bay (Aegean Sea), J. Anim. Vet. Adv., 7, 924–929, 2008.
Bibi-Koshy, E., Oyyan, S., and Sekaran, M.: Variation in meris-tic characters of four strains of Malaysian freshwater angelfish, Pterophyllum scalare (L.), Malaysian J. Sci., 27, 69–73, 2008. Bok, T. D., Gokturk, D., Kahraman, A. E., Alicli, T. Z., Acun, T.,
and Ates, C.: Length-Weight relationship of 34 fish species from the Sea of Marmara, J. Anim. Vet. Adv., 10, 3037–3042, 2011. Boulenger, G. A.: Poissons de l’Équateur. Deuxième Partie,
Bol-lettino dei Musei di Zoologia ed Anatomia Comparata della R. Università di Torino, 14, 1–8, 1899.
Brraich, O. S. and Akhter, S.: Morphometric Characters and Meris-tic Counts of a Fish, Garra gotyla gotyla (Gray) from Ranjit Sagar Wetland, situated in the Himalayan foothills, India, Int. J. Biol. Sci, 4, 66–72, 2015.
Cabral, H. N., Marques, J. F., Rego, A. L., Catarino, A. I., Figueiredo, J., and Garcia, J.: Genetic and morphological varia-tion of Synaptura lusitanica Capello, 1868, along the Portuguese coast, J. Sea Res., 50, 167–175, 2003.
Chávez-Lomelí, M. O., Mattheeuws, A. E., and Pérez-Vega, M. H.: Biología de los peces del río San Pedro en vista de determinar su potencial para la piscicultura, Instituto Nacional de Investiga-ciones sobre Recursos Bióticos, Villahermosa, Tabasco, 222 pp., 1988.
Chukwuemeka, V. I., Tsadu, S. M., Ayanwale, V. A., Erhabor, O. F., and Falusi, F. M.: Morphometric of Selected Fish Species from Tagwai Lake, Minna, Niger State, Nigeria, Adv. Agric. Biol., 2, 140–143, 2014.
Diodatti, F. C., Fonseca de Freitas, R. T., Freato, T. A., Pérez Ribeiro, P. A., and Solis Murgas, L. D.: Parámetros morfométri-cos en el rendimiento de los componentes corporales de tilapia del Nilo (Oreochromis Niloticus), Anales de Veterinaria de Mur-cia, 24, 45–55, 2008.
Elliott, N. G., Haskard, K., and Koslow, J. A.: Morphometric analy-sis of orange roughy (Hoplostethus atlanticus) off the continental slope of southern Australia, J. Fish Biol., 46, 202–220, 1995.
Zaeem, S. Y., Ahmed, M., Sayed-Salama, M. M., and Abd El-Kader, W. N.: Hhylogenetic differentiation of wild and cultured Nile tilapia (Oreochromis niloticus) populations based on phe-notype and gephe-notype analysis, Afr. J. Agric. Res., 7, 2946–2954, 2012.
Espinosa-Lemus, V., Arredondo-Figueroa, J. L., and Barriga-Sosa, L. A.: Morphometric and generic characterization of Tilapia (Ci-chlidae) stock for effective fisheries management in two Mexican reservoirs, Hidrobiológica, 19, 95–107, 2009.
Fagbuaro, O., Oso, J. A., Olurotimi, M. B., and Akinyemi, O.: Morphometric and Meristic Characteristics of Clarias gariepinus from Controlled and Uncontrolled Population from Southwest-ern Nigeria, J. Agric. Ecol. Res. Int., 2, 39–45, 2015.
FAO: El consumo de pescado y fauna acuática silvestre en la amazonía ecuatoriana, Roma, available at: http://www.fao.org/ docrep/014/ba0024s/ba0024s.pdf (last access: 15 April 2016), 2011.
Froese, R. and Pauly, D.: Fish base 2007, World Wide Web elec-tronic publication, available at: http://www.fishbase.org (last ac-cess 17 March 2016), 2007.
Frost, W. E. and Kipling, C.: The growth of char, Salvelinus willughbii Gunther in Windermere, J. Fish Biol., 16, 279–90, 1980.
Gacitúa, S., Oyarzún, C., and Veas, R.: Análisis multivariado de la morfometría y merística del robalo Eleginops maclovinus (Cu-vier, 1830), Rev. Biol. Mar. Oceanog., 43, 491–500, 2008. Hossain, M. A. R., Nahiduzzaman, M., Saha, D., Khanam, M. U.
H., and Alam, M. S.: Landmark-Based morphometric and meris-tic variations of the endangered carp, Kalibaus Labeo calbasu, from stocks of two isolated Rivers, the Jamuna and Halda and a Hatchery, Zool. Stud., 49, 556–563, 2010.
Ibañez-Aguirre, A. L. and Lleonart, J.: Relative growth and com-parative morphometrics of Mugil cephalus L. and M. curema V. in the Gulf of Mexico, Sci. Mar., 60, 361–368, 1996.
Johal, M. S., Tandon, K. K., and Sandhu, G. S.: Mahseer in La-custrine Waters, Gobindsagar Reservoir, in: Morphometry of Tor putitora, Mahseer the Game Fish, Jagdamba, edited by: Nautiyal, P., Prakashan Publisher, Srinagar, Garhwal, 67–85, 1994. King, M.: Fisheries biology, assessment and management, 2nd
Edn., Blackwell Scientific Publications, Oxford, 1–381, 2007. Konings, A.: Cichlids from Central America, Tfh Pubns Inc.,
Nep-tune City, New Jersey, 222 pp., 1989.
Luna-Figueroa, J. and Figueroa, T. J.: Reproducción y crec-imiento en cautiverio de la mojarra criolla Cichlasoma istlanum (Pisces : Cichlidae), AquaTIC, 10, 1–13,
2000-Muñoz, P. O., Alvarez, F., and Capa, C. P.: El conocimiento an-cestral sobre la pesca, en las comunidades shuar asentadas en el corredor fluvial Zamora – Nangaritza, CEDAMAZ, 112–127, 2014.
Morales, R., Arenal, A. Q., Pimentel, R., Mendoza, I., Cruz, A., Martínez, R., Herrera, F., Tápanes, L., Estrada, M. P., and de la Fuente, J.: Caracterización del fondo genético de la línea de su-pertilapias IG/03-F70, I. Caracteres morfométricos, merísticos y análisis de ADN, Biotecnol. Appl., 15, 15–21, 1998.
Oni, S. K., Olayemi, J. Y., and Adegboye, J. D.: Comparative phys-iology of three ecologically distinct fresh water fishes, Alestes nurse Ruppell, Synodontis schall Bloch and S. Schneider and Tilapia zilli Gervais, J. Fish Biol., 22, 105–109, 1983.
Orban, E., Nevigato, T., Di Lena, G., Casini, I., and Marzetti, A.: Differentiation in the lipid quality of wild and farmed seabass (Dicentrarchus labrax) and Gilthead Sea bream (Sparus aurata), J. Food Sci., 68, 128–132, 2003.
Pacheco, L. and Chicaiza, D.: Estudio en el Embalse Chongon, In-stituto Nacional de Pesca, available at: http://www.inp.gov.ec, 2008.
Pinheiro A, Teixeira, C. M., Rego, A. L., Marques, J., and Cabral, H.: Genetic and Morphological variation of solealascarIs (Risso, 1810) along the Portuguese coast, Fish. Res., 73, 67–78, 2005. Ponton D. and Mérigoux, S.: Comparative morphology and diet of
young cichlids in the dammed Sinnamary river, French Guiana, South America, J. Fish Biol., 56, 87–102, 2000.
Revelo, W. and Elias, E.: Aspectos biológicos de los principales re-cursos de aguas continentales, durante Febrero y Marzo del 2004 en la provincia de los Ríos, Instituto Nacional de Pesca, 21 pp., 2004.
Salini, J., Milton, D., Rahman, M., and Hussain, M.: Allozyme and morphological variation throughout the geographic range of the tropical shad, hilsa Tenualosa ilisha, Fish. Res., 66, 53–69, 2004. Sasi, H. and Berber, S.: Age, growth and some biological charac-teristics of white bream (Blicca bjoerk na L., 1758) in Uluabat lake, in Northwestern of Anatolia, Asian J. Anim. Vet. Adv., 7, 262–267, 2012.
Solem, O., Berg, O. K., and Kjosnes, A. J.: Inter and intra-population morphological differences between wild and farmed Atlantic salmon juveniles, J. Fish Biol., 69, 1466–1481, 2006.
Swain, D. P. and Foote, C. J.: Stocks and chameleons the use of phenotypic variation in stock identification, Fish. Res., 43, 113– 128, 1999.
Swain, D. P., Ridell, B. E., and Murray, C. B.: Morphological dif-ferences between hatchery and wild populations of coho salmon (Oncorhynchus kisutch): environmental versus genetic origin, Can. J. Fish Aquat. Sci., 48, 1783–1791, 1991.
Tudela, S.: Morphological variability in a Mediterranean, genet-ically homogeneous population of the European anchovy, En-graulis encrasicolus, Fish. Res., 42, 229–243, 1999.
Turan, C., Oral, M., Öztürk, B., and Düzgüne¸s, E.: Morphomet-ric and meristic variation between stocks of Bluefish (Pomato-mus saltatrix) in the Black, Marmara, Aegean and northeastern Mediterranean Seas, Fish. Res., 79, 139–147, 2006.
Van der Bank, F. H., Ferreira, J. T., and Grant, W. S.: An evaluation of morphometric and meristic characters frequently used in iden-tification keys for fifteen cichlid fish species endemic to southern Africa, Madoqua, 16, 77–85, 1989.
Vreven, E. J., Adèpo-Gourène, B., Agnèse, J. F., and Teugels, G. G.: Morphometric and allozyme in populations and cultured strains of the Nile tilapia Oreochromis niloticus (Teleostei, Cichlidae), Belg. J. Zool., 128, 23–34, 1998.
Watanabe, K.: Meristic variation in the endangered bagrid catfish, Pseudobagrus ichikawai, Ichthyol. Res., 45, 99–104, 1998. Wimberger, P. H.: Plasticity of fish body shape the effects of