Molecular and Cytogenetic Characterization
of Wild
Musa
Species
JanaČížková1, Eva Hřibová1, Pavla Christelová1, Ines Van den Houwe2,
Markku Häkkinen3, Nicolas Roux4, Rony Swennen2,5,6, Jaroslav Doležel1*
1Institute of Experimental Botany, Centre of the Region Haná for Biotechnological and Agricultural Research, CZ-78371, Olomouc, Czech Republic,2Bioversity International, B-3001, Leuven, Belgium,
3Finnish Museum of Natural History, University of Helsinki, FI-00014, Helsinki, Finland,4Bioversity International, 34397 Montpellier Cedex 5, France,5Division of Crop Biotechnics, KU Leuven, B-3001, Leuven, Belgium,6International Institute of Tropical Agriculture, Duluti, Arusha, Tanzania
Abstract
The production of bananas is threatened by rapid spreading of various diseases and adverse environmental conditions. The preservation and characterization of banana diver-sity is essential for the purposes of crop improvement. The world's largest banana germ-plasm collection maintained at the Bioversity International Transit Centre (ITC) in Belgium is continuously expanded by new accessions of edible cultivars and wild species. Detailed morphological and molecular characterization of the accessions is necessary for efficient management of the collection and utilization of banana diversity. In this work, nuclear DNA content and genomic distribution of 45S and 5S rDNA were examined in 21 diploid acces-sions recently added to ITC collection, representing both sections of the genusMusa. 2C DNA content in the section Musa ranged from 1.217 to 1.315 pg. Species belonging to sec-tion Callimusa had 2C DNA contents ranging from 1.390 to 1.772 pg. While the number of 45S rDNA loci was conserved in the section Musa, it was highly variable in Callimusa spe-cies. 5S rRNA gene clusters were found on two to eight chromosomes per diploid cell. The accessions were genotyped using a set of 19 microsatellite markers to establish their rela-tionships with the remaining accessions held at ITC. Genetic diversity done by SSR geno-typing platform was extended by phylogenetic analysis of ITS region. ITS sequence data supported the clustering obtained by SSR analysis for most of the accessions. High level of nucleotide diversity and presence of more than two types of ITS sequences in eight wild dip-loids pointed to their origin by hybridization of different genotypes. This study significantly expands the number of wildMusaspecies where nuclear genome size and genomic distri-bution of rDNA loci is known. SSR genotyping identifiedMusaspecies that are closely related to the previously characterized accessions and provided data to aid in their classifi-cation. Sequence analysis of ITS region provided further information about evolutionary relationships between individual accessions and suggested that some of analyzed acces-sions were interspecific hybrids and/or backcross progeny.
OPEN ACCESS
Citation:Čížková J, Hřibová E, Christelová P, Van den Houwe I, Häkkinen M, Roux N, et al. (2015) Molecular and Cytogenetic Characterization of Wild
MusaSpecies. PLoS ONE 10(8): e0134096. doi:10.1371/journal.pone.0134096
Editor:Khalil Kashkush, Ben-Gurion University, ISRAEL
Received:June 13, 2015
Accepted:July 7, 2015
Published:August 7, 2015
Copyright:© 2015Čížková et al. This is an open access article distributed under the terms of the Creative Commons Attribution License, which permits unrestricted use, distribution, and reproduction in any medium, provided the original author and source are credited.
Data Availability Statement:All relevant data are within the paper and its Supporting Information files.
Funding:Funded by the Ministry of Education, Youth and Sports of the Czech Republic (award INGO II No. LG12021), Bioversity International (LoA CfL 2010/58, LoA CfL 2011/51, LoA CfL 2012/43), and the grant LO1204 from the National Program of Sustainability I (JD).
Introduction
Bananas and plantains (Musaspp.) are one of the most important food crops with the global annual production exceeding 130 Mt (faostat.fao.org). They are grown mainly by smallholder farmers for local consumption and only about 10% of the world's production is exported. Most of the cultivated bananas are parthenocarpic triploid clones (although diploids and tetraploids also occur), which originated from natural intra- and interspecific hybridizations between vari-ous subspecies ofM.acuminata(A genome) andM.balbisiana(B genome) [1] within the genusMusa. The triploids are then classified as AAA, AAB and ABB and include a range of varieties of dessert bananas, cooking bananas and plantains, which provide essential nutrition for millions of people in the humid tropics. Minor group of cultivated bananas derived from the hybridization between the A, B and one of the other recognizedMusagenomes, the S genome and T genome (M.schizocarpaandM.textilis, respectively) [2,3].
The production of bananas is threatened by various diseases, pests and adverse environmen-tal conditions. This imposes the need for varieenvironmen-tal testing and crop improvement supported by preservation of characterized banana diversity. The globalMusacollection is maintained at the Bioversity International Transit Centre (ITC) hosted by the Katholieke Universiteit Leuven in Belgium [4]. The ITC collection was originally established for long term conservation of dip-loid, triploid and tetraploid edible cultivars, but eventually it started to be expanded by differ-ent wild species and subspecies. Currdiffer-ently, the collection contains more than 1,500 accessions in tissue culture. Newly introduced accessions of wildMusaspecies are a significant source of material to study diversity inMusaon a broader scale.
In addition toM.acuminataandM.balbisiana, the genusMusacontains about 70 species. Based on morphology [5] and chromosome number, the genus was divided into sections Eumusa (x = 11), Rhodochlamys (x = 11), Australimusa (x = 10) and Callimusa (x = 9, 10) [6]. More recently, Argent [7] created a separate section Ingentimusa, which contains only a single speciesM.ingens(x = 7). This classification has been questioned recently, and various regroup-ings were suggested [8]. Genotyping with several types of DNA markers confirmed the need for revision of theMusasections [9–12]. Based on these results, Häkkinen [13] combined the
Australimusa, Ingentimusa and Callimusa sections into section Callimusa, and sections Eumusa and Rhodochlamys into a newly created section Musa.
The difficulties with the classification of new cultivars and newly discovered wildMusa spe-cies using morphological descriptors call for characterization ofMusaaccessions using stable and reproducible characters. One of the basic characteristics of a species is its nuclear genome size. In earlier studies, the nuclear genome size was estimated mainly on edible bananas and their wild ancestors. A genome size of 600–650 Mbp was determined inM.acuminataand
550 Mbp inM.balbisiana, clearly discriminating both species [14–16]. Bartošet al. [9]
extended the knowledge of nuclear DNA content by representatives of former sections Rhodo-chlamys, Australimusa and Callimusa. Flow cytometric analysis showed that 2C nuclear DNA contents of Eumusa and Rhodochlamys accessions were overlapping, ranging from 1.130 to 1.377 pg in Eumusa and from 1.191 to 1.299 pg in Rhodochlamys. Species belonging to section Australimusa had 2C nuclear DNA content between 1.435 and 1.547 pg.M.beccarii, the only studied representative of Callimusa section, had the highest 2C nuclear DNA content (1.561 pg). However, only nineteen accessions were included in that study and the knowledge about genome size remained limited, especially in the section Callimusa.
chromosome-specific landmarks. To date, identification of all chromosomes within the karyo-type is not possible. The only sequences cytogenetically mapped to chromosomes of a wider range ofMusaaccessions are ribosomal RNA (rRNA) genes. While the number of 45S rDNA loci was found conserved within individual sections, the number of 5S rDNA loci ranged from 4 to 8 per mitotic metaphase plate and varied within sections and even within different acces-sions of a single species [9,16–18]. Similarly to genome size, genomic distribution of rRNA
genes was studied mainly inM.acuminata,M.balbisianaand some cultivated varieties. Unlike the methods mentioned above, genotyping using DNA markers provides higher resolution and is suitable for analysis of genetic diversity and establishment of phylogenetic relationships. Different types of molecular markers, such as RAPDs [19], RFLPs [20,21], AFLPs [22,23] or DArT markers [24], were used in diversity studies and molecular characteri-zation ofMusa. In 2011, a standardized microsatellite-based genotyping platform for molecu-lar characterization ofMusagermplasm was established [13]. Microsatellites (SSRs) are popular molecular markers because of their high abundance in the genome, co-dominant inheritance, extent of allelic diversity, good reproducibility and the potential for high-through-put analysis and automatisation. They proved to be useful in molecular genotyping of many economically important crops [25–27]. The microsatellite genotyping platform of Christelová
et al. [13] is based on 19 microsatellite loci [28–30], which are scored using fluorescently
labelled primers and high-throughput, high-resolution capillary electrophoresis. The platform enables discrimination between individual species, subspecies and subgroups ofMusa acces-sions and is suitable for characterization of unknown accesacces-sions. Based on the results of Chris-telováet al. [13], the Musa Genotyping Centre was established at the Institute of Experimental Botany in Olomouc (Czech Republic) [31] under the auspices of Bioversity International. The database of reference SSR profiles they generate is enlarged with every new accession passing through the pipeline and consequently improves the grouping and enhances the probability of identifying the closest relative or an exact match for unknown accessions. Increasing the num-ber of analysed wild species would give more accuracy to the grouping of the genusMusa.
When SSR genotyping provides incongruent results, or in case there is a need to support putative hybrid character of particularMusaaccessions, the ITS sequence analysis can be used. The analysis of internal transcribed spacer region (ITS1-5.8S-ITS2) of nuclear ribosomal DNA provides additional information on genetic diversity and evolutionary relationships among individual accessions. The ITS region has been one of the most widely used markers in genetic studies of flowering plants [32] and has recently been successfully employed in phylo-genetic reconstruction in the family Musaceae [10,11,33]. It has been shown that ITS locus can be used for verification of genome constitution of inter- and intraspecific banana hybrids [33].
Materials and Methods
Plant Material and Genomic DNA Extraction
In vitrorooted plants of 21Musaaccessions (S1 Table; basic description of accessions available at [5] were obtained from the International Transit Centre (ITC, Katholieke Universiteit, Leu-ven, Belgium). The plants were transferred to soil and maintained in a greenhouse. Fresh unopened (cigar) leaves were harvested, their segments lyophilized and maintained at room temperature until use. Genomic DNA of allMusaspecies used for the SSR genotyping and ITS analysis was isolated from lyophilized leaves using the NucleoSpin PlantII kit (Macherey-Nagel GmbH & Co. KG, Düren, Germany) following the manufacturer's recommendations.
Estimation of Genome Size
Nuclear genome size was estimated according to Bartošet al. [9]. Approximately 50 mg of a
youngMusaleaf and 10 mg of a soybean leaf (Glycine maxL. cv. Polanka, 2C = 2.5 pg DNA) which served as internal standard [14] were used for sample preparation. Suspensions of cell nuclei were prepared by simultaneous chopping of leaf tissues ofMusaandGlycinein a glass Petri dish containing 500μl Otto I solution (0.1 M citric acid, 0.5% v/v Tween 20). Crude homogenate was filtered through a 50μm nylon mesh. Nuclei were then pelleted (300g, 5 min) and resuspended in 300μl Otto I solution. After 1 hour incubation at room temperature, 900μl Otto II solution (0.4 M Na2HPO4) [34] supplemented with 50μg/ml RNase, 50μg/ml
propidium iodide and 3μl/ml 2-mercaptoethanol, were added. Samples were analyzed using Partec PAS flow cytometer (Partec GmbH, Münster, Germany) equipped with 488-nm argon laser. At least 5,000 nuclei were analyzed per sample. Three individuals were analyzed in each accession, and each individual was measured three times on three different days. Nuclear DNA content was then calculated from individual measurements following the formula:
2C nuclear DNA content½pg ¼ 2:5xG
1peak mean ofMusa=G1peak mean ofGlycine
Mean nuclear DNA content (2C) was then calculated for each plant. Genome size (1C value) was then determined considering 1 pg DNA equal to 0.978×10⁹bp [35].
Statistical analysis was performed using NCSS 97 statistical software (Statistical Solutions Ltd., Cork, Ireland). One-way ANOVA and a Bonferoni's (All-Pairwise) multiple comparison test were used for analysis of variation in nuclear DNA content. The significance levelα= 0.01 was used. Spearman's correlation analysis was used to test the relationship between chromo-some number and nuclear DNA content of studied accessions.
SSR Genotyping
used to assess the relationship between individual genotypes. The results of UPGMA cluster analysis were visualized in a form of a tree using FigTree v1.4.0 [39].
Analysis of ITS1-5.8S-ITS2 Region
The ITS region was amplified from genomic DNA using PCR with specific primers ITS-L and ITS-4 [40]. PCR reaction mix consisted of 10 ng genomic DNA, 1.5 mM MgCl2, 0.2 mM
dNTPs, 1 mM primers ITS-L and ITS-4, 1x PCR buffer and 2U/100 of Dynazyme II DNA poly-merase (Finnzymes, Espoo, Finland). Amplification was performed using PTC-200 thermal cycler (BIO-RAD, Hercules, CA, USA), with the following conditions: 94°C for 5 min (1 cycle), 94°C for 50 s, 52°C for 50 s, 72°C for 50 s (35 cycles) and 72°C for 10 min (1 cycle), and PCR products were resolved in 1.5% agarose gels.
PCR products were purified using ExoSAP-IT (USB, Cleveland, OH, USA) according to the manufacturer's instructions, cloned into TOPO vector, and transformed intoE.coli electro-competent cells (Invitrogen Life Technologies, Carlsbad, USA). For each accession, at least 28 cloned PCR products were sequenced. Sequencing was carried out using the BigDye Termina-tor v3.1 Cycle Sequencing kit (Applied Biosystems, Foster City, USA) according to the manu-facturer's instructions and run on ABI 3730xl DNA analyzer (Applied Biosystems, Foster City, USA). Nucleotide sequences were edited using Staden Package [41]. Sequence boundaries of the spacers were assessed and phylogenetic relationships analysis was performed according to Hřibováet al. [33]. Sequence diversity was identified using DnaSAM program [42] with 1000
simulations. SplitsTree4 v4.1.11 [43] was used to construct phylograms based on the Jukes-Cantor model. Non-parametric bootstrapping with 1000 pseudoreplicates was performed to assess the nodal support. Phylogenetic trees were drawn and edited using FigTree program [39].
Chromosome Preparations and Chromosome Counting
Mitotic metaphase spreads were prepared according to Doleželováet al. [17]. Actively growing
root tips were pre-treated in 0.05% (w/v) 8-hydroxyquinoline for 3 hrs at room temperature and then fixed in 3:1 ethanol: acetic acid overnight. Fixed roots were washed in a solution of 75 mM KCl and 7.5 mM EDTA (pH 4) and meristem tips were digested in a mixture of 2% (w/v) pectinase and 2% (w/v) cellulase in 75 mM KCl and 7.5 mM EDTA (pH 4) for 90 min at 30°C. Protoplast suspension was then filtered through a 150μm nylon mesh and pelleted. The pellet was resuspended in 75 mM KCl and 7.5 mM EDTA (pH 4) and incubated for 5 min at room temperature. After pelleting, the protoplasts were washed three times with 70% ethanol. Fiveμl of the suspension were dropped onto a slide and shortly before drying out, 5μl of 3:1 fixative were added to the drop to induce protoplast bursting. Finally, the slide was rinsed in 100% ethanol and air-dried.
For chromosome counting, the preparations were stained with DAPI (Vectashield Mount-ing Medium with DAPI; Vector laboratories). Slides were examined with Olympus AX70 fluo-rescence microscope. Images were captured using a cooled high-resolution black and white camera and processed using MicroImage software (Olympus, Tokyo, Japan). In each plant, two slides were observed, each with at least five metaphase plates.
Fluorescence
In Situ
Hybridization (FISH)
in 1×SSC and 1μg/ml of each labeled probe was added onto slides and denatured at 80°C for 3 min. The hybridization was carried out at 37°C overnight. The sites of probe hybridization were detected using anti-digoxigenin-FITC (Roche Applied Science) and streptavidin-Cy3 (Vector Laboratories, Burlingame, USA), and the chromosomes were counterstained with DAPI. The slides were examined with Olympus AX70 fluorescence microscope and the images of DAPI, FITC and Cy-3 fluorescence were acquired separately with a cooled high-resolution black and white CCD camera. The camera was interfaced to a PC running the MicroImage software (Olympus, Tokyo, Japan). At least ten complete metaphases were examined for every accession.
Results
Estimation of Genome Size
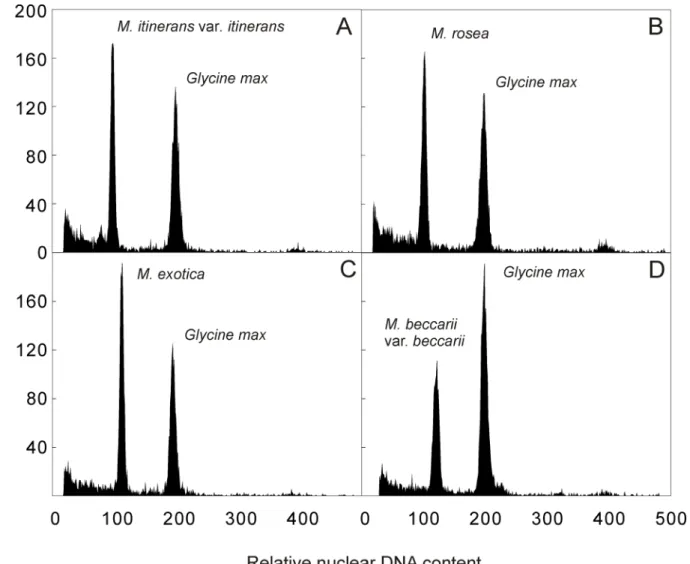
The amount of nuclear DNA was estimated after flow cytometric analysis of propidium iodide-stained nuclei. All analyses resulted in histograms of relative DNA content with two dominant peaks corresponding to G1nuclei ofMusaandGlycine, the latter serving as internal reference
standard (Fig 1). The 2C nuclear DNA content determined based on the ratio of G1peaks
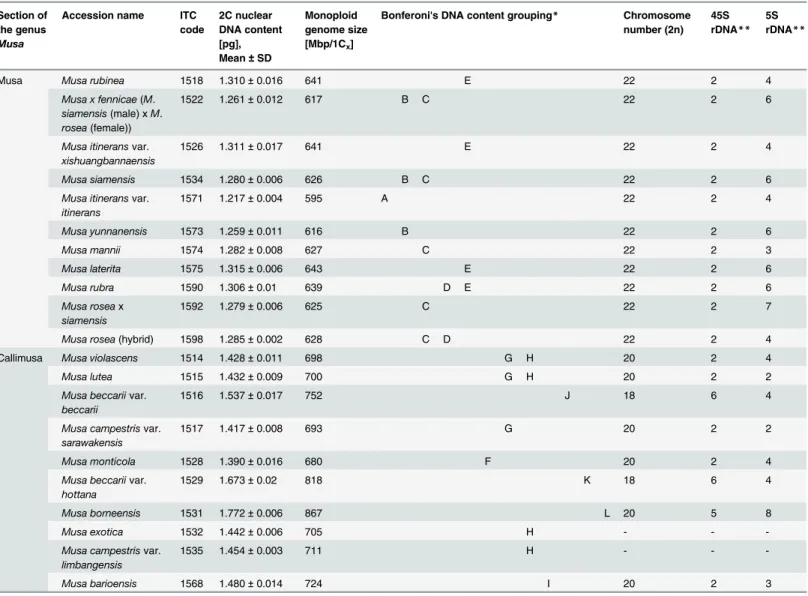
posi-tions ranged from 1.217 to 1.772 pg (Table 1). The differences between the accessions from sec-tion Musa were statistically significant with 2C DNA content ranging between 1.217 and 1.315 pg. Much higher interspecific variation (27.5%) of 2C DNA content was observed within the section Callimusa (2C = 1.390–1.772 pg).
Bonferoni's (All-Pairwise) multiple comparison test revealed twelve groups based on the dif-ferences in the nuclear DNA content (Table 1). Six of these groups were represented by only one accession (M.itineransvar.itinerans(ITC.1571),M.monticola(ITC.1528),M.barioensis (ITC 1568),M.beccariivar.beccarii(ITC.1516),M.beccariivar.hottana(ITC.1529) andM. borneensis(ITC.1531)). Four groups comprised different representatives of the section Musa (former sections Eumusa and Rhodochlamys) and two groups included different species belonging to section Callimusa.
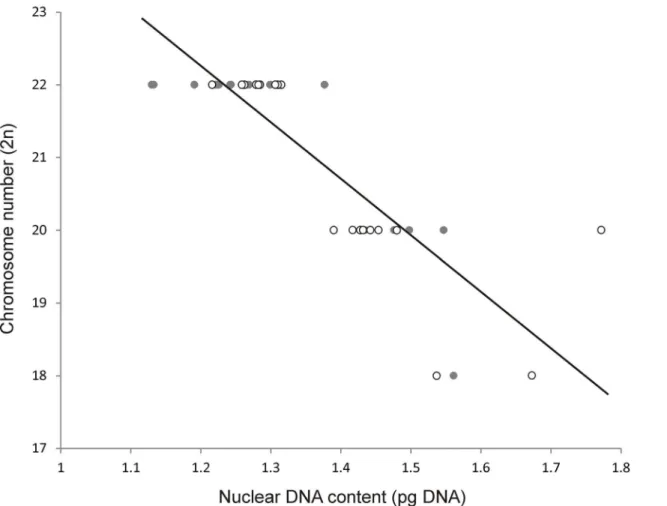
Spearman's correlation coefficient showed a strong negative correlation (r = -0.88) between 2n chromosome number and 2C nuclear DNA content among theMusaaccessions. The same trend (r = -0.85) was observed when the results of Bartošet al. [9] were included in the
analysis (Fig 2). On the other hand, after including representatives of two other genera of the family Musaceae,Ensete gilletii[9] andMusella lasiocarpa(not published) the strong negative correlation between nuclear DNA content and chromosome number was no longer observed (r = -0.63).
Chromosome Counting and Cytogenetic Mapping of rRNA Genes
Protoplast dropping technique was used to prepare metaphase spreads for chromosome count-ing and localization of rRNA genes. All accessions were confirmed to be diploid and their chro-mosome numbers corresponded to section-specific classification (Table 1). Representatives of the section Musa had 2n = 22 chromosomes, while Callimusa accessions had 2n = 18 (M. bec-carii) or 2n = 20 chromosomes. Unfortunately, plants ofMusa exotica(ITC.1532) andM. cam-pestrisvar.limbangensis(ITC.1535) did not have actively growing roots needed for preparation of protoplast suspensions and their chromosomes could not be determined during this study.
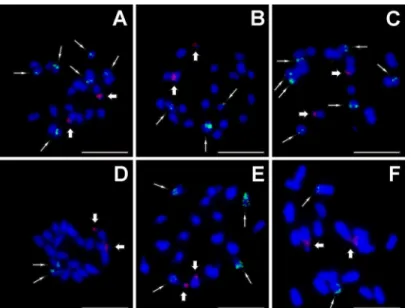
ITC.1529) possessed six 45S rDNA loci on three chromosome pairs (Table 1). Two of these sig-nals were observed in the secondary constriction of one chromosome pair, while the other sites of probe hybridization were localized in interstitial chromosome regions.
A significantly higher variation was detected in the number of 5S rDNA loci (Table 1). In a majority of accessions from the Musa section, 5S rDNA sites were localized on two or three chromosome pairs. Three signals were observed on chromosomes ofM.mannii(ITC.1574, Fig 3B) and seven signals per metaphase plate were detected inM.roseaxsiamensis(ITC.1592, Fig 3C). Callimusa species contained 5S rDNA gene clusters on two to eight chromosomes per metaphase plate. InM.beccariivar.beccarii(ITC.1516),M.beccariivar.hottana(ITC.1529) andM.borneensis(ITC.1531), two of the 5S rDNA sites co-localized with interstitially localized 45S rDNA genes.
Fig 1. Histograms of relative nuclear DNA content obtained after flow cytometric analysis of propidium iodide-stained nuclei isolated from (A)M. itineransvar.itinerans(ITC.1571) (2C = 1.217 pg); (B)M.rosea(ITC.1598) (2C = 1.285 pg); (C)M.exotica(ITC.1532) (2C = 1.442 pg); (D)M.beccarii var.beccarii(ITC.1516) (2C = 1.537 pg).Nuclei isolated from soybean (Glycine max, 2C = 2.5 pg) were included as internal reference standard.
SSR Genotyping
Molecular characterization of the newly introduced ITC accessions based on SSR markers included inspection of their clustering pattern within the reference set of diploid entries used in the study of Christelováet al. [13]. The UPGMA cluster analysis based on the Nei [37] genetic distance resulted in relatively clear grouping of genotype groups and subgroups (Fig 4). Inclusion of the new accessions did not change the overall grouping of the species as compared to the results of Christelováet al. [13]. Most of the entries under this study clustered with the reference accessions as shown in our previous study [12] in accordance to their expected classi-fication based on plant morphology. Newly introduced accessions belonging to the Musa sec-tion were grouped within the cluster A comprising other species from secsec-tion Musa. The two Table 1. Nuclear DNA content, chromosome number and the number of 45S and 5S rDNA loci.
Section of the genus
Musa
Accession name ITC code
2C nuclear DNA content [pg], Mean±SD
Monoploid genome size [Mbp/1Cx]
Bonferoni's DNA content grouping* Chromosome number (2n)
45S rDNA**
5S rDNA**
Musa Musa rubinea 1518 1.310±0.016 641 E 22 2 4
Musa x fennicae(M.
siamensis(male) xM.
rosea(female))
1522 1.261±0.012 617 B C 22 2 6
Musa itineransvar.
xishuangbannaensis
1526 1.311±0.017 641 E 22 2 4
Musa siamensis 1534 1.280±0.006 626 B C 22 2 6
Musa itineransvar.
itinerans
1571 1.217±0.004 595 A 22 2 4
Musa yunnanensis 1573 1.259±0.011 616 B 22 2 6
Musa mannii 1574 1.282±0.008 627 C 22 2 3
Musa laterita 1575 1.315±0.006 643 E 22 2 6
Musa rubra 1590 1.306±0.01 639 D E 22 2 6
Musa roseax
siamensis
1592 1.279±0.006 625 C 22 2 7
Musa rosea(hybrid) 1598 1.285±0.002 628 C D 22 2 4
Callimusa Musa violascens 1514 1.428±0.011 698 G H 20 2 4
Musa lutea 1515 1.432±0.009 700 G H 20 2 2
Musa beccariivar.
beccarii
1516 1.537±0.017 752 J 18 6 4
Musa campestrisvar.
sarawakensis
1517 1.417±0.008 693 G 20 2 2
Musa monticola 1528 1.390±0.016 680 F 20 2 4
Musa beccariivar.
hottana
1529 1.673±0.02 818 K 18 6 4
Musa borneensis 1531 1.772±0.006 867 L 20 5 8
Musa exotica 1532 1.442±0.006 705 H - -
-Musa campestrisvar.
limbangensis
1535 1.454±0.003 711 H - -
-Musa barioensis 1568 1.480±0.014 724 I 20 2 3
*) Statistical analysis was performed using mean values of 2C nuclear DNA content of individual plants (α= 0.01). DNA content within each Bonferoni's group described by the same letter was not significantly different.
**) Number of FISH signals in a mitotic metaphase plate (2n)
accessions described asM.itinerans(ITC.1526 and ITC.1571) andM.rubinea(ITC.1518) formed a separate clade within the cluster A. Accessions described as Callimusa species were grouped within the cluster B together with reference accessions from this section. The allele sizes of analyzed accessions which were converted into binary code and added to the previous set of analyzed diploidMusaaccessions [12] are available on the web pages of theMusa Geno-typing Centre [31].
Analysis of ITS1-5.8S-ITS2 Region
In general, the length of ITS1 and ITS2 spacer varied from 215 to 223 bp and from 205 to 218 bp, respectively. A total length of ITS1-5.8S-ITS2 sequence region ranged from 579 bp (M.mannii, ITC.1574) to 591 bp (M.lutea, ITC.1515) in all accessions, except for four repre-sentatives:M.rubra(ITC.1590),M.rosea x siamensis(ITC.1592),M.yunnanensis(ITC.1573) andM.campestrisvar.sarawakensis(ITC.1517) where the ITS region was shorter due to a dele-tion. The lowest nucleotide diversity of ITS1-5.8S-ITS2 sequence region was observed inM. lutea(ITC.1515) andM.monticola(ITC.1528). One of the highest sequence diversities were observed in accessions, which were described as wild diploid species:M.mannii,M. yunnanen-sis,M.rubinea,M.siamensis,M.rubra,M.beccarii,M.borneensis,M.campestrisandM. bario-nensis(Table 2,S2 Table). GC content of ITS1 varied from 57.41 to 65.02% and was slightly Fig 2. Relationship between nuclear 2C DNA content and 2n chromosome number in representatives of the genusMusastudied in the present work (empty circles) and by Bartošet al. [9] (full circles), r = -0.85.
lower than the GC content of ITS2 (59.51 to 69.74%). The 5.8S rDNA sequence region had a conserved length of 153 bp or 155 bp, except for two ITS types ofM.yunnanensis(ITC.1573) and one type ofM.rubra(ITC.1590) and M.roseaxsiamensis(ITC.1598) due to the deletion. GC content of 5.8S rDNA varied between 46.45% and 59.63%, and was significantly lower than the GC content in ITS1 and ITS2.
Identification of rDNA Pseudogenes and Phylogenetic Analysis
The secondary structure of ITS2 and 5.8S rDNA sequence regions was reconstructed for all accessions under study. ITS2 sequences formed specific four-helices structure with typical pyrimidine-pyrimidine bulge in helix II and the most conserved primary sequence included the TGGT in the helix III. Secondary structure of 5.8S rDNA sequence was reconstructed under specific settings for base pairing as described by Hřibováet al. [33]. Moreover, 5.8S
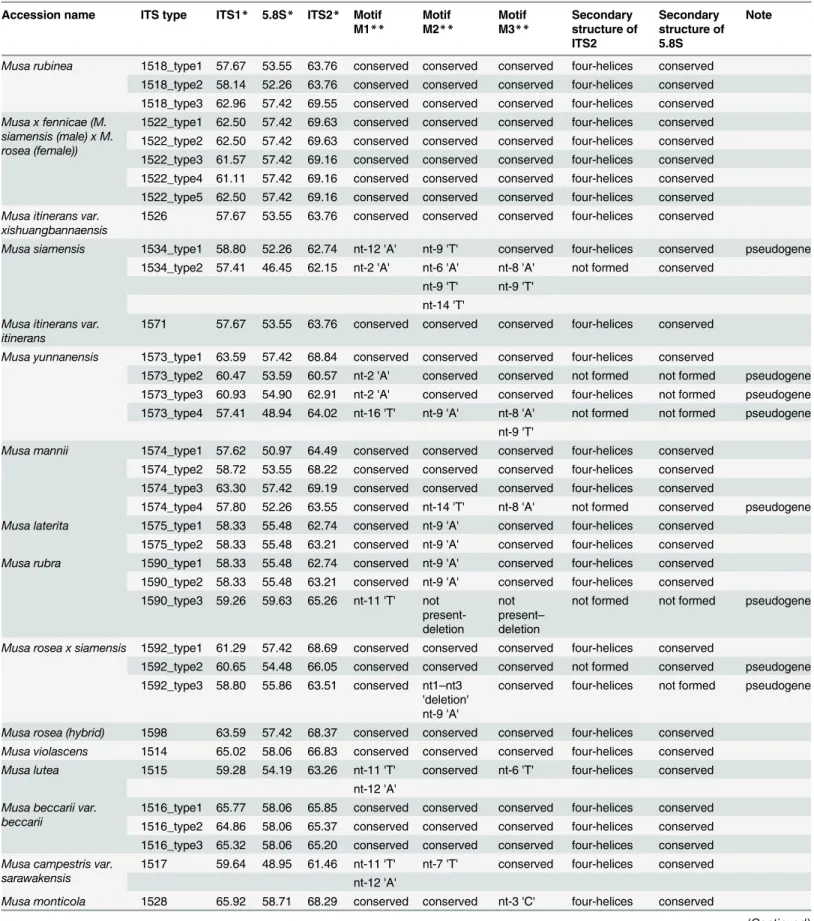
rDNA sequences were checked for the presence of three conserved motives [45]. The nucleo-tide changes in conserved motives of 5.8S rDNA of analyzed accessions, the information on GC content, presence of conserved motives in the 5.8S rDNA sequence and ability of ITS2 and 5.8S rDNA sequence to fold into a conserved secondary structure enabled identification of putative pseudogenes (Table 2). As shown inTable 2, more than half of the analyzed accessions contained at least two types of ITS sequences. On the contrary,M.roseaxsiamensisITC.1598 which has been described as hybrid clone had only one type of ITS sequence region.
With the aim to support clustering based on SSR markers, phylogenetic analysis of the ITS sequence region was done. Dataset for this analysis comprised ITS sequences of theMusaspp. previously described by Hřibováet al. [33] and ITS types of the 21 studied accessions,
exclud-ing the putative pseudogenic ITS types (S1 Fig). Inclusion of the new accessions did not change the overall grouping of the species as compared to the results of Hřibováet al. [33].
Phyloge-netic analysis of ITS region supported the clustering obtained by SSR analysis for majority of the studied accessions. Close relationships ofM.itineransandM.rubineaaccessions was Fig 3. Examples of genomic distribution of 45S (red, thick arrows) and 5S (green, thin arrows) rRNA genes as localized on mitotic metaphase plates using FISH.(A)Musa yunnanensis(ITC.1573); (B)Musa mannii(ITC.1574); (C)Musa roseaxsiamensis(ITC.1592); (D)Musa campestrisvar.sarawakensis
(ITC.1517); (E)Musa monticola(ITC.1528); (F)Musa lutea(ITC.1515). Chromosomes were counterstained with DAPI. Bar = 5μm.
supported by SSR as well as ITS analysis. On the other hand, ITS analysis indicated close rela-tionships of these accessions toM.balbisiana, but this observation was not supported by the SSR analysis. Similarly, close relationships ofM.yunnanensis(ITC.1573) andM.roseahybrid (ITC.1598) toM.ornataandM.velutinaobtained after SSR analysis was not supported by ITS analysis. Finally, different clustering was observed for accessionMusa x fennicae (Musa sia-mensis (male) x Musa rosea (female)(ITC.1522) which is found in the cluster containing orna-mental bananas (former Rhodochlamys section) in the SSR cladogram while using ITS analysis, all ITS sequence types including putative pseudogenes are clustered together with AA genotypes.
In our previous study [33], we have shown that, with certain caution, pseudogenic rDNA sequences can be used to identify parental genotypes of hybrid clones. Considering the fact that more than a half of the analyzed accessions contained at least two types of ITS sequences, phylogenetic reconstruction with ITS sequences including putative pseudogenes was done (S2 Fig). As it is visible from the ITS clustering, the genome ofMusa yunnanensis(ITC.1573) con-tains divergent ITS sequence types which clustered together with ornamental bananas as well as with AA genotypes. Similar observation was obtained also for genotype described as hybrid clones of ornamental banana genotypes—M.roseaxsiamensis(ITC.1592), while hybrid clone
Musa x fennicae (Musa siamensis (male) x Musa rosea (female)(ITC.1522) contained only ITS sequence types which clustered together with the AA genotypes (see above).
Discussion
Nuclear DNA Content and Distribution of rDNA
Most of the knowledge on nuclear genome size and genomic distribution of rDNA loci in banana comes from the analysis of triploid cultivars and their wild ancestors [14–16,17,18,
46]. Only the study of Bartošet al. [9] included a wider range ofMusaspecies and provided the
first complex picture of the whole genus. Our study significantly expands the number of wild Musaspecies where these key characteristics of nuclear genome are described.
The diversity in genome size observed in species belonging to the section Musa is in line with previous studies [9,14–16,46] which estimated 2C nuclear DNA content ranging from
1.108 pg inM.balbisianato 1.377 pg inM.schizocarpa. The genome size ofM.lateritaandM. manniiwere determined by Bartošet al. [9]. However, in both cases, different ITC accessions
(ITC.0627 and ITC.1411, respectively) were used. While the difference in 2C nuclear DNA content estimates between both accessions (ITC.1411 and ITC.1574) ofM.manniiis negligible (1.0%), there is much higher difference (7.7%) betweenM.lateritaaccessions (ITC.0627 and ITC.1575). This observation suggests that accessions ITC.0627 and ITC.1575 could represent different varieties ofM.laterita.
Genomic distribution of 45S and 5S rDNA clusters inMusaaccessions as observed in this study is similar to the results obtained by Bartošet al. [9] and together with overlapping
genome size values brings further evidence about the close relationships between representa-tives of former sections Eumusa and Rhodochlamys. The traditional division into sections Eumusa and Rhodochlamys was mainly based on morphological characters. The separation of these sections was however doubtful, because morphological differences were difficult to detect Fig 4. Dendrogram showing the results of the UPGMA analysis based on SSR markers.Accessions under study were analyzed together with the reference set of diploid entries as used by Christelováet al. [12]. The main clades and subclades are distinguished by colors. The Australimusa/Callimusa clade in green; Rhodochlamys in yellow; BB genotypes in blue; AA genotypes in red and SS genotypes in pink. Accessions analyzed in this study are shown in black.
Table 2. Sequence characteristics of ITS1-5.8S-ITS2 regions.
Accession name ITS type ITS1* 5.8S* ITS2* Motif M1** Motif M2** Motif M3** Secondary structure of ITS2 Secondary structure of 5.8S Note
Musa rubinea 1518_type1 57.67 53.55 63.76 conserved conserved conserved four-helices conserved
1518_type2 58.14 52.26 63.76 conserved conserved conserved four-helices conserved 1518_type3 62.96 57.42 69.55 conserved conserved conserved four-helices conserved
Musa x fennicae (M. siamensis (male) x M. rosea (female))
1522_type1 62.50 57.42 69.63 conserved conserved conserved four-helices conserved 1522_type2 62.50 57.42 69.63 conserved conserved conserved four-helices conserved 1522_type3 61.57 57.42 69.16 conserved conserved conserved four-helices conserved 1522_type4 61.11 57.42 69.16 conserved conserved conserved four-helices conserved 1522_type5 62.50 57.42 69.16 conserved conserved conserved four-helices conserved
Musa itinerans var. xishuangbannaensis
1526 57.67 53.55 63.76 conserved conserved conserved four-helices conserved
Musa siamensis 1534_type1 58.80 52.26 62.74 nt-12 'A' nt-9 'T' conserved four-helices conserved pseudogene
1534_type2 57.41 46.45 62.15 nt-2 'A' nt-6 'A' nt-8 'A' not formed conserved nt-9 'T' nt-9 'T'
nt-14 'T'
Musa itinerans var. itinerans
1571 57.67 53.55 63.76 conserved conserved conserved four-helices conserved
Musa yunnanensis 1573_type1 63.59 57.42 68.84 conserved conserved conserved four-helices conserved
1573_type2 60.47 53.59 60.57 nt-2 'A' conserved conserved not formed not formed pseudogene 1573_type3 60.93 54.90 62.91 nt-2 'A' conserved conserved four-helices not formed pseudogene 1573_type4 57.41 48.94 64.02 nt-16 'T' nt-9 'A' nt-8 'A' not formed not formed pseudogene
nt-9 'T'
Musa mannii 1574_type1 57.62 50.97 64.49 conserved conserved conserved four-helices conserved
1574_type2 58.72 53.55 68.22 conserved conserved conserved four-helices conserved 1574_type3 63.30 57.42 69.19 conserved conserved conserved four-helices conserved
1574_type4 57.80 52.26 63.55 conserved nt-14 'T' nt-8 'A' not formed conserved pseudogene
Musa laterita 1575_type1 58.33 55.48 62.74 conserved nt-9 'A' conserved four-helices conserved
1575_type2 58.33 55.48 63.21 conserved nt-9 'A' conserved four-helices conserved
Musa rubra 1590_type1 58.33 55.48 62.74 conserved nt-9 'A' conserved four-helices conserved
1590_type2 58.33 55.48 63.21 conserved nt-9 'A' conserved four-helices conserved 1590_type3 59.26 59.63 65.26 nt-11 'T' not
present-deletion
not present– deletion
not formed not formed pseudogene
Musa rosea x siamensis 1592_type1 61.29 57.42 68.69 conserved conserved conserved four-helices conserved
1592_type2 60.65 54.48 66.05 conserved conserved conserved not formed conserved pseudogene 1592_type3 58.80 55.86 63.51 conserved nt1–nt3
'deletion' nt-9 'A'
conserved four-helices not formed pseudogene
Musa rosea (hybrid) 1598 63.59 57.42 68.37 conserved conserved conserved four-helices conserved
Musa violascens 1514 65.02 58.06 66.83 conserved conserved conserved four-helices conserved
Musa lutea 1515 59.28 54.19 63.26 nt-11 'T' conserved nt-6 'T' four-helices conserved
nt-12 'A'
Musa beccarii var. beccarii
1516_type1 65.77 58.06 65.85 conserved conserved conserved four-helices conserved 1516_type2 64.86 58.06 65.37 conserved conserved conserved four-helices conserved 1516_type3 65.32 58.06 65.20 conserved conserved conserved four-helices conserved
Musa campestris var. sarawakensis
1517 59.64 48.95 61.46 nt-11 'T' nt-7 'T' conserved four-helices conserved nt-12 'A'
Musa monticola 1528 65.92 58.71 68.29 conserved conserved nt-3 'C' four-helices conserved
in some species and interspecific hybridization was frequent [6,47]. Our findings, as well as previous analyses based on different molecular markers [8,10,21,23], support the recent merger of sections Eumusa and Rhodochlamys into the section Musa.
The presence of odd numbers of 5S rDNA loci has been previously observed in some edible cultivars and wild species [9,17] and could be explained by structural chromosome heterozy-gosity and/or as a result of hybridization between two genotypes bearing different 5S rDNA sites. However, it is also possible that one of 5S rDNA loci contained a lower number of repeat units and the resulting signal was below the detection limit of FISH.
The representatives of the section Callimusa showed high variation in nuclear genome size as well as in the number of rDNA loci and were clearly discriminated from the accessions of the section Musa. ForM.borneensis(ITC.1531), the highest nuclear DNA content (2C = 1.772 pg) known for diploidMusaspecies was determined. The increased genome size was accompa-nied by a higher number of 45S and 5S rDNA loci in comparison with other Callimusa acces-sions. Until now, the largest genome size was detected inM.beccarii[9,48], which has also been characterized by more abundant distribution of rRNA genes. The present estimates of genome sizes as well as chromosome number and distribution of rDNA loci in bothM.beccarii varieties are in line with previous investigations [9,48].
An interesting outcome of this study is the observation of a negative correlation between the basic chromosome number (x) and nuclear genome size (1C), which became evident in this study after a wider range ofMusaspecies was analyzed. This trend could be explained by the evolution from a common ancestor by chromosome fission accompanied by DNA loss. This hypothesis is in line with Simmonds [49], who speculated that the lower chromosome number Table 2. (Continued)
Accession name ITS type ITS1* 5.8S* ITS2* Motif M1**
Motif M2**
Motif M3**
Secondary structure of ITS2
Secondary structure of 5.8S
Note
Musa beccarii var. hottana
1529 65.32 58.06 65.37 conserved conserved conserved four-helices conserved
Musa borneensis 1531_type1 65.02 57.42 65.37 conserved conserved conserved four-helices conserved 1531_type2 65.47 56.13 66.83 conserved conserved conserved four-helices conserved 1531_type3 65.92 56.77 68.29 conserved conserved conserved four-helices conserved
1531_type4 65.02 57.42 66.34 conserved conserved conserved not formed conserved pseudogene
Musa exotica 1532_type1 63.68 58.06 66.83 conserved conserved conserved four-helices conserved
1532_type2 63.68 58.06 66.34 conserved conserved conserved four-helices conserved 1532_type3 65.02 58.06 66.83 conserved conserved conserved four-helices conserved
Musa campestris var. limbangensis
1535_type1 64.13 58.06 65.85 conserved conserved conserved four-helices conserved 1535_type2 64.57 58.06 66.83 conserved conserved conserved four-helices conserved
1535_type3 56.50 50.32 59.51 nt-12 'A' conserved conserved not formed conserved pseudogene nt-16 'A'
Musa barioensis 1568_type1 61.88 56.13 62.80 nt-10 'G' nt-9 'A' nt-9 'T' four-helices conserved
nt-11 'A'
1568_type2 63.77 56.13 62.80 nt-10 'G' nt-9 'A' nt-9 'T' four-helices conserved nt-11 'A'
1568_type3 65.92 58.06 68.29 conserved conserved conserved four-helices conserved
1568_type4 60.99 54.19 63.77 conserved conserved conserved not formed conserved pseudogene
*) GC content [%]
**) Position of nucleotide changes (nt-) in conserved 5.8S motives
ofM.beccariiand the genusEnsetereflects their ancient origin. Similarly, Bekele and Shigeta [50] suggested thatEnsete glaucumandM.beccariiare ancestral forms ofEnseteandMusa with a common ancestor that is yet to be established and the ancestral chromosomal number of both genera is x = 9. On the other hand, if this hypothesis was true, representatives of the generaEnseteandMusellawould be expected to have a genome size comparable to that of and other Callimusa species. A more extensive study of the karyotype evolution in the family Musa-ceae will be necessary to explain this "the less chromosomes, the larger genome" trend emerging in the genusMusa, but not observed in other genera of the family.
SSR and ITS Analysis
SSR analysis provided important information about the genomes of 21 accessions of wildMusa species, which were genotyped using molecular markers for the first time. The grouping of the accessions within the diploid reference set was revealed by the UPGMA cluster analysis. In most cases, the results of this grouping (Fig 3) were consistent with the characterization based on traditional morpho-taxonomic classification. Apart from better characterization of the wild Musaspecies, the SSR profiles obtained in this work expand the database of reference SSR pro-files and thus improves the grouping and enhances the probability of identifying the closest rel-ative or an exact match for unknown accessions.
Short length, utilization of highly conserved primers and relatively fast evolution of internal transcribed spacers ITS1 and ITS2 as compared to rRNA genes, made the ITS region one of the most popular markers in phylogenetic studies. The first detailed information about the struc-ture and diversity of ITS region in the genusMusawas provided by Hřibováet al. [33], while
the work of Christelováet al. [12] showed the usefulness of the ITS for further analysis of acces-sions which give incongruous results with SSRs. High level of nucleotide diversity and presence of more than two types of ITS1-5.8S-ITS2 sequence region in eight wild diploid accessions (M.yunnanesis,M.rubinea,M.rubra,M.exotica,M.beccariivar.beccarii,M.borneensis,M. mannii,M.barionensis) indicate that they have originated from hybridization of different genotypes.
The close relationship ofM.itineransto B genome representatives observed after ITS analy-sis is in agreement with the study of Liuet al. [11]. This relationship was not supported by the SSR analysis. It is, however, possible that the grouping of some species will change after more representatives from both sections pass through the SSR genotyping pipeline. In a similar way, we have observed discrepancies in the position ofM.yunnanensis(ITC.1573) andM.rosea hybrid (ITC.1598), as well asMusa x fennicae (Musa siamensis (male) x Musa rosea (female) (ITC.1522) in the tree constructed from SSR and ITS data (see above;Fig 4, andS1andS2 Figs). The ITS analysis indicates that theM.yunnanensisaccessions included in our study orig-inated from hybridization of different genotypes (subspecies?) (Table 2), while the presence of only one ITS type sequence in the accession labeled asM.roseahybrid (ITC.1598) does not support its hybrid character. InMusa x fennicae (Musa siamensis (male) x Musa rosea (female) (ITC.1522), divergent types of ITS sequences were identified but all of them were related to AA genotypes, while SSR analysis showed close relationships of this clone with ornamental bananas (genotypes of former Rhodochlamys section). These observed discrepancies could be a consequence of dominance of one type of rDNA sequence in hybrids, which may lead to complete homogenization of rDNA locus originating from the second parent [51–53].
nucleotide composition and structure of the ITS region and showed that some of the wild dip-loids contained polymorphic ITS regions. Moreover,in silicoanalysis of the ITS sequences indicated the presence of putative pseudogenic ITS types. These observations indicate that some of the analyzed accessions of wildMusaspecies originated from hybridization between different genotypes within a species or between putative subspecies [33,54].
Conclusions
This study improves significantly the knowledge about the nuclear genome of wildMusa spe-cies. We provide novel data on nuclear genome size and genomic distribution of ribosomal genes in 21 wildMusaaccessions. We revealed high variability in both characters, especially in the section Callimusa. Our results indicate that species of theMusagenus evolved from a com-mon ancestor by chromosome fission, which was accompanied by DNA loss. Cladogram based on the SSR markers together with the previously studied wild diploids showed clear clustering and significantly increased the knowledge on genetic diversity withinMusagenus. SSR geno-typing platform enabled us to identify groups of the most related species and sub-species. Apart from phylogenetic analysis, characterization of ITS sequences indicated that more than a half of the new ITC accessions representing wildMusaaccessions originated from hybridiza-tion between different genotypes within a species or between putative subspecies.
Supporting Information
S1 Fig. Phylogenetic analysis based on the ITS1-ITS2 sequence region according to Hřibová et al. [34].BioNJ tree constructed from a Jukes-Cantor distance matrix of the concatenated
region containing ITS1 and ITS2 spacer sequence. Closely related speciesStrelitziaand Helico-niawere used as outgoup. The tree was rooted on midpoint. The main clades and subclades are distinguished by colors. The Australimusa/Callimusa clade in green; Rhodochlamys in yellow; BB genotypes in blue; AA genotypes in red and SS genotypes in pink. The ITS sequences of accessions analyzed in this study are shown in black.
(TIF)
S2 Fig. Phylogenetic analysis based on the ITS1-ITS2 sequence region according to Hřibová et al. [34].BioNJ tree constructed from a Jukes-Cantor distance matrix of the concatenated
region containing ITS1 and ITS2 spacer sequence including putative pseudogenic sequences. Closely related speciesStrelitziaandHeliconiawere used as outgoup. The tree was rooted on midpoint. The main clades and subclades are distinguished by colors. The Australimusa/Calli-musa clade in green; Rhodochlamys in yellow; BB genotypes in blue; AA genotypes in red and SS genotypes in pink. The ITS sequences of analyzed accessions are in black color. Putative pseudogenic ITS sequence regions are marked with asterisk.
(TIF)
S1 Table. The origin ofMusaaccessions analyzed in this study. (DOCX)
S2 Table. Nucleotide diversity of ITS1-5.8S-ITS2 regions. (DOCX)
Acknowledgments
We thank Jan Bartošfor valuable advice and Radka Tušková and Marie Seifertová for excellent
Author Contributions
Conceived and designed the experiments: JČEH JD. Performed the experiments: JČEH PC
IVH. Analyzed the data: JČEH PC RS. Contributed reagents/materials/analysis tools: MH NR
IVH. Wrote the paper: JČEH JD RS.
References
1. Simmonds NW, Shepherd K. Taxonomy and origin of cultivated bananas. Botanical Journal of Linnean Society. 1955; 55: 302–312.
2. Carreel F. Etude de la diversité génétique des bananiers (genreMusa)àl'aide des margueurs RFLP, PhD Thesis, Institut National Agronomique, Paris-Grignon; 1994.
3. Carreel F, Fauré S, González de León D, Lagoda PJL, Perrier X, Bakry F, et al. Evaluation of the genetic diversity in diploid bananas (Musasp.). Genet Sel Evol. 1994; 26 (Suppl 1): 125s–136s.
4. Katholieke Universiteit Leuven in Belgium. Available:http://www.crop-diversity.org/banana.
5. International Plant Genetic Resources Institute-International Network for the Improvement of Banana and Plantain/Centre de Coopération internationale en recherche agronomique pour le développement [IPGRI-INIBAP/CIRAD]. 1996. Description for Banana (Musaspp.). Int. Network for the Improvement of Banana and Plantain, Montpellier, France; Centre de coopération int. en recherche agronomique pour le développement, Montpellier, France; International Plant Genetic Resources Institute Press, Rome.
6. Cheesman EE. Classification of the bananas. II. The genusMusaL. Kew Bulletin 2: 106–117; 1947.
7. Argent GCG. The wild bananas of Papua New Guinea. Notes Royal Botanic Garden Edinburgh. 1976; 35: 77–114.
8. Wong C, Kiew R, Argent GCG, Set O, Lee SK, Gan YY. Assessment of the validity of the sections in
Musa(Musaceae) using AFLP. Ann Bot-London. 2002; 90: 231–238.
9. BartošJ, Alkhimova O, Doleželová M, De Langhe E, Doležel J. Nuclear genome size and genomic dis-tribution of ribosomal DNA inMusaandEnsete(Musaceae): taxonomic implications. Cytogenet Genome Res. 2005; 109: 50–57. PMID:15753558
10. Li L-F, Häkkinen M, Yuan Y-M, Hao G, Ge X-J. Molecular phylogeny and systematics of the banana family (Musaceae) inferred from multiple nuclear and chloroplast DNA fragments, with a special refer-ence to the genusMusa. Mol Phylogenet and Evol. 2010; 57: 1–10.
11. Liu AZ, Kress WJ, Li DZ. Phylogenetic analyses of the banana family (Musaceae) based on nuclear ribosomal (ITS) and chloroplast (trnL-F) evidence. Taxon. 2010; 59: 20–28.
12. Christelová P, Valárik M, Hřibová E, Van den Houwe I, Channeliere S, Roux N, et al. A platform for effi-cient genotyping inMusausing microsatellite markers. AoB PLANTS. 2011; plr024, doi:10.1093/ aobpla/plr024PMID:22476494
13. Häkkinen M. Reappraisal of sectional taxonomy inMusa(Musaceae). Taxon. 2013; 62: 809–813.
14. Doležel J, Doleželová M, Novák FJ. Flow cytometric estimation of nuclear DNA amount in diploid
bananas (Musa acuminataandM.balbisiana). Biol Plantarum. 1994; 36: 351–357.
15. Lysák MA, Doleželová M, Horry JP, Swennen R, Doležel J. Flow cytometric analysis of nuclear DNA content inMusa. Theor Appl Genet. 1999; 98: 1344–1350.
16. Čížková J, Hřibová E, Humplíková L, Christelová P, Suchánková P, Doležel J. Molecular analysis and
genomic organization of major DNA satellites in banana (Musaspp.). PLoS ONE. 2013; 8: e54808. doi:10.1371/journal.pone.0054808PMID:23372772
17. Doleželová M, Valárik M, Swennen R, Horry JP, Doležel J. Physical mapping of the 18S-25S and 5S
ribosomal RNA genes in diploid bananas. Biol Plantarum. 1998; 41: 497–505.
18. Osuji JO, Crouch J, Harrison G, Heslop-Harrison JS. Molecular cytogenetics ofMusaspecies, cultivars and hybrids: location of 18S-5.8S-25S and 5S rDNA and telomere-like sequences. Ann Bot-London. 1998; 82: 243–248.
19. Pillay M, Ogundiwin E, Nwakanma DC, Ude G, Tenkouano A. Analysis of genetic diversity and relation-ships in East African banana germplasm. Theor Appl Genet. 2001; 102: 965–970.
20. Gawel NJ, Jarret RL, Whittemore AP. Restriction fragment length polymorphism (RFLP)-based phylo-genetic analysis ofMusa. Theor Appl Genet 1992; 84: 286–290. doi:10.1007/BF00229484PMID:
24203185
21. Nwakanma DC, Pillay M, Okoli BE, Tenkouano A. Sectional relationships in the genusMusaL. inferred from the PCR-RFLP of organelle DNA sequences. Theor Appl Genet. 2003; 107: 850–856. PMID:
22. Wong C, Kiew R, Loh JP, et al. Genetic diversity of wild bananaMusa acuminataColla in Malaysia as evidenced by AFLP. Ann Bot-London. 2001; 88: 1017–1025.
23. Ude G, Pillay M, Nwakanma D, Tenkouano A. Analysis of genetic diversity and sectional relationships inMusausing AFLP markers. Theor Appl Genet. 2002; 104: 1239–1245. PMID:12582576
24. Risterucci AM, Hippolyte I, Perrier X, Xia L, Caig V, Evers M, et al. Development and assessment of Diversity ArraysTechnology for high-throughput DNA analysis inMusa. Theor Appl Genet. 2009; 119: 1093–1103. doi:10.1007/s00122-009-1111-5PMID:19693484
25. This P, Jung A, Boccaccii P, Borrego J, Botta R, Costantini L, et al. Development of a standard set of microsatellite reference alleles for identification of grape cultivars. Theor Appl Genet. 2004; 109: 1448– 1458. PMID:15565426
26. Hayden MJ, Nguyen TM, Waterman A, McMichael GL, Chalmers KJ. Application of multiplex-ready PCR for fluorescence-based SSR genotyping in barley and wheat. Mol breeding. 2007; 21: 271–281.
27. Pessoa-Filho M, Beló A, Alcochete AAN, Rangel PHN, Ferreira ME. A set of multiplex panels of micro-satellite markers for rapid molecular characterization of rice accessions. BMC Plant Biol. 2007; 7: 23. PMID:17517133
28. Crouch HK, Crouch JH, Jarret RL, Cregan PB, Ortiz R. Segregation of microsatellite loci in haploid and diploid gametes ofMusa. Crop Sci. 1998; 38: 211–217.
29. Lagoda PJL, Noyer JL, Dambier D, Baurens FC, Grapin A, Lanaud C. Sequence tagged microsatellite site (STMS) markers in the Musaceae. Mol Ecol. 1998; 7: 657–666.
30. Hippolyte I, Bakry F, Sequin M, Gardes L, Rivallan R, Risterucci AM, et al. A saturated SSR/DArT link-age map ofMusa acuminataaddressing genome rearrangements among bananas. BMC Plant Biol. 2010; 10: 65. doi:10.1186/1471-2229-10-65PMID:20388207
31. Musa Genotyping Centre was established at the Institute of Experimental Botany in Olomouc, Czech Republic. Available:http://musagenomics.org/genomics-tools/genotyping-centre/.
32. Alvarez I, Wendel JF. Ribosomal ITS sequences and plant phylogenetic inference. Mol Phylogenet Evol. 2003; 29: 417–434. PMID:14615184
33. Hřibová E,Čížková J, Christelová P, Taudien S, De Langhe E, Doležel J. The ITS-5.8S-ITS2 sequence
region in theMusaceae: structure, diversity and use in molecular phylogeny. PLoS ONE. 2011; 6: e17863. doi:10.1371/journal.pone.0017863PMID:21445344
34. Otto F. 1990. DAPI staining of fixed cells for high-resolution flow cytometry of nuclear DNA. In: Criss-man HA, Darzynkiewicz Z, ed. Methods in Cell Biology. Academic Press, New York.
35. Doležel J, BartošJ, Voglmayr H, Greilhuber J. Nuclear DNA content and genome size of trout and
human. Cytometry A. 2003; 51: 127–128. PMID:12541287
36. Nei M. Analysis of gene diversity in subdivided populations. Proc Natl Acad Sci USA. 1973; 70: 3321– 3323. PMID:4519626
37. Liu K, Muse SV. PowerMarker: integrated analysis environment for genetic marker data. Bioinformat-ics. 2005; 21: 2128–2129. PMID:15705655
38. Michener CD, Sokal RR. A quantitative approach to a problem of classification. Evolution 1957; 11: 490–499.
39. FigTree v1.4.0. Available:http://tree.bio.ed.ac.uk/software/figtree/.
40. Nwakanma DC, Pillay M, Okoli BE, Tenkouano A. PCR-RFLP of the ribosomal DNA internal tran-scribed spacers (ITS) provides markers for the A and B genomes inMusaL. Theor Appl Genet. 2003; 108: 154–159. PMID:12955208
41. Staden R. The Staden sequence analysis package. Mol Biotechnol. 1996; 5: 233–241. PMID:
8837029
42. Eckert AJ, Liechty JD, Tearse BR, Pande, Neale DB. DnaSAM: Software to perform neutrality testing for large datasets with complex null models. Mol Ecol Resour. 2010; 10: 542–545. doi:
10.1111/j.1755-0998.2009.02768.xPMID:21565054
43. Huson DH, Bryant D. Application of phylogenetic networks in evolutionary studies. Mol Biol Evol. 2006; 23: 254–267. PMID:16221896
44. Valárik M,Šimková H, Hřibová E,ŠafářJ, Doleželová M, Doležel J. Isolation, characterization and
chromosome localization of repetitive DNA sequences in bananas (Musaspp.). Chromosome Res. 2002; 10: 89–100. PMID:11993938
45. Harpke D, Peterson A. 5.8S motifs for the identification of pseudogenic ITS regions. Botany. 2008; 86: 300–305.
47. Shepherd K. Cytogenetics of the genusMusa(International Network for the Improvement of Banana and Plantain, Montpellier). 1999.
48. Häkkinen M, Suchánková P, Doleželová M, Hřibová E, Doležel J. Karyological observations inMusa beccariivar.hottana(Musaceae). Acta Phytotax Geobot. 2007; 58: 112–118.
49. Simmonds NW. The evolution of the Bananas. Longmans, London. 1962.
50. Bekele E, Shigeta M. Phylogenetic relationships betweenEnseteandMusaspecies as revealed by the
trnT trnFregion of cpDNA. Genet Resour Crop Ev. 2011; 58: 259–269.
51. Kovařík A, Matyášek R, Lim KY, Skalická K, Koukalová B, Knapp S, et al. Concerted evolution of 18– 5.8-26S rDNA repeats inNicotianaallotetraploids. Biol J Linn Soc. 2004; 82: 615–625.
52. Lim KY, Matyášek R, Kovařík A, Leitch A. Genome evolution in allotetraploidNicotiana. Biol J Linn Soc. 2004; 82: 599–606.
53. Kovařík A, Pires JC, Leitch AR, Lim KY, Sherwood AM, Matyasek R, et al. Rapid concerted evolution of
nuclear ribosomal DNA in twoTragopogonallopolyploids of recent and recurrent origin. Genetics. 2005; 169: 931–944. PMID:15654116
54. De Langhe E, Hřibová E, Carpentier S, Doležel J, Swennen R. Did backcrossing contribute to the origin