* Corresponding author.
E-mail address: [email protected] (R. B. Nyaoga)
© 2016 Growing Science Ltd. All rights reserved. doi: 10.5267/j.msl.2016.4.002
Management Science Letters 6 (2016) 427–442
Contents lists available at GrowingScience
Management Science Letters
homepage: www.GrowingScience.com/msl
Constraints management and value chain performance for sustainable development
Richard Bitange Nyaogaa* and Peterson Obara Magutub
a
Faculty of Commerce, Department of Accounting, Finance & Management Science, Egerton University, Nakuru- Kenya
b
School of Business, Department of Management Science, University of Nairobi, Kenya C H R O N I C L E A B S T R A C T
Article history: Received January 5, 2016 Received in revised format March 28, 2016
Accepted April 2, 2016 Available online April 2, 2016
Managers are ever seeking for better ways of managing their constraints to improve their company’s value chain performance and competitiveness. Although previous literature explored constraint management, it was inconclusive as to how constraint management could affect the value chain performance in tea processing chains. The purpose of this study is to determine the relationship between constraint management and firm value chain performance of tea processing firms. This study undertook an empirical study using survey questionnaire design to collect data. The respondents were production managers who have experience in production activities. The study applied multiple correlation and regression models to test the hypothesis. The results indicate that constraints management had a significant positive impact on improvement in quality, time, flexibility, cost and resource utilization in tea firms. This study provides a broad analysis of how organizations can improve their value chain performance for sustainable development by managing various constraints in the internal value chain. To the best of the authors’ knowledge, this is the first empirical study of the relationship between constraints management and value chain performance using data from tea processing firms operating in Kenya.
© 2016 Growing Science Ltd. All rights reserved.
Keywords: Theory of constraints Sustainable development Tea processing chains Balanced scorecard
1. Introduction
428
The Theory of Constraints (TOC) and Resource-Based view guided this study. Theory of Constraints (TOC) concentrates on the most critical issues of the system that hamper a firm’s efforts to making money now and in the future through the scarce available resources (Goldratt, 1990). A bottleneck or constraint is anything that hinders a system from achieving higher performance versus its goal. Step by step elevation of the system’s constraints will improve the organization’s performance and lead to sustainable development (Frazier & Reyes, 2000). The Resource-Based View (RBV) posits that the internal resources of the organizations and capabilities assist an organization to achieve sustainable competitive advantages (Madhani, 2009). Resources that are rare, valuable, inimitable and non-substitutable enable an organization to develop and maintain competitiveness for superior short-term and long-term performance (Newbert, 2008). Firms make use of the internal resources and capabilities to determine strategic choices so as to compete in the external business environment and add value to their customer value chains now and in the future (Madhani, 2009).
Value addition in tea production to provide customers globally with pure branded teas blended at the source is necessary. Kenya exports value-added teas as tea in small packets and bags; and also herbal tea, green tea and flavored tea instead of black tea. There is a need to promote the increase of sales through product diversification that will lead increase in profitability and finally achieving the goal of industrialization (“www.teaboard.or.ke,” n.d.). Value added tea production is concerned with the development of high-quality instant milk tea mixture for vending machine and the preparation of natural products from tea leaves for cosmetic applications and stabilized catechin mixture (Abeysinghe, 2013). Organizations have found it more important than ever to manage their supply chain to ensure lower cost, best customer service, and short cycle time (Simatupang, Wright, & Sridharan, 2004; Yilmaz & Bititci, 2006). Over the years, the tea farming in Kenya has made significant strides in tea variety improvement, technologies in plant nutrition management, better agricultural and tea manufacturing practices, pests and disease control techniques, and sensitization on benefits of tea branding. Efforts for cost-cutting technologies that include cost-effective and environmentally friendly alternative sources of energy, cost efficient tea harvesting, and processing techniques have also been developed (“www.tearesearch.or.ke,” n.d.). In spite of these developments, Kenya has continued to be a producer of processed tea with little product differentiation and value addition that has hindered growth in profitability and meeting their shareholders’ needs and expectations. Also, the value chain approach has not been widely applied in developing countries. Thus, there is a lack of understanding of the principles and methods used to analyze and develop value chains (Macharia, Collins, & Sun, 2013). Therefore, the various constraints that affect productivity, quality, customer satisfaction, and environmental conservation were investigated to determine their influence on value chain performance for sustainable development.
The rest of this paper is organized as follows. First, brief information on tea industry in Kenya is provided. The relevant literature related to the proposed model is presented, along with the hypothesis. Second, the research methodology is presented, followed the discussion of the research results of the analysis. The last section draws conclusions on the contributions, implications, and limitations of the current study and suggestions for future research.
2. Literature Review
customer requirements with an objective of being cost-effective and efficient across the entire system which should be well integrated.
2.1 Tea Industry in Kenya
Tea farming comprises of the Smallholders sector and the plantation sector. Over sixty percent (60%) of the tea production is by smallholders and marketed by the Kenya Tea Development Tea Authority (KTDA). The Ministry of Agriculture provides technical and policy guidance to the tea farming. Kenya is the largest producers of tea in Africa and is one of the leading countries in producing black tea. The tea industry in Kenya contributes 26% of the total export earnings, 8% of the total employment and 4% of the Gross Domestic Product (GDP). Even though new technologies have been introduced in tea picking, over 90% of tea in Kenya is handpicked. Kenyan tea is exported to countries like the UK, Russian Federation, USA, Pakistan, Iraq, Egypt, and the United Arab Emirates (www.teaboard.co.ke). The industry contributes to environmental conservation through improved water infiltration, reduced soil erosion and reduces energy consumption (“www.tearesearch.or.ke,” n.d.).
2.2 Constraints Management
A constraint or bottleneck is any resource that limits or hinders any system or organization from realizing its set goals (Goldratt, 1990). A bottleneck can be a machine, scarce or highly skilled labor, or a specialized tool. A non-bottleneck is any resource whose capacity is greater than the demand placed on it. A non-bottleneck, therefore, should not always be working because it can produce more than what is demanded (Chase et al., 1998). The various forms of constraints which organizations face include:
2.1.1 Policy constraints
The policy constraints are a management imposed guideline on how a process is to run that may be written or unwritten. Policy constraints include mindset constraints, measures constraints, and methods constraints. Mindset refers to the thought process or culture of the organization. Measures constraints handle situations that encourage behaviors that have an adverse impact on the performance of an organization. Methods constraints are the procedures and techniques that are used to determine how organizations carry out their day-to-day operations. Policy constraints if not properly monitored, will interfere with the smooth flow of work in the organization that in turn affect the overall throughput of the system (Frazier & Reyes, 2000). Goldratt & Fox (1986), developed a system to help in dealing with policy constraints i.e. Application of Thinking Processes of “What needs to be changed? What should it be changed to? What actions will cause the change?”. The discussion of this process is beyond this study.
A well formulated organizational policy enables an organization to keep sight of its priorities in the face of the pressure of changing business environment and adopt a stable and a balanced approach. The biggest problem in managing the constraints is the wrong assumption that improving throughput on all resources will result in decreased operational costs and improved profits (Goldratt, 1990). No policy is appropriate at all times due to changing environment in which organizations operate. The hierarchical management styles hinder organizations from reaching their full potential because their measurement plans that are unidirectional- financial measure (Berry & Belle, 2005). Therefore, there is need to adjust the policies to reflect the changes so that organizations remain competitive and achieve their goals of sustainable development.
2.1.2 People constraints
430
business environment, organizations can no longer afford to waste the potential of their workforce. People in firms need the skills and ability to do their job effectively (Chandrasekar, 2011). People are fundamentally concerned about their psychological, physical and social aspects both at their workplace and private life. People management has become one of the important areas in organizations because the other competitive factors have become less powerful compared to people management (Çalişkan, 2010). Managers are concerned with the optimum attainment of organizational goals and objectives with and through other people. Tea firms are characterized by many strategies to manage people that include: broad spans of control, democracy, and autonomy (Waldron, 1994). Employees’ perceptions of their work culture and work climate influence their motivation hence leading to changes in the work environment resulting in increased employee satisfaction and productivity. Enhanced motivation lead to greater work efficiency and thus lowers labor-related costs (Peterson & White, 1992).
Employees should be positively motivated and respected by their immediate supervisors so as to realize the positive impact of ‘organizational policies’ on organizational performance. Organizations that manage people well are more likely to enjoy success and to grow than those which do not (Purcell et al., 2009). Involving employees in the process of planning new policies and practices can help foster employee acceptance of the change. Managers of tea firms are painfully trying to revise and develop new skill sets to be world-class organizations. Failing to handle change correctly can be more devastating making organizations fail to reflect, discover, assess, and act so as to face the competitive market.
2.1.3 Equipment constraints
The way equipment in organizations are configured and used, may make it difficult to achieve an organizational goal and the level of output required by the market. The scale and capacity of equipment and machinery used in the production process determine the level of output in organizations. Value chain performance in organizations is mostly affected by equipment constraints whose severity depends on the management policies and demand conditions. Properly configured equipment enable the manufacturing organizations to achieve the required level of output and achieve sustainable development (Aneiros, 2011).
2.1.4 Market constraints
2.3 Value chain performance
All value chains should be focused on optimizing performance efficiently and delivering value to the customers in a sustainable manner (Nyaoga, Wang, & Magutu, 2015b; Ruben, Slingerland, & Nijhoff, 2006). Customers’ requirements for product customization, quality improvement, and demand responsiveness have put a lot of pressure on manufacturers (Tulasi & Rao, 2012). Many firms are no longer competing on financial aspects but nonfinancial competitive edges like throughput time, inventory turnover, process flexibility, product introduction responsiveness. The primary emphasis of both sustainable development and sustainability falls on the strategic and wise use of resources for the long-run benefit of the society. Most discussions on sustainable development have mainly focused on achieving sustainability in economic and social welfare systems for generations now and in future without affecting the ecological balance (Chin et al., 2015).
The upstream complexity, internal manufacturing complexity, and downstream complexity have hurt the manufacturing plant performance and sustainable development. Hence, management needs to study the system to determine which part of the value chain they should focus their attention so as to improve performance in the organization (Bozarth et al., 2009; Nyaoga et al., 2015a). Chan and Qi (2003) suggested a process-based system of measuring supply chain performance to enable the performance measurement systems to locate the problems and facilitate the process re-engineering. Performance measurement system should indicate the comprehensive performance of the supply chain involving both financial and non-financial indicators (Chan & Qi, 2003). Flynn et al. (2010) posits that when measuring performance, organizations should consider how quickly organizations modify products to meet customers’ requirements, how quickly they introduce new products into the market, how quickly they respond to changes in market demand, on-time delivery, growth in sales, return on investment and lead time for fulfilling customers’ orders. Sanjika (2010) posits that the approach of TOC should be employed to deal with complex issues that make it difficult to implement the various techniques aimed at improving performance in a sustainable manner. Proper management of the natural environment is vital to the current and future economic and social development of humanity. Economic and social sustainability rely on environmental performance. In pursuit of rapid economic growth, the activities in the value chain have grossly under-valued the nature and importance of the natural capital (both renewable and non-renewable) for present and future generations. Thus, the world is now faced with threatening environmental issues such as resource degradation and depletion, climate change, emission of pollutants and loss of biodiversity (Diab et al., 2015; Glover et al., 2014). Improved tea farming practices result in proper soil management that maintains the quality of the soil for a long term and efficient management of natural resources like forests and water to ensure their availability for future generations.
432
Shepherd and Günter (2006) argued that performance measurement should measure supply chain relationships in the entire supply chain rather than measuring intra-organizational performance only. Supply chain performance measurement should complement human resource management and modern manufacturing practices (Shepherd & Günter, 2006). Dynamic performance measurement system should respond to environmental and strategic changes in the organization. Kaplan and Norton (1992) argued that organization’s performance should be based on the Balanced Scorecard criteria of financial measures, the customer satisfaction, the internal business process, and the learning and growth aspects. BSC advocates for the maintenance of a balance between short-term and long-term objectives; financial and non-financial measures and between internal and external performance (Kaplan & Norton, 1992; Sillanpaa, 2011). The customer perspective is concerned with how the company adds value for the customers through time, quality, performance, service, and cost. The financial goal measures the financial success of the organization regarding profitability, growth, and shareholder value. Innovation and learning perspective concerns with how the company can continue to improve and create value in the future. The internal business perspective focuses on the value customer element (Kaplan & Norton, 1992). Bhagwat and Sharma (2007) used the balanced scorecard to provide useful guidance for managers to evaluate and measure the value chain performance in a balanced way. Effective value chain performance measurement objectives should be balanced and include all the metrics at all levels of strategic, tactical, and operational that can either be financial and non-financial measures (Bhagwat & Sharma, 2007). Economic gain is the primary objective of all the stakeholders involved in the value chain activities. The economic dimension of sustainable development mainly involves profits, relationships and financial incentives, and the economic viability of individuals and businesses (Paloviita, 2010). This aspect revolves around efficient management of financial, tangible and intangible capital so as to achieve an organization’s financial growth objectives (Trienekens et al., 2012). Firms should endeavor to improve their economic gains through value creation; through managing costs in their supply chain and adjust their strategies. According to Weng et al. (2015), green innovation practices have a significant effect on firm performance (financial and non-financial). Firms should pursue activities that enhance not only efficiency and competitiveness but also leave a positive impact on the natural environment and the society (Carter & Rogers, 2008). According to Porter (1990), internal market development is one of the key determinants in creating, sustaining and promoting a healthy environment and creating a competitive edge for any industry. The tea sector will be sustainable when all value chain activities, practices and plans are designed to deliver sustainability economic, social and environmental benefits (Trienekens et al., 2012). Social sustainability is concerned with how individuals, societies, and communities co-exist and set out to realize the objectives of development models that they have in place the physical boundaries of their areas and the whole ecosystem. True sustainability cannot be achieved without taking care of the needs of the society. Thus, integrated efforts should be geared towards improving the skills, capabilities and well-being of the persons in organizations (Colantonio, 2009). The dimensions of sustainable development are critical depending on the stage of development of a country. In developing countries, the economic and environmental sustainability are important while in developed countries all the three dimensions are crucial (Magutu et al., 2015; Rosen & Kishawy, 2012; Vasileiou & Morris, 2006). This study only looked at economic and environmental sustainability since the focus was in Kenya a developing economy.
consumption, and energy consumption. The outbound value chain performance was measured in terms of delivery flexibility, customer price margin, customer response time, customer satisfaction, range of products, distribution costs, enterprise distribution effectiveness, volume transported costs, empty runs, inventory cost, inventory turnover ratio, on-time shipment, product availability, on-time delivery, order fill rate, order lead time, resolution of customer complaints, volume flexibility, returns/refusals from customers, and reduction in unit costs.
A successful constraints management implementation will have benefits of increased profit, rapid improvement, improved capacity, reduced lead times, reduced inventory and better utilization of scarce resources. The review of the literature above is by no means exhaustive but assumed to be sufficient to highlight several issues that led to the following research questions. The research questions are: Does equipment constraint management affect the value chain performance of tea processing firms in Kenya? Does people constraint management affect the value chain performance of tea processing firms in Kenya? Does policy constraint management affect the value chain performance of tea processing firms in Kenya? Does market constraints affect the value chain performance of tea processing firms in Kenya?
From the literature review on the TOC, Value chain performance and the Resource-Based view of the firm, we propose the hypothesis:
H1: There is a relationship between constraint management and value chain performance of tea processing firms.
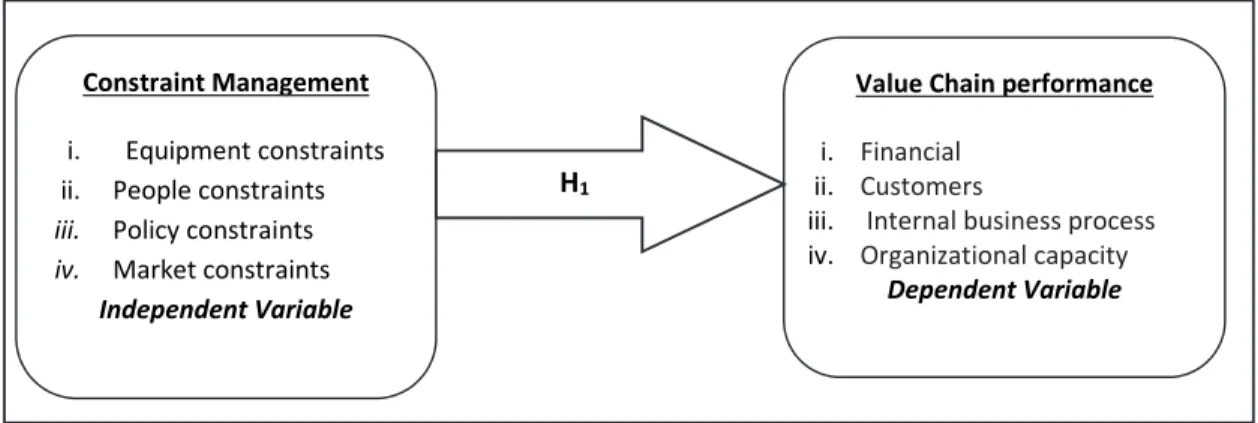
3. Conceptualresearch framework
The aim of this study to determine the relationship between constraints management and value chain performance in a sustainable way. Based on a literature review, first, four constraints (policy, people, market, and equipment constraints) have been identified. Second, Value Chain Performance metrics based on productivity, quality, customer satisfaction, and environmental conservation have been identified guided by the BSC. Figure 1 summarizes the conceptual research framework.
Fig. 1. A conceptual framework
4. Materials and Methods
4.1 Data Collection and the Sample
A positivistic philosophical standpoint guided this study. In its basic form, the positivist extreme adopts the view that facts and values are distinct, and that accurate knowledge of phenomena exists and is measurable (Buttery & Buttery, 1991; Stiles, 2003). This study adopted a cross-sectional survey using a questionnaire survey. The study population consisted of 107 tea processing firms in Kenya where the
Constraint Management
i. Equipment constraints
ii. People constraints
iii. Policy constraints
iv. Market constraints
Independent Variable
Value Chain performance
i. Financial
ii. Customers
iii. Internal business process
iv. Organizational capacity
434
respondents were Production Managers. The multi-stage sampling method was used to select the sample where all the tea processing firms were selected then the target population stratified into forty-seven (47) strata based on the geographical location in terms of counties. A stratified random sample of eighty-four (84) firms using Cochran (1963) sample selection formula (Eqs. (1-2)) was determined. Then proportionate sample sought from each of the groups for purposes of providing survey data was determined using Eq. (3). Based on a comprehensive literature review on constraint management and value chain performance and consultation with experts who had experience in the value chain performance, a questionnaire and data forms were designed to collect primary and secondary data respectively. The researchers delivered the questionnaires personally to the respondents. Secondary data was obtained from firm annual reports, office manuals, circulars, policy papers, corporate plans and survey reports from Kenya Central Bureau of Statistics (KCBS) for the period 2008-2012. A total of 84 questionnaires were sent to the randomly sampled tea firms. Of these firms, only sixty-six (66) of them responded giving a response rate of seventy-eight point six (78.6%) percent. Among the returned questionnaires, only forty-four (44) produced valid questionnaires in this study. Non-response bias was assessed by comparing early and late waves of returned questionnaires using the t-test on the two groups that yielded no statically significant differences (p>0.5) as advocated by Chen & Paulraj (2004).
2 2
1
m p p t
n
(1)
where nis the required sample size. t is the confidence level of 95% (standard value of 1.96). pis the estimated percentage prevalence of the population of interest – 50% was preferred and mis the margin of error at 5%. Cochran (1963) correction formula in Eq. (2) was used to calculate the final sample size.
0 0
, 1 1
n n
n N
(2)
where: nis the sample size and Nis the population size.
The sub-sample size for each county was determined using the formula by Krejcie & Morgan (1970) given as:
,
p S s
P
(3)
where:sis the Sub-sample size for each county;p= Subpopulation of tea processing firms in each county;Sis the sample size for the study; Pis the total population.
4.2 Data Analysis
weight year
of i t Achievemen
WFVCP t (4)
where: WFVCP= Weighted Firm Value Chain Performance, i is the domain i.e.A= Input Material Cost Performance. B= Value Chain Surplus Performance- which refers to what the customer has paid less the total cost incurred across the supply chain. C = Output product Cost Performance and t is the year: Five-year planning period is a common characteristic of an organization where the focus here is between 2008 – 2012. Increasing value chain surplus increases the amount of profit to be shared among the supply chain members. Value chain surplus is maximized when all the supply chain stages work towards a common goal (Kibum et al., 2014). The yearly Firm’s Value Chain Performance (AWFVCP) Composite was computed as in Eq. (5) below.
C B
A WFVCP WFVCP
WFVCP composite
AWFVCP (5)
where: AWFVCP = Annual Weighted Firm’s Value Chain Performance, WFVCP = Weighted Firm
Value Chain Performance for the domains A, B and C. The Weighted Firm Value Chain Performance Index (WFVCPI) was computed from Eq. (5) above as an average of the five year’s Annual Weighted Firm’s Value Chain Performance (AWFVCP composite).
5
5 4
3 2
1 Year Year Year Year
Year AWFVCP AWFVCP AWFVCP AWFVCP
AWFVCP
WFVCPI , (6)
where WFVCPI is the Weighted Firm Value Chain Performance Index; AWFVCP is Annual Weighted
Firm’s Value Chain Performance Composite for each of the five years. To establish effects of constraints management (Independent variable),x1pon value chain performance (Dependent Variable) among tea processing firms in Kenya, Eq. (7) was written in the following form:
i
x x x x
WFVCPI
0
1 1
2 2
3 3
4 4
(7)where: WFVCPI is the Weighted Firm Value Chain Performance Index constrained and is a linear function of x1,x2,x3 andx4 plus
i as computed from equation (6) above.
0is the regression constantor intercept; x1p are independent variables (four constraints). 1p are the regression coefficients/ change induced in WFVCPI by each x. εi is a random variable.
In the next section, hypothesis developed for the study was tested. Correlation analyzes were done to establish the relationships between the study variables. In the correlation analysis, the data was collected on at least two variables for the same group of subjects and a coefficient of correlation calculated between them.
5. Empirical Results
The study used a questionnaire survey to measure the four constraints: Market constraints, people constraints, Policy Constraints, and Equipment constraints. The study used Multiple Regression and correlation models to verify the hypothesis.
5.1 ValueChain Performance Index
Data for the five years were obtained to determine the value chain performance index. The weighted scores, the average score and composite scores based on the mean achievements of all the firms that participated in this study were given. The approach in Table 1S was used to compute the individual firm performance and further employed in the correlation and regression analysis.
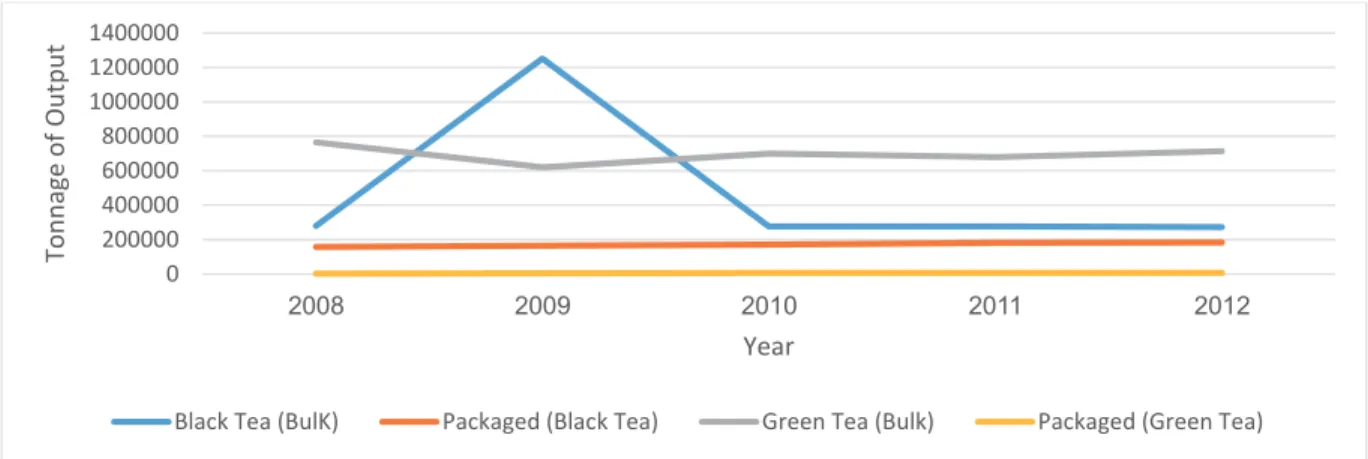
5.2 Tea Production
436
crush tear and curl teas and green teas (CTC). The average tonnage for the respective categories of teas for a five-year period is given in Table 1.
Table 1
Tea Production Criteria
Tea Production Criteria
Unit of Measure
5 Years Achievements
2008 2009 2010 2011 2012
Black Tea (Bulk) (Tons) 279825.85 1250983.17 276830.2 276505.01 273130.48 Packaged Black Tea (Tons) 156999.57 164809.85 171051.7 182185.16 184062.38 Green Tea (Bulk) (Tons) 764444.52 620278 700151.5 679450.74 713810.86 Packaged Green Tea (Tons) 2763.33 4662 6350 6490.66 6067.67
The actual output in Table 1 is a composite of the tonnage of output from the 44 firms that participated in this study. Fig. 2 below shows the trend in tea production category for the five-year period (2008 – 2012).
Fig. 2. Tea Production Criteria
From the trend in Fig. 2, the non-value added tea has been on the decline and the firms are investing more in the value added tea of green packaged and bulk tea. Thus indicating that local firms have invested more in value added tea processing.
5.3 Correlation Analysis of the relationship between Constraint Management and Value Chain Performance
The results of the correlation analysis on the relationship between constraint management and value chain performance presented in Table 2 shows a significant positive relationship (r = 0.326, p< 0.01). The two constraints that have some connection with value chain performance are market constraints and people constraints as shown in Table 2.
Table 2
Correlation between Constraints Management and Value Chain Performance
Variables
Pearson Correlation Coefficient
Market Constraints
People Constraints
Policy Constraints
Equipment Constraints
Value Chain Performance The external marketplace is constraining the
throughput (Market Constraints) 1
Allowing the firm's equipment running to lower the
manufacturing cost per piece (People Constraints) .733(**) 1 Strict adherence to required or recommended ways of
working (Policy Constraints) .716(**) .540(**) 1
The firms face shortage in working tools and equipment to support its operations (Equipment Constraints)
.676(**) .586(**) .581(**) 1
Value Chain Performance .326(*) .321(*) .107 .238 1
* Correlation is significant at the 0.05 level (2-tailed). ** Correlation is significant at the 0.01 level (2-tailed).
0 200000 400000 600000 800000 1000000 1200000 1400000
2008 2009 2010 2011 2012
T
o
nnage
of
Output
Year
These results in Table 2 show that the external marketplace is constraining the throughput by allowing the firm's equipment run to lower the manufacturing cost per piece hence affecting value chain performance.
5.4 Hypothesis Testing
The study aim was to determine the relationship between constraint management and value chain performance of tea processing firms in Kenya. The literature review led to the belief that market, people, policy and equipment constraints have a relationship value chain performance. Hence, the study tested the hypothesis that constraint management has a relationship with the value chain performance of tea processing firms in Kenya. The types of constraints consisted of primary data on the market, people, policy and equipment constraints. The balanced scorecard was used to compute value chain performance index from the secondary data for each firm for five years. The Pearson’s correlation showed a positive relationship between constraint management (r = 0.326, p< 0.01) and value chain performance. Further analysis, the multiple regression analysis generated the following regression model as presented in Table 3.
Table 3
The Relationship between Constraint Management and Value Chain Performance
Model Summary ANOVA(f)
Model R R Square Adjusted R Square Std. Error of the Estimate
Mean
Square F Sig.
1 .668(a) .446 .434 47.43529 80637.486 35.837 .000(a)
a Predictors: (Constant), The firms faces shortage in working tools and equipment to support its operations (equipment Constraints), Strict adherence to recommended ways of working (Policy Constraints), Allowing the firm's equipment running to lower the manufacturing cost per piece (People Constraints) , The external marketplace is constraining throughput (Market Constraints).
The multiple regression model of the effect of constraints management on value chain performance is significant positive at the set confidence interval of 95% (sign. = 0.00) as shown in the regression results in Table 3. The model generated is a good predictor of the effect of constraint on value chain performance. This regression model shows that constraint management has a significant effect on the value chain performance of tea processing firms in Kenya. From the study findings, constraints management explains 43.4% of the changes in the firm’s value chain performance level. The coefficients of this predictive model of the effect of management on firm’s value chain performance level are given in Table 4.
Table 4
Regression Coefficients for the Relationship between Constraints Management and Value Chain Performance
Regression Coefficients
Unstandardized Coefficients
Standardized Coefficients
t Sig.
Collinearity Statistics
B Std. Error Beta Tolerance VIF
(Constant) -1.838 11.483 -.160 .874
The external marketplace is constraining
throughput (Market Constraints) 5.465 4.168 .359 1.311 .197 .289 3.464
Allowing the firm's equipment running to lower the manufacturing cost per piece (People Constraints)
2.604 3.235 .177 .805 .426 .447 2.236
Strict adherence to required or recommended
ways of working (Policy Constraints) -4.117 3.197 -.276 -1.287 .206 .470 2.129
The firms faces shortage in working tools and equipment to support its operations (Equipment Constraints)
.770 3.055 .052 .252 .802 .507 1.973
438
Multicollinearity test was conducted to determine the correlation of the explanatory variables. Multicollinearity occurs when two or more predictors in the model are correlated and provide redundant information about the response. The diagnostics variance inflation factor (VIF) and tolerance were used to test multicollinearity of the independent variables. However, there is no universal criterion for determining the minimum level of the tolerance value or VIF. Some researchers argue that a tolerance value less than 0.1 or VIF greater than ten (10) roughly indicates significant multicollinearity. Others
insist that a magnitude of model’s R2 to be considered determining the significance of
multicollinearity. While others argue that if the correlation is between two or more independent variables is higher that is R2 is greater than 0.80, then multicollinearity problem is present (Belsley, 1991). The results of this study indicate that VIF values were much lower than the recommended cut-off of 10 (Midia et al., 2010). Thus, suggesting the absence of multicollinearity in the data (respective VIF values were market constraints = 3.464, people constraints = 2.236, policy constraints = 2.129 and equipment constraints = 1.973).
From the specific beta coefficients for the various constraints management in Table 5, all the four constraints (Equipment, policy, people and market constraints) make a contribution to the firm’s level of firm’s value chain performance. With standardized coefficients, the constraints when well managed have a significant (p≤0.00) positive effect on the firm’s level of value chain performance are market constraints management (Beta = 0.359), people constraints management (Beta = 0.177), strict adherence (Policy) constraints (Beta = 0.276) and equipment constraints (Beta = 0.052). This implies that for every unit level of the value chain performance improvements, the management of market constraints contributes 36%; people constraints contribute 18%, Policy constraints contribute 27.6% while equipment constraints contribute 5%. Thus, firms should invest more in controlling the marketing constraints to monitor the flow of outputs to the marketplace while coordinating the people and equipment bottlenecks. To establish the effect of constraints management on value chain performance of the tea processing firms in Kenya, Eq. (7) as modeled:
i ε 4 x 4 β 3 x 3 β 2 x 2 β 1 x 1 β 0 β
WFVCPI (7)
The predictive model of the effects of constraint management on value chain performance of tea processing firms in Kenya, therefore, is taken as:
s constraint equipment 0.052 s constraint policy 0.276 s constraint people 0.177 s constraint market 0.359 e Performanc Chain Value
From Table 3 and Table 4, the constraints had a positive significant effect on firm’s value chain performance with a correlation coefficient of R = 0.446 (a) and adjusted R2 = 43.4%, F = 35.837; Sig. = .000(a). Thus, constraints management is a significant predictor of the firm’s value chain performance. Thus, the hypothesis that there is a relationship between constraint management and value chain performance is accepted.
6. Conclusions and Implications
therefore, beneficial for firms to develop strategies to manage the various system constraints that hinder them from achieving their goal of making money now and in the future.
There are two theoretical contributions in this paper. Firstly, this paper combines the ideas of Theory of Constraints and resource-based view to extending the research on constraint management and how to sustainably improve value chain performance through the management of people, market, equipment and policy constraints. Secondly, there is no previous research discussing the relationship between constraint management and value chain performance, particularly in the tea processing chains. This study establishes that constraint management positively affects value chain performance to fill the research gap. The practical contributions of this study are that the survey confirms that increasing management of constraints, it improves value chain performance. A firm that would like to improve their competitiveness and value chain performance have to manage the system constraints. Management of the constraints can help manufacturing enterprises to attain significant value chain performance and sustainable development.
Aneiros (2011) explored the effect of equipment disruptions and policy management effectiveness in process supply chains. This study’s findings are in agreement with Aneiros (2011) arguments that constraints in the form of equipment and administration policy affect the value chain performance of any firm. Zsidisin and Hartley (2012) discussed the influences of market constraints on value chain performance. Again the research findings agree with the results of Zsidisin and Hartley (2012). In order to improve value chain performance, tea processing firms should determine the various constraints that affect the smooth operations of the tea firms. The scarce resources in the firms should be focused on the system constraints since focusing on everything is tantamount to focusing on nothing!
7. Limitations and Further Research
This study provides some directions for future research based on limitations. Firstly, this study was undertaken in Kenya providing an excellent perspective from a developing economy. However for greater generalizability of this research findings; we propose future research to focus on other countries to compare the results. Secondly, this study adopted an empirical research using a questionnaire survey that only provided cross-sectional data; more studies in future are required based on the longitudinal study to establish the causality relationship between constraints management and value chain performance for sustainable development. Thirdly, future studies need to have a broader perspective of sustainable development instead of looking at only the economic and environmental aspects. Finally, we believe that the research results are beneficial to researchers, policy makers, managers, and practitioners, and contribute to research in future. The government policies and agricultural policies should be designed from a sustainable development viewpoint since the exclusive focus on economic dimension is no longer viable. Firms should realize that adequate attention should be given to framing policies on social, environmental and economic aspects.
440
Acknowledgments
Authors wish to thank the editor-in-chief and the anonymous reviewers for helpful comments and guidelines. We also thank the respondents from the studied firms for making this research possible.
References
Abeysinghe, I. B. (2013). Tea Research Institute Major Issues in the Tea Industry.
Aneiros, A. M. (2011). Equipment Disruptions and management policy effectiveness in process industry supply
chains. University of Wollongong.
Belsley, D. A. (1991). A Guide to using the collinearity diagnostics. Computer Science in Economics and
Management, 4(1), 33–50. http://doi.org/10.1007/BF00426854
Berry, R., & Belle, L. (2005). Conceptual foundations for The Theory of Constraints. Human Systems
Management, 24(1), 83–94. http://doi.org/0167-2533/05/$17.00
Bhagwat, R., & Sharma, M. K. (2007). Performance measurement of supply chain management: A balanced scorecard approach. Computers and Industrial Engineering, 53(1), 43–62. http://doi.org/10.1016/j.cie.2007.04.001
Bozarth, C. C., Warsing, D. P., Flynn, B. B., & Flynn, E. J. (2009). The impact of supply chain complexity on manufacturing plant performance. Journal of Operations Management, 27(1), 78–93. http://doi.org/10.1016/j.jom.2008.07.003
Buttery, E. A., & Buttery, E. M. (1991). Design of a Marketing Information System: Useful Paradigms.
European Journal of Marketing, 25(1), 26–39. http://doi.org/10.1108/03090569110136303
Çalişkan, E. N. (2010). The impact of strategic human resource management on organizational performance.
Journal of Naval Science and Engineering, 6(2), 100–116.
Carter, C. R., & Rogers, D. S. (2008). A framework of sustainable supply chain management: moving toward new theory. International Journal of Physical Distribution & Logistics Management, 38(5), 360–387. http://doi.org/10.1108/09600030810882816
Chan, F. T. S., & Qi, H. J. (2003). An innovative performance measurement method for supply chain management. Supply Chain Management: An International Journal, 8(3), 209–223. http://doi.org/10.1108/13598540310484618
Chandrasekar, K. (2011). Workplace Environment and Its Impact on Organisational Performance in Public Sector. International Journal of Enterprise Computing and Business Systems, 1(1), 1–16.
Chase, R. B., Aquilano, N. J., & Jacobs, F. R. (1998). Production and Operations Management: manufacturing
and services (9th ed.). New Delhi: McGraw-Hill.
Chen, I. J., & Paulraj, A. (2004). Towards a theory of supply chain management: The constructs and measurements. Journal of Operations Management, 22(2), 119–150. http://doi.org/10.1016/j.jom.2003.12.007
Chin, T. A., Tat, H. H., & Sulaiman, Z. (2015). Green Supply Chain Management, Environmental Collaboration and Sustainability Performance. Procedia CIRP, 26, 695–699. http://doi.org/10.1016/j.procir.2014.07.035 Cochran, W. G. (1963). Sampling Techniques (2nd ed.). New York: Wiley & Sons.
Colantonio, A. (2009). Social sustainability: a review and critique of traditional versus emerging themes and assessment methods. In Second International Conference on Whole Life Urban Sustainability and its
Assessment (pp. 865–887). Loughborough, UK.
Diab, S. M., Al-bourini, F. A, & Abu-rumman, A. H. (2015). The Impact of Green Supply Chain Management Practices on Organizational Performance : A Study of Jordanian Food Industries. Journal of Management
and Sustainability, 5(1), 149–157. http://doi.org/10.5539/jms.v5n1p149
Flynn, B. B., Huo, B., & Zhao, X. (2010). The impact of supply chain integration on performance: A contingency and configuration approach. Journal of Operations Management, 28(1), 58–71. http://doi.org/10.1016/j.jom.2009.06.001
Frazier, G. V, & Reyes, P. M. (2000). Applying Synchronous Manufacturing Concepts To Improve Production Performance in High-Tech Manufacturing. Production & Inventory Management Journal, 3(3), 60–65. Glover, J. L., Champion, D., Daniels, K. J., & Dainty, A. J. D. (2014). An Institutional Theory perspective on
sustainable practices across the dairy supply chain. International Journal of Production Economics, 152, 102–111. http://doi.org/10.1016/j.ijpe.2013.12.027
Goldratt, E. M. (1990). What Is This Thing Called Theory of Constraints and How Should It Be Implemented?
Goldratt, E. M., & Fox, R. E. (1986). The Race (1st ed.). North River Pr.
Gupta, M. (2003). Constraints management--recent advances and practices. International Journal of Production
Research, 41(4), 647–659. http://doi.org/10.1080/0020754031000065458
Huchet-bourdon, M. (2011). Agricultural Commodity Price Volatility. OECD Food, Agriculture and Fisheries
Working Papers.
Kaplan, R. S., & Norton, D. P. (1992). The balanced scorecard - measure that drive performance. Harvard
Business Review, 70(1), 71–79.
Kibum, K., Jeong, B., & Jung, H. (2014). Supply chain surplus: Comparing conventional and sustainable supply chains. Flexible Services and Manufacturing Journal, 26(1-2), 5–23. http://doi.org/10.1007/s10696-012-9163-2
Krejcie, R. V, & Morgan, D. W. (1970). Determining Sample Size for Research activities. Educational and
Psychological Measurement, 38, 607–610.
Kumar, K. (2001). Technology for supporting supply chain management: An introduction. Communications of
the ACM, 44(6), 58–61. http://doi.org/10.1145/376134.376165
Larson, P. D., & Halldorsson, A. (2002). What is SCM? And, where is it? Journal of Supply Chain Management, 38(4), 36–44.
Linton, J. D., Klassen, R., & Jayaraman, V. (2007). Sustainable supply chains: An introduction. Journal of
Operations Management, 25(6), 1075–1082. http://doi.org/10.1016/j.jom.2007.01.012
Macharia, J., Collins, R., & Sun, T. (2013). Value-based consumer segmentation: the key to sustainable agri-food chains. British Food Journal, 115(9), 1313–1328. http://doi.org/10.1108/BFJ-09-2011-0215
Madhani, P. M. (2009). Resource Based View (RBV) of Competitive Advantages: Importance, Issues and Implications. KHOJ Journal of Indian Management Research and Practices, 1(2), 53–59.
Magutu, P. O., Aduda, J., & Nyaoga, R. B. (2015). Does Supply Chain Technology Moderate the Relationship between Supply Chain Strategies and Firm Performance? Evidence from Large-Scale Manufacturing Firms in Kenya. International Strategic Management Review, 3(1-2), 43–65. http://doi.org/10.1016/j.ism.2015.07.002
Midia, H., Sarkara, S. K., & Ranaa, S. (2010). Collinearity diagnostics of binary logistic regression model.
Journal of Interdisciplinary Mathematics, 13(3), 253–267. http://doi.org/10.1080/09720502.2010.10700699
Mitchell, J., Coles, C., & Keane, J. (2009). Trading up: How a value chain approach can benefit the rural poor.
COPLA Global: ODI.
Newbert, S. L. (2008). Value, Rareness, Competitive Advantage, and Performance: A Conceptual-level Empirical Investigation of the Resource-Based View of the Firm. Strategic Management Journal, 29, 745– 768. http://doi.org/10.1002/smj
Nyaoga, R. B., Wang, M., & Magutu, P. O. (2015a). Does Capacity Utilization Mediate the Relationship between Operations Constraint Management and Value Chain Performance of Tea Processing Firms? Evidence from Kenya. International Strategic Management Review, 3(1-2), 81–95. http://doi.org/10.1016/j.ism.2015.06.001 Nyaoga, R. B., Wang, M., & Magutu, P. O. (2015b). Testing the relationship between constraints management and capacity utilization of tea processing firms: Evidence from Kenya. Future Business Journal, 1(1-2), 35– 50. http://doi.org/10.1016/j.fbj.2015.10.001
Paloviita, A. (2010). Consumers’ sustainability perceptions of the supply chain of locally produced food.
Sustainability, 2(6), 1492–1509. http://doi.org/10.3390/su2061492
Peterson, M. W., & White, T. H. (1992). Faculty and administrator perceptions of their environments: Different views or different models of organization? Research in Higher Education, 33(2), 177–204. http://doi.org/10.1007/BF00973578
Porter, M. E. (1990). The Competitive Advantage of Nations. (cover story). Harvard Business Review, 68, 73– 93. http://doi.org/Article
Purcell, J., Kinnie, N., Swart, J., Rayton, B., & Hutchinson, S. (2009). People management and performance (New ed). Routledge.
Rahman, S. (1998). Theory of Constraints: A review of the philosophy and its applications. International Journal
of Operations & Production Management, 18(4), 336–355.
Rapport, A. (1997). Creating Shareholder Value: A Guide for Managers and Investors (Rev Sub ed). Free Press. Rosen, M. A., & Kishawy, H. A. (2012). Sustainable manufacturing and design: Concepts, practices and needs.
Sustainability, 4(2), 154–174. http://doi.org/10.3390/su4020154
Ruben, R., Slingerland, M., & Nijhoff, H. (2006). Agro-food chains and networks for development: issues, approaches and strategies. Frontis, 14 VN - r, 1–25.
442
Shepherd, C., & Günter, H. (2006). Measuring supply chain performance: current research and future directions.
International Journal of Productivity and Performance Management, 55(3/4), 242–258.
http://doi.org/10.1108/17410400610653219
Sillanpaa, I. (2011). Supply chain performance measurement in the manufacturing industry A single case study
research to develop a supply chain performance measurement framework.
Simatupang, T. M., Wright, A. C., & Sridharan, R. (2004). Applying the theory of constraints to supply chain collaboration. Supply Chain Management: An International Journal, 9(1), 57–70. http://doi.org/10.1108/13598540410517584
Stiles, J. (2003). A philosophical justification for a realist approach to strategic alliance research. Qualitative
Market Research: An International Journal, 6(4), 263–271. http://doi.org/10.1108/13522750310495346
Trienekens, J. H., Wognum, P. M., Beulens, a. J. M., & Van Der Vorst, J. G. a J. (2012). Transparency in complex dynamic food supply chains. Advanced Engineering Informatics, 26(1), 55–65. http://doi.org/10.1016/j.aei.2011.07.007
Tulasi, C. L., & Rao, A. R. (2012). Review on Theory of Constraints. International Journal of Advances in
Engineering & Technology, 3(1), 334–344.
Umma, S. (2006). Research methods for business (4th ed.). Wiley India Pvt.
Vasileiou, K., & Morris, J. (2006). The sustainability of the supply chain for fresh potatoes in Britain. Supply
Chain Management: An International Journal, 11(4), 317–327. http://doi.org/10.1108/13598540610671761
Waldron, M. W. (1994). Management and supervision in D. Blackburn (Ed.), Extension handbook: Processes
and practices. Toronto: Thompson Educational.
Weng, H.-H., Chen, J.-S., & Chen, P.-C. (2015). Effects of Green Innovation on Environmental and Corporate Performance: A Stakeholder Perspective. Sustainability, 7(5), 4997–5026. http://doi.org/10.3390/su7054997 www.teaboard.or.ke. (n.d.).
www.tearesearch.or.ke. (n.d.).
Yilmaz, Y., & Bititci, U. (2006). Performance measurement in the value chain: manufacturing v. tourism.
International Journal of Productivity and Performance Management, 55(5), 371–389.
http://doi.org/10.1108/17410400610671417
Zsidisin, G. A., & Hartley, J. L. (2012). Managing Commodity Price Risk: A Supply Chain Perspective. (S. Nahmias, Ed.) (Kindle). New York: Business Expert Press. http://doi.org/10.4128/9781606492635