Quality of labeling on dispensed medicines
and associated factors among public health
care facilities in Bahir dar city, Northwest
Ethiopia
Wubante Demilew Nigussie1*
B.Pharm, MPH, A/lectuter
,
1
Tell: +25118022750, Email: wubdemt@gmail.com
Department of pharmacy, Bahir Dar Health Science College, Bahir Dar, Ethiopia
Wondemagegn Mulu Lingerew2
BSc/MLT,MSc/medical microbiologist, Lectutrer
,
2
Tel: +2518706921, Email: Wondem_32@yahoo.com
Department of Medical Microbiology, Bahir Dar University, College of Medicine and Health Sciences
ABSTRACT
Purpose: To determine the quality of labeling on dispensed medicines and identify the associated factors among public health facilities in Bahir Dar city.
Methods: A cross sectional study was conducted from August 5 to 20, 2013 at selected health care facilities in Bahir Dar city. Simple random sampling and systematic random sampling techniques was used to select health facilities and dispensing encounters respectively. Data was collected from non participatory observations of the drug dispensing process using check list. Data was entered into EPI Info (version 3.5.2) and analyzed using SPSS version 16. Bivariate and multivariate regression analysis was computed to test the strength of association and level of significance. P-value <0.05 was considered as statistical significant.
Results: A total of 400 dispensing encounters and 636 drugs dispensed were observed in eight (8) outpatient pharmacies. The percentage of drugs adequately labeled was 32.2%. Drugs adequate labeling score was higher in private health facilities (39.3%) compared to government health facilities (25.83%). The name, strength and dosage form of the drugs were labeled in 95.6%, 90% and 85.8% respectively. Differences in dispenser work experiences (AOR = 2.99, CI: 1.67 – 5.37), average dispensing time (AOR = 6.22, CI: 3.08-12.57), average consultation time (AOR=3.42, CI: 1.64-7.13), level of health facility (AOR = 4.31, CI 1.94 – 9.59) and type of health facilities (AOR = 4.29, CI 1.72 – 10.66) were found to be independently associated factors for quality of labeling score.
Conclusion: The quality of labeling on dispensed medicines was not adequate. Dispenser work experiences, average dispensing time, average consultation time, level of health facility and type of health facilities were found to be significant factors for quality of labeling score. Therefore, attention should be given to strong skill development, increasing manpower and implementation of regular monitoring for the application of dispensing ethics.
Key words: Quality of labeling, Dispensed medicines, associated factors, Health care facilities, Bahir Dar City. 1. Introduction
Adequate labeling is the process of writing name of the drug, unit dose, frequency of administration and volume (total quantity) and duration of treatment on dispensed medicine envelop/packages. Failure to write/label any one of the five attributes was recorded as inadequate labeling [1, 2].
The quality of labeling is used to measure the extent to which dispensers’ are able to record essential information on the drug packages they dispense. Drugs dispensed to patients must be adequately labeled to comply with legal and professional requirements to give detailed and precise information both to the patient and the dispenser in order to avoid medication errors [1, 2, 3, 4].
One of the essential prerequisites for patient compliance is adequate labeling of the medicines dispensed to clients. In the measurement of labeling of dispensed medicines, researchers generally focus on the name and purposes of the medication, the dose, frequency of dosing, duration of treatment and sometimes side effecting because, these elements are viewed as essential for safe and appropriate use but in practice this parameter is overlooked. The main functions of label on dispensed drug are to uniquely identify the content of container and to ensure that the patients have clear and concise information about the use of their drug/medicines. Adequate labeling must include the name, strength and dosage form of the preparation, instructions for use to the patient, expiry date, date of dispensing and name and address of the pharmacy [2, 3].
The label on dispensed medicines should provide the patient with all the information necessary so that the medication can be taken or used appropriately, as result therapeutic effectiveness of the drug will be improved and toxicity and adverse drug reaction will be reduced. Generally, irrational drug use and poor dispensing practices are numerous and complex involving the health system, prescriber, dispenser, patient and the community. Due to such worsened condition, it is now felt that the overall drug use situation needs to be assessed, problems identified and remedial intervention strategies to be implemented so as to check dangerous trends in drug utilization in Ethiopia [1, 6].
Ethical dispensing of drugs and medicinal products with adequate labeling and drug information is an integral component of rational drug therapy. Nevertheless, this essential health issue apparently has a large commercial aspect. It is evident that medication errors in dispensing and delivery had increased the harmful potentials of a drug in the health care facilities [7, 8].
Ethiopia adopted a list of Essential Drugs in 1987 as part of National Drug Policy in order to undertake the above pharmaceutical problems. Nevertheless, there are still irrational drug use such as irrational prescribing, irrational dispensing and inappropriate use of drug by patients [5, 9, 10]. In Ethiopia, few studies were conducted but no study has been found in the target area. Therefore, this study was aimed to assess the quality of labeling and associated factors so as to initiate intervention by the concerned authorities.
2. Methods and Materials
Study area
The study was conducted among health care facilities of Bahir Dar City, North west Ethiopia. Bahir Dar is the capital city of Amhara National Regional state. It is situated 565 kms from Addis Ababa. Bahir Dar is a special Zone which has 17 kebeles. The population is 239, 721 projected from 2007 census. Public health facilities in the City are one Governmental Referral Hospital, 2 private hospitals, 10 health centers, 22 private clinics (3 higher private clinics, 7 special private clinics and 12 private medium clinics), 14 pharmacies, 32 drug shops and 8 rural drug venders [17]. The health care facilities selected for this study were Felegehiwot Referral Hospital, Han health center, Bahir Dar Health Center, Abay Health Center, Gamby Teaching General Hospital, Kidane mihiret, Adinas and Alemsaga Higher Clinics. The study was conducted in the outpatient pharmacies of the above selected health facilities.
Study design and period
A cross sectional study was conducted from August 5 to 20/2013among eight randomly selected health care facilities of Bahir Dar City, North West Ethiopia.
Sampling technique and procedure
The sample size was determined using single population proportion formula. By taking 20% prevalence of adequate labeling on dispensed medicines in Ethiopia [18], 95% confidence level and 5% maximum tolerable error. Considering non-response rate of 10% and design effect of 1.5, a final sample size of 406 dispensing encounters was included.
Accordingly, from all health care facilities one governmental & one private hospital, three private higher clinics and three health centers were selected. The sample size was then distributed to each health care facility proportionate to their population size. Systematic sampling technique was used to select a sample of 406 dispensations from selected health care facilities outpatient pharmacy dispensary (OPD). Accordingly, observation of dispensing process was carried out. Structured observation checklist adopted from WHO was used to collect the data.
Ethical consideration
Ethical clearance was obtained from ethics review committee of Amhara national regional state health bureau. Oral consent was taken from the dispensers and detailed explanation was given to dispensers for the purpose of the study.
Operational definition and Calculation of scores
Dispensing encounter: is a face-to-face contact between a user (client) and dispenser who exercises independent judgment in the provision of services to the individual.
Labeling: is labeling of name of the drug, unit dose, frequency of administration and volume (total quantity) and duration of treatment on dispensed medicine envelop/packages
Adequate labeling: Those labeling which fulfill all the five labeling quality attributes was considered as adequate and scored as 1.
Inadequate labeling: Failure to write/label any one of the five attributes was recorded as inadequate labeling and scored as 0.
Percentage of labeling was calculated by adding the number of drugs adequately labeled for each patient and divided to the total number of drugs dispensed. The quality of labeling was recorded by assigning a score to each of five essential dispensing quality attributes: name of the drug, strength, unit dose, frequency of administration and volume (total quantity) of the drug dispensed.
Adequate labeling was given a score of 1 per attribute and inadequate or no labeling was scored 0, and the total dispensing score for each drug was calculated (maximum total score of 5 per drug dispensed). Failure to write/label any one of the five attributes was recorded as inadequate labeling and scored as 0 whereas adequate labeling scored as 1.
Data management and analysis
Data were coded, entered into EPI Info (Epidemiological information. version 3.5.2) and analyzed using SPSS (version 16.0). Descriptive statistics were used to express labeling score and other variables
Bivariate analysis was computed to test whether there is association between dependent variables and independent variables. Factors associated with quality of labeling at bivariate analysis were identified and the variables with p-value of 0.2 and less were taken to multivariate analysis and the model was built with backward stepwise elimination (backward LR). Finally, P-value < 0.05 was considered as statistically significant.
3. Results
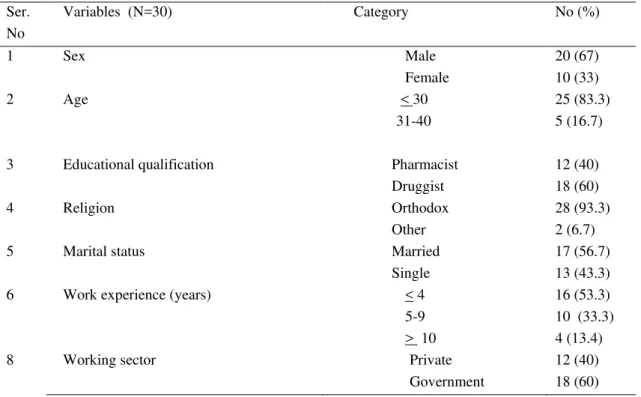
Socio demographic Characteristics of dispensers
Table1: Socio-demographic characteristics of drug dispensers among health care facilities of Bahir Dar City, North West Ethiopia, 2013.
Ser. No
Variables (N=30) Category No (%)
1 Sex Male
Female
20 (67) 10 (33)
2 Age <
31-40
30 25 (83.3)
5 (16.7)
3 Educational qualification Pharmacist
Druggist
12 (40) 18 (60)
4 Religion Orthodox
Other
28 (93.3) 2 (6.7)
5 Marital status Married
Single
17 (56.7) 13 (43.3)
6 Work experience (years) < 4
5-9 >
16 (53.3)
10
10 (33.3) 4 (13.4)
8 Working sector Private
Government
12 (40) 18 (60)
Labeling score
The overall percentage of drugs adequately labeled was 32.2%. The highest percentage of drugs adequately labeled was found in Adinas higher clinic (44.1%) followed by Alemsaga (43.1%) and Kidanemihiret higher clinic (42.4%). The least adequate labeling score was found in Abay health center (17.1%) [Table 2].
Table 2: Distribution of labeling score among health facilities of Bahir Dar City, North West Ethiopia, 2013
No Heath facility
Quality of labeling score
Total number of drugs dispensed Adequate
No (%)
Inadequate No (%)
1 Felegehiwot referal hospital 34 (20.5) 132 (79.5) 166 2 Bahir dar health center 22 (35.5) 40 (64.5) 62
3 Han health center 24 (34.3) 46 (65.7) 70
4 Abay health center 6 (17.1) 29 (82.9) 35
5 Adinas higher clinic 30 (44.1) 38 (55.9) 68
6 Alemsaga higher clinic 31 (43.1) 41 (56.9) 72
7 Kinaemihiret higher clinic 28 (42.4) 38 (57.6) 66 8 Gamby teaching general hospital 30 (30.9) 67 (69.1) 97 Overall labeling score 205 (32.2) 431 (67.8) 636
Adequate labeling score was 38.7% and 31.9% among male & female dispensers respectively. The percentage of adequate labeling score was higher (43.5%) for pharmacists compared to druggists (28.3%). Moreover, adequate labeling score was higher among dispensers who got short term training (39%) compared to those who did not take short term training (31.8%). The labeling score was higher among dispensers working in private health institutions (46.4%) compared to governmental health facilities (26.7%).
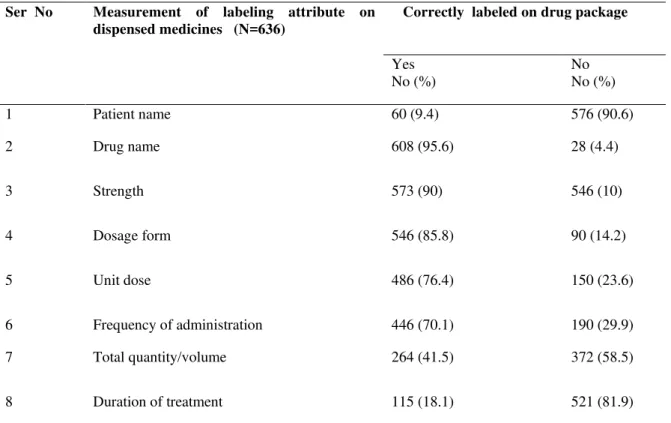
Table 3: Labeling pattern of drugs dispensed among selected health care facilities in Bahir Dar City, 2013
Drugs adequate labeling score was higher in private health facilities (39.3%) compared to government health facilities (25.83%) [Figure1]. Adequately drug labeling practice was higher among private higher clinics (43.2%) and the least adequate labeling practice was found in government hospital (20.5%) [Figure 2].
Figure 1: Adequacy of labeling according to the type of public health care facilities, 2013 39.3
25.83
0 5 10 15 20 25 30 35 40 45
Private Government
L
ab
el
in
g
scor
e (
%
)
Type of health facilities
Ser No Measurement of labeling attribute on dispensed medicines (N=636)
Correctly labeled on drug package
Yes No (%)
No No (%)
1 Patient name 60 (9.4) 576 (90.6)
2 Drug name 608 (95.6) 28 (4.4)
3 Strength 573 (90) 546 (10)
4 Dosage form 546 (85.8) 90 (14.2)
5 Unit dose 486 (76.4) 150 (23.6)
6 Frequency of administration 446 (70.1) 190 (29.9)
7 Total quantity/volume 264 (41.5) 372 (58.5)
Figure 2: Adequacy of labeling by level of public health care facilities, 2013
Quality of labeling and associated factors
Differences in dispenser work experiences, type and level of health facility, average dispensing and consultation time were found to be statistically significant predictors for quality of labeling. On multivariate analysis, those dispensers who had experience of five to nine years were two times more likely to achieve better labeling score compared to dispensers who had four and less years of experiences (AOR = 2.99, CI: 1.67 – 5.37). However, reduced labeling score was found among dispensers who had above ten (10) years of experience. Moreover, average dispensing time and consultation time were found to be statistically significant with quality of labeling. The dispensing encounters which spent on average more than 30 seconds for consultation were three times more likely to have better labeling score compared to those encounters which spent 30 and less seconds on client consultation (AOR=3.42, CI:1.64-7.13). Those dispensing encounters which spent more dispensing time was six times more likely to improve labeling score compared to those encounters which spent less dispensing time (AOR = 6.22, CI: 3.08-12.57).
Private health facility had the highest proportion of performing better labeling when compared to government health facility (AOR = 4.29, CI 1.72 – 10.66). Moreover, Health centers were four times more likely to have better labeling score as compared to the hospitals (AOR = 4.31, CI 1.94 – 9.59). However, statistically significant association was not found between differences in qualification, trained on short term training, work load and gender with labeling score[Table 5].
20.5
31.14 30.93
43.2
0 5 10 15 20 25 30 35 40 45 50
Government hospital Government health centers
Private hospital Private higher clinics
La
b
e
li
n
g
s
co
re
(%)
Level of health facilities
Table 5: Logistic regression analysis of factors independently associated with labeling score among health care facilities of Bahir Dar City, North west Ethiopia, August, 2013.
* Statistically significant at P< 0.05. & ** Statistically significant at P<0.001
4. Discussion
Adequate labeling of dispensed medicines influences the patient’s compliance and thereby therapeutic success or failure. It is the primary responsibility of the pharmacy professional to assure the quality of labeling for dispensed medicines. Therefore, the quality of labeling is used to measure the degree to which dispensers’ record essential information on the drug packages they dispense [1, 2].
The present study revealed that on average 205 (32.2%) of dispensed drugs were adequately labeled which was better than the national study (19.95%), studies done in Gondar (8.47%), Pakistan (6%) and India (18.5%) [1, 11, 12, 16]. However, the present finding was lower as compared to studies done in South West Ethiopia, Botswana and Turkey where 70.05%, 55% and 43% was reported respectively [6, 13, 15]. World Health Organization's drug use indictors stated that the percentage of adequate labeling on dispensed medicines should be 100 [1 & 2]. However, in the current study the quality of labeling is still very low compared to the optimal Variables Labeling score per
dispensing encounter
OR (95%CI)
Adequate Inadequate COR AOR Dispenser educational qualification
Pharmacist Druggist Dispenser work experiences < 4 5-9 >10 91 54 46 58 41 118 137 125 92 38 1.96 (1.29-2.97) 1 1 1.65 (1.03-2.64) 2.87(1.65-4.99) 1.63(0.92-2.90) 1 1 2.99 (1.67-5.37)** 1.59 (0.79-3.20) Type of health facility
Government Private 55 90 151 104 1 2.38 (1.56-3.61) 1 4.29(1.72-10.66)** Level of health facility
Hospital Health center Higher clinics 43 33 69 122 64 69 1 1.46 (0.85-2.52) 2.84 (1.75-4.59) 1 4.31(1.94-9.59)** 1.65 (0.79-3.44) No of drugs dispensed per patient
One drug Two drugs Three drugs 77 56 12 121 112 22 1.167 (0.546-2.493) 0.917 (0.423-1.986) 1 2.16(0.87-5.34) 1.82(0.73-4.52) 1 Average consultation time
< 30 seconds 31-60 seconds >60 seconds 35 76 34 111 110 34 1 2.19(1.36-3.54) 3.17(1.73-5.83) 1 2.58 (1.47-4.52)** 3.42(1.64-7.13)** Average dispensing time
< 5 minute 5-9 minute >9 minute 31 65 49 93 125 37 1 1.58 (0.96-2.62) 3.89 (2.16-7.03) 1 2.69(1.49-4.86)** 6.22(3.08-12.57)** Training of dispensers
value. The probable reason for this difference might be due to over- load of patient at dispensary and shortage of man power for dispensing, lack of labeling materials, dispensers' failure to adhere good dispensing standards, manuals and code of ethics for labeling practices.
According to the level of health facilities the average percentages of drugs adequately labeled were higher at health centers (31.14%) compared to hospitals (20.5%). This finding is supported by the national survey in Ethiopia which revealed that 53% and 59.7% of adequate labeling for hospitals and health centers respectively [10]. The probable reason for this difference between hospitals and health centers might be due to health centers have relatively lower patient load at the dispensary, so that dispensers have adequate time for labeling compared to hospitals.
Regarding the type of health facilities based on ownership, the percentage of adequate labeling was higher in private facilities (39.3%) compared to government health facilities (25.83%). This might be due to private health facilities are more concerned on client attraction to promote and improve their market value.
Experiences of dispensers was found to be a statistically significant predictor variable for quality of labeling. Those dispensers who work five to nine years were two times more likely to achieve better labeling score compared to dispensers who had four and less years of experiences. The finding of this study was consistent with a study done in South West Ethiopia, Turkey and Botswana [6, 13, 15].
In the present study, differences in average dispensing time were found to be statistically significant predictors for quality of labeling. The dispensing encounters which spent on average more than five (5) minutes were six times more likely to have better labeling score compare to those encounters which spent one up to three (1-3) minutes. This was comparable with the national study, a study done in South West Ethiopia and Gondar University hospital [6, 10, 16].
Moreover, private health facilities were four times more likely to practice quality of labeling compared to government health facilities. The reason for this difference might be explained by the fact that dispensers in private health facilities often spend most of time in communicating clients to increase clients trust towards their health institution in order to promote their services and assuring continuity of care and enhances accountability for market value. The finding of this study was in line with a study done in Turkey, Kenya and Botswana [13, 14, 15]. According to the level of health facility, Health centers were four times more likely to have good labeling score as compared to the hospital. The variation may be due to high client flow and heavy work load of dispensers at hospitals compared to health centers and higher clinics. This finding was similar with a study done in Turkey, Kenya and Botswana [13, 14, 15].
The average dispensing time, average consultation time for clients about dispensed medicines and dispenser work experience were found to be significant predictors of the quality of labeling score which was consistent with a study done in Pakistan, Turkey and Botswana [12, 13 & 15].
5. Limitations of the study
The main limitation of this study was the risk of observer bias. However, observer bias was tried to minimize by the visits of the team being unannounced, and during the consultations and dispensing there was no interference by the survey team workers. In addition, the study was cross sectional and thus the seasonal variation was not evaluated. Finally, some of the health facilities may have heard rumors about the ongoing survey, anticipating a possible visit by the researcher and data collectors. This might be resulted in a more favorable outcome than otherwise would have been the case.
6. Conclusion
The findings of this study showed that the quality of labeling was found to be inadequate and very far low compared to WHO standards. The overall picture of adequacy of labeling among these facilities OPD pharmacy are not yet at the optimal level. Health centers were found to be better labeling score than hospitals. The performance of Government health facilities on the quality of labeling was lower than private health facilities. According to this study, dispenser work experiences, type of health facility, Level of health facility, average dispensing time and average consultation time were found to be statistically significant predictor variables of quality of labeling.
Authors’ contribution
WD: conceptualized the research problem, designed the study, prepared the proposal, conducted field work, collected data, analyzed the data and drafted the manuscript for publication.
WM: revised the proposal, revised the report and involved in preparation of the manuscript Computing Interests: The authors declare that they have no any competing interests 8. References
[1] FMHACA/Ethiopia. Manual for Medicines Good Dispensing Practice; Second Edition May, 2012.
[2] WHO. How to investigate drug use in health facilities: Selected drug use indicators. WHO/DAP/93.1:1-97 Geneva; 1993.
[3] Bashrahil A. Indicators for rational drug use and health services in Hadramout, Yemen. Eastern Mediterr H J, 2012; 16 (2): 151-155.
[4] WHO. Operational package for assessing, monitoring and evaluating country pharmaceutical situations: Guide for coordinators and
data collectors. WHO/TCM/07.2, Geneva, 2007.
[5] WHO. Promoting Rational Use of Drugs. Core components. World Health Organization, Geneva, 2002.
[6] Mulugeta T, Nasir T, Wabe N, et al. Assessment of Patterns of Drug use by using World Health Organization’s Prescribing, Patient
Care and Health facility indicators in Selected Health Facilities in Southwest Ethiopia. Journal of Applied Pharmaceutical Science,2011; 01 (07) : 62-66
[7] Abula T, Worku A, Thomas K. Assessment of the dispensing practices of drug retail outlets in selected towns, North West Ethiopia.
Ethiop Med J, 2006; 44(2):145-150.
[8] Lukshmy M, Amarasinghe I, Jayarathna K, et al. A Prospective encounter study of the degree of adherence to patient care indicators
related to drug dispensing in Health Care facilities. J Pharm Bioallied Sci, 2011; 3(2): 298–301.
[9] DACA (Ethiopia). List of essential drugs for Ethiopia (LIDE), 3rd edition, 2007
[10] MOH. Assessment of the pharmaceutical sectors in Ethiopia, Addis Ababa, 2003.
[11] Karande S, Sankhe P, Kulkarni M. Patterns of prescription and drug dispensing. Indian Journal Pediatr, 2005; 72(2):117-21.
Available at: http://www.ncbi.nlm.nih.gov/pubmed. Date accessed: January12, 2012.
[12] Hussain A, Ibrahim MI . Medication counseling and dispensing practices at community pharmacies: a comparative cross sectional
study from Pakistan. International Journal of Clinical Pharmacy, 2011; 33(5):859-867.
[13] Hale Z, Toklu, Sezen F, et al. The pharmacy practice of community pharmacists in Turkey. Marmara Pharmaceutical Journal,
2010;14: 53-60.
[14] Andria R, Nathan S, Diana M et al. Does anti-malarial drug knowledge predict anti-malarial dispensing practice in drug outlets? A
survey of medicine retailers in western Kenya. Malaria Journal, 2012; 11:263.
[15] Boonstra E, Lindbaek M, Ngome E, et al. Labeling and patient knowledge of dispensed drugs as quality indicators in primary care in
Botswana. Qual Saf Health Care, 2003; 12:168–175.
[16] Admassie E, Begashaw B, and Hailu W. Assessment of drug use practices and completeness of prescriptions in Gondar University
Teaching Referral Hospital. IJPSR, 2013; 4(1): 265-275.
[17] Central Statistical Agency (CSA). The 2007 Population and Housing Census of Ethiopia: Statistical Summary Report at National
Level. Addis Ababa, Ethiopia, 2008.