Wave of Influenza A(H1N1)pdm09 Virus in South Africa
Brett N. Archer1, Stefano Tempia2, Laura F. White3, Marcello Pagano4, Cheryl Cohen1,5*
1National Institute for Communicable Diseases (NICD), National Health Laboratory Service (NHLS), Johannesburg, Gauteng, South Africa,2United States Centers for Disease Control and Prevention, Attache´ to the National Institute for Communicable Diseases (NICD), National Health Laboratory Service (NHLS), Johannesburg, Gauteng, South Africa,3Department of Biostatistics, School of Public Health, Boston University, Boston, Massachusetts, United States of America,4School of Public Health, Harvard University, Cambridge, Massachusetts, United States of America,5School of Public Health, University of Witwatersrand, Johannesburg, Gauteng, South Africa
Abstract
Background/Objective: Describing transmissibility parameters of past pandemics from diverse geographic sites remains critical to planning responses to future outbreaks. We characterize the transmissibility of influenza A(H1N1)pdm09 (hereafter pH1N1) in South Africa during 2009 by estimating the serial interval (SI), the initial effective reproductive number (initialRt) and the temporal variation ofRt.
Methods:We make use of data from a central registry of all pH1N1 laboratory-confirmed cases detected throughout South Africa. Whenever date of symptom onset is missing, we estimate it from the date of specimen collection using a multiple imputation approach repeated 100 times for each missing value. We apply a likelihood-based method (method 1) for simultaneous estimation of initialRtand the SI; estimate initialRtfrom SI distributions established from prior field studies (method 2); and the Wallinga and Teunis method (method 3) to model the temporal variation ofRt.
Results:12,360 confirmed pH1N1 cases were reported in the central registry. During the period of exponential growth of the epidemic (June 21 to August 3, 2009), we simultaneously estimate a meanRtof 1.47 (95% CI: 1.30–1.72) and mean SI of 2.78 days (95% CI: 1.80–3.75) (method 1). Field studies found a mean SI of 2.3 days between primary cases and laboratory-confirmed secondary cases, and 2.7 days when considering both suspected and laboratory-confirmed secondary cases. Incorporating the SI estimate from field studies using laboratory-confirmed cases, we found an initial Rt of 1.43 (95% CI: 1.38–1.49) (method 2). The meanRt peaked at 2.91 (95% CI: 0.85–2.91) on June 21, as the epidemic commenced, andRt.1 was sustained until August 22 (method 3).
Conclusions:Transmissibility characteristics of pH1N1 in South Africa are similar to estimates reported by countries outside of Africa. Estimations using the likelihood-based method are in agreement with field findings.
Citation:Archer BN, Tempia S, White LF, Pagano M, Cohen C (2012) Reproductive Number and Serial Interval of the First Wave of Influenza A(H1N1)pdm09 Virus in South Africa. PLoS ONE 7(11): e49482. doi:10.1371/journal.pone.0049482
Editor:Benjamin J. Cowling, University of Hong Kong, Hong Kong
ReceivedJune 11, 2012;AcceptedOctober 9, 2012;PublishedNovember 16, 2012
Copyright:ß2012 Archer et al. This is an open-access article distributed under the terms of the Creative Commons Attribution License, which permits unrestricted use, distribution, and reproduction in any medium, provided the original author and source are credited.
Funding:This work was partly supported by the National Institute for Communicable Diseases (NICD), a division of the National Health Laboratory Service (NHLS). Laboratory testing and influenza surveillance activities at the NICD are funded, in part, by an unrestricted grant from the United States Centers for Disease Control and Prevention (CDC) [grant number 5U51/IP000155]. Dr. White and Dr. Pagano were supported by the National Institute of General Medical Sciences (NIGMS) [award number U54GM088558]. The content is solely the responsibility of the authors and does not necessarily represent the official views of the NICD, NHLS, US CDC, NIGMS, NIH or the affiliated universities. The funders had no role in study design, data collection and analysis, decision to publish, or preparation of the manuscript.
Competing Interests:The authors have declared that no competing interests exist.
* E-mail: [email protected]
Introduction
During 2009, the emergence and worldwide spread of influenza A(H1N1)pdm09 (pH1N1) was observed [1]. While a rapid and timely estimation of the transmission parameters of this novel virus played an important role in informing transmission potential and mitigation interventions during the 2009 pandemic period, the post-pandemic documentation of these parameters is equally important as many previous estimates were established from analyses conducted during the early stages of epidemics and often from preliminary data [2,3]. Additionally enhancing our knowl-edge of past pandemics assists in providing greater insight to prepare and respond in future outbreaks.
Four key measures are typically used to describe the trans-missibility of an infectious disease. First, the serial interval (SI) describes the mean time between illness onset of two successive cases in the chain of transmission. Second, the secondary attack rate (SAR) describes the proportion of susceptible contacts that acquire infection from an infectious person. Third, the basic reproductive number (R0) is defined as the average number of
secondary cases per primary case in an idealised entirely susceptible population in the absence of control measures. Finally, the effective reproductive number (Rt) at any given time point
represents the actual average number of secondary cases per primary case observed in a population.Rt reflects the impact of
time. The initialRtmay approximateR0in pandemic situations.
[2–5].
Previously published estimates of pH1N1 transmission param-eters vary by study setting and methods employed. The majority of studies found the mean SI of pH1N1 to range from 2.5–3.3 days [2,6–11]; however, Canada and Texas reported a longer SI of 4–5 days, respectively [12,13]. Estimates of the R0 of pandemic influenza from the USA range from 1.3–2.3 [2,9,11]. Estimates from Mexico range from 1.4–2.9 [2,14,15]. Outside of North America,R0estimates include: Australia (mean 2.4) [16], Canada
(mean 2.62) [12], Thailand (mean 2.07) [17], Peru (range 1.2–1.7) [18] and New Zealand (mean 1.96) [19]. Finally, Japan revised their meanR0estimates from 2.3 to 1.28 after repeating analyses
later in the pandemic [20]; thus demonstrating a need to revisit revised and more complete datasets. A variation in Rt with
progression of the pandemic was observed in Mexico, averaging at 1.47 (based on a negative binomial model) [14], but peaking between 2.1–4.0 depending on the generation interval chosen [21].
In a previous work, we estimated the SAR and SI of pH1N1 among the first 100 cases detected in South Africa by prospectively examining virus transmission between household contacts [22]. We found a SAR of 10% and a mean SI of 2.3 days (SD61.3, range 1–5) between successive laboratory-confirmed cases in the transmission chain. When additionally including suspected secondary cases into the analysis, the SAR increased to 17% and the SI to 2.7 days (SD61.5, range 1–6). In this work we incorporate data collected on all laboratory-confirmed cases detected during the 2009 pH1N1 epidemic in South Africa with the aim of describing the transmissibility characteristics (initialRt
and temporal variation ofRt) of the epidemic in the country and
compare its dynamics with those observed in other countries in the same year.
Methods
Data
During 2009, the National Institute for Communicable Diseases (NICD), of the National Health Laboratory Service (NHLS), South Africa, maintained a central registry of all pH1N1 laboratory-confirmed cases detected throughout the country. The methodology of collating this data has previously been described in detail [23]. Briefly, we collated individual case-based data from all laboratories offering pH1N1 testing throughout South Africa, which included patient age, sex, dates of illness onset and specimen collection, and the administrative location (province) of the healthcare facility where the patient presented. Testing was performed by accredited laboratories, including: the National Influenza Centre (NICD-NHLS), NHLS public-sector laboratories or private-sector laboratories. All testing laboratories performed detection and characterisation of pH1N1 virus by real-time PCR by either the protocol developed by the WHO Collaborating Centre for Influenza, U.S. Centers for Disease Control and Prevention [24], or using commercially available kits.
Imputation of Missing Data
Wherever the date of symptom onset was missing, we estimated it from the date of specimen collection using a multiple imputation approach. Firstly, we modelled the lag time from date of symptoms onset to date of specimens collection from cases with complete data via a Poisson regression model using predictors significant at p,0.05. The covariates assessed in the model were patient age, gender, province, date of specimen collection, and collection of a specimen on a weekend day (i.e. Saturday or Sunday). Secondly
we obtained an estimated lag-time for each observation with missing date of symptoms onset using a random sampling process from a Poisson distribution centred on the predicted value from the Poisson regression model. A Poisson distribution was selected to model count data. Thirdly we imputed missing dates of symptoms onset by subtracting the estimated lag-time from the date of specimen collection. The imputation process was repeated 100 times for each missing value, creating 100 datasets with information on the onset date (imputed or observed) for 12,630 laboratory-confirmed cases.
Estimation of IntialRt and Temporal Variation inRt We based the estimation of initialRtand temporal variation of Rt on date of symptoms onset (observed and imputed). In all
analyses we modelled the SI via a multinomial distribution. When estimating initial Rt, we focus our analysis on the exponential
growth phase of the epidemic in South Africa (i.e. the period from the first occurrence of five consecutive days with confirmed cases reported to the epidemic peak). The parameters were estimated using three methods:
Method 1. We make use of the likelihood-based method for
the simultaneous estimation of initialRt and the SI described by
White and Pagano (2008) [25]. This method is well suited for estimation of initial Rt and SI in real-time with observed
aggregated daily counts of new cases, denoted by N = (N0, N1…,NT) whereTis the last day of observation and N0are the
initial number of seed cases that begin the outbreak. TheNiare
assumed to be composed of a mixture of cases that were generated by the previouskdays, wherekis the maximal value of the serial interval. We denote these asXj, the number of cases that appear
on dayithat were infected by individuals with onset of symptoms on dayj. We assume that the number of infectees generated by infectors with symptoms on day j follows a Poisson distribution with parameterRtNj. Additionally,Xj=(Xj,j+1,Xj,j+2…,Xj,j+k+1), the
vector of cases infected by theNjindividuals, follows a multinomial
distribution with parameters p, k and Xj. Here pis a vector of
probabilities that denotes the serial interval distribution. Using these assumptions, the following likelihood is obtained:
L(Rt,pDN)~
aT
i~1
exp (mi)miNi
Ni! ,
wheremi~Rt(Pkj~1pjNi{j).
Parameter estimates are obtained using maximum likelihood methods. For this method we used 6 days as the maximal value of the SI (k), which is consistent with the length of the SI observed in field investigations in South Africa [22]. In addition we implemented a sensitivity analysis to assess the variation of the initial Rt estimates vis-a`-vis k values of 4 days and 8 days,
respectively.
Method 2. We assume a known distribution of the SI in
South Africa and we estimate the initialRt using the maximum
likelihood estimator for known SI described by White and Pagano (2008) [9,25]. The estimator of initial Rt in this case is
a modification of Method 1 and is given by:
R
^
t~
PT t~1
Nt
PT t~1
Pmin (k,t)
j~1 pjNt{j
For this analysis we use the two SI distributions observed from investigations of the first 100 pH1N1 cases in South Africa [22]: (1) the SI distribution between primary cases and laboratory-confirmed secondary cases only (39%, 24%, 14%, 17%, 3% and 3% for day 1 to 6 respectively), and (2) the SI distribution between primary cases and suspected plus laboratory-confirmed secondary cases (30%, 17%, 20%, 23%, 7% and 3% for day 1 to 6 respectively). We consider suspected secondary cases, individuals
that developed ILI symptoms within 14 days from the symptom onset of a confirmed index case within the same household.
Method 3. We make use of the Wallinga and Teunis’ method
for estimation ofRtfrom the imputed data [26]. This method uses
the daily case counts of cases and assumes the serial interval is known. We make the same assumptions for the serial interval as in method 2. The method calculates the relative probability a case on dayiinfects a case on dayjas:
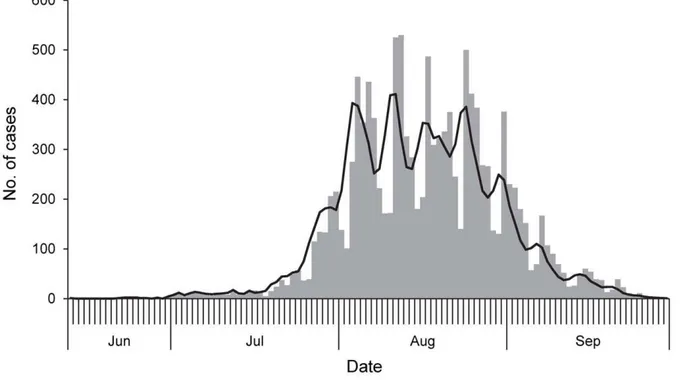
Figure 1. Epidemic curve of laboratory-confirmed influenza A(H1N1)pdm09 cases, South Africa, June 12 to September 30, 2009.
Bars show original recorded data applying date of symptom onset where available (n = 758) and substitute by date of specimen collection where onset was unavailable (total n = 12,526). The line shows imputed data where date of symptom onset for missing case-based data was obtained by multiple imputations adjusted by provincial location of specimen collection and the occurrence of a case on a weekend day (n = 12,491). doi:10.1371/journal.pone.0049482.g001
Table 1.Observed lag-time between date of symptom onset and date of specimen collection, incidence rate ratio (IRR) and
significance value of the covariates significant in the Poisson regression model.
Factor Observed Lag-Time Mean (Std. dev.) Model IRR p-value
Province ,0.001a
Eastern Cape 2.1 (2.0) – –
Free State 1.9 (1.7) 0.90 0.620
Gauteng 1.7 (2.0) 0.78 0.140
KwaZulu-Natal 3.7 (3.4) 1.73 0.003
Limpopo 1.4 (1.0) 0.66 0.047
Mpumalanga 1.3 (1.5) 0.59 0.042
Northern Cape 2.1 (1.9) 0.95 0.797
North West 1.6 (1.1) 0.80 0.575
Western Cape 1.0 (1.9) 0.50 ,0.001
Day of specimen collection
Week day 1.7 (2.1) – –
Weekend day 1.1 (1.9) 0.75 0.003
qij~
pj{i
P
k=jpkj
,
wherepkis the probability of a serial interval of lengthk.
Then the estimate for the reproductive number for casei, is:
Ri~
X
j
qij:
This method requires that we make use of the entire epidemic curve. We calculate Rt as the average of theRi when iis in the
epidemic period, as previously defined.
Estimates are reported as the means across the 100 imputations. For all estimates, we calculate bootstrap confidence intervals as has been described previously [9,26]. We combine the results from all 100 imputations to obtain a confidence interval that incorporates both imputation error, as well as random error [27].
All analyses were performed using R version 2.14.
Results
Data and Imputation
12,630 laboratory-confirmed pH1N1 cases were captured by the South African central registry during 2009. The overall demographic, spatial and temporal distribution of these cases has been previously described [23]. Data on date of symptom onset was available for 758 (6%) cases and date of specimen collection for 12,500 (99%) cases. The first case reported illness onset of June 12, 2009 and the epidemic peaked on week 32 (August 3–9, 2009) (Figure 1). The epidemic growth period (when sustained trans-mission began) started on June 21 (range in imputations: June 20– 21) and ended on August 11 (range: August 4–25).
The lag-time between symptom onset and specimen collection was significantly associated with the provincial location of specimen collection, as well as the collection of a specimen on a weekend day (Table 1). We used these two covariates in the multiple-imputation to predict the date of symptom onset where missing for all cases (Figure 1). Other available variables, including date of specimen collection (period during the epidemic), patient age and sex were not significantly associated with the lag-time
between symptom onset and specimen collection and, therefore, not included in the final model. Analyses to simultaneously estimate initialRtand serial interval, and estimate initialRtgiven
a known serial interval, were performed over the exponential growth phase of the epidemic from June 21 to August 3, 2009.
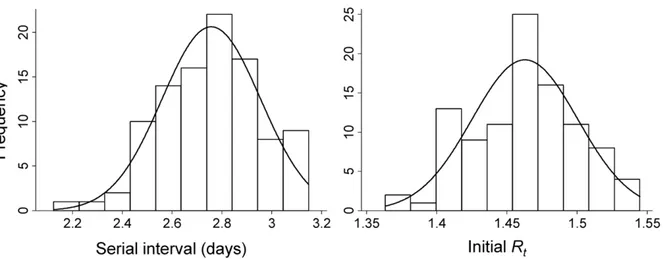
Simultaneous Estimation ofRtand Serial Interval Using the likelihood-based method to simultaneously estimate initialRtand the SI across 100 imputations of the dataset (Method
1), we estimated aRR^tof 1.47 (95% CI: 1.30–1.72) and a mean SI of 2.78 days (95% CI: 1.80–3.75) (Figure 2).RR^testimates ranged from 1.31 (95% CI: 1.21–1.48) to 1.54 (95% CI: 1.37–2.03) when the maximal value of the SI ranged from 4 to 8 days.
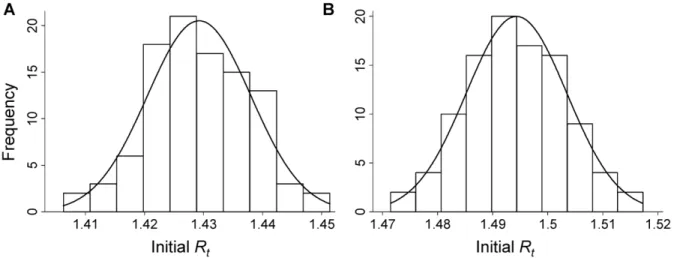
Estimation ofRt Assuming Known Serial Intervals We first utilised the SI established from the aforementioned field investigations of the initial 100 cases in estimatingRt, as described
in method 2. When performing the analysis using the SI distribution observed for laboratory-confirmed pH1N1 secondary cases only (mean 2.3 days, SD61.3, range 1–5) [22], we found an initial RR^t of 1.43 (95% CI: 1.38–1.49) (Figure 3A). When performing the analysis using the SI distribution observed for both confirmed and suspected secondary cases (mean 2.7 days, SD 61.5, range 1–6) [22], we found an initialRR^t of 1.49 (95% CI: 1.44–1.55) (Figure 3B).
Estimation ofRt
Figure 4 shows the variation inRR^twith the progression of the outbreak over time. We observed relatively high RR^t values following the introduction of pH1N1 virus into South Africa, corresponding to high rates of transmission and exponential growth of the local epidemic during this period.RR^tpeaked on the first day of the epidemic growth period (June 21) at 2.91 (95% CI: 0.85–3.99).RR^tbegan to drop from July 27 onward and remained consistently below one after August 22. This corresponds with the decline in the daily incidence of new cases detected. Averaging the
Rtvalues obtained during the epidemic growth period (June 21 to
August 3, 2009), we estimate initialRtto be 1.42 (95% CI: 1.20–
1.71).
Figure 2. Distribution of serial interval and initial effective reproductive number (Rt) across 100 simulations for the influenza A(H1N1)pdm09 epidemic in South Africa using the likelihood-based simultaneous estimation method (method 1).
doi:10.1371/journal.pone.0049482.g002
Discussion
Utilising temporal data on illness onset and specimen collection, and the epidemic curve derived from these data, we provide estimates of the transmissibility parameters of pH1N1 during the first wave experienced in South Africa. Our results focus primarily on the use of analytical techniques to estimate initialRt and SI
without incorporating contact tracing or household transmission studies. However, when parameters from field studies are avail-able, we show that these can be incorporated to provide robust estimates of transmission parameters. We found that initial Rt
estimates established using the likelihood-based method for the simultaneous estimation of Rtand SI (method 1: initialRR^t: 1.47,
SI: 2.78 days) are in agreement with those obtained using SI observed in field investigations [22] (method 2: initialRR^t: 1.43 and 1.49 using observed SI for laboratory confirmed or laboratory
confirmed and suspected cases respectively). In addition, the mean SI estimate obtained with method 1 (2.78 days) is in agreement with field findings (SI: 2.3–2.7 days using observed SI for laboratory confirmed or laboratory confirmed and suspected cases respectively). Previous estimates of initialRtand the mean SI for
pH1N1 have ranged between 1.3–2.9 and 2.5–3.3 days, re-spectively [2,6–11,14–19]. Our estimates are consistent with these findings, regardless of the method used for the analysis and despite difference in climate, demography and health systems across these countries. It appears that once established, the transmission characteristics of pH1N1 are very consistent. Differences in transmission rates may occur within smaller subgroups of the overall population; however, this has not been well-studied.
Previous estimates of the epidemiological parameters of seasonal influenza epidemics found a SI = 2–4 days [28–30], and aRta little
over 1 with slight variation between climates;Rt= 1.03 in Brazil
[31] versus Rt= 1.1–1.3 in more temperate climates [32]. A
number of studies have retrospectively estimated the transmissi-bility of influenza pandemics. During the 1918 Spanish influenza A(H1N1) pandemic, when assuming a SI = 4 days,R0estimates
range from 2.0–4.3 in community settings [33,34], and even higher values (R0= 2.6–10.6) in confined settings such as ships and
prisons [34]. A separate analysis predicted a slightly lower SI of 3.3 in community settings and a SI of 3.81 in confined settings during the 1918 pandemic, and subsequently estimatedR0values of 1.34–
3.21 and 4.97 in these respective settings [35].R0estimates from
the 1957 Asian influenza A(H2N2) pandemic range from 1.65– 1.68 [36,37]. During the first wave of the 1968–1969 Hong Kong influenza A(H3N2) pandemic, estimates ofR0 range from 1.06–
2.06 and increased to 1.21–3.58 during the second wave [38]. Given our findings, the overall transmissibility of pH1N1 in South African during 2009 was more similar to that of seasonal influenza strains than the 1918 pandemic, and comparable to lower end estimates of the latter pandemics. However, by showing variation in transmissibility with time, we demonstrate that shortly after introduction of pH1N1 into the country, transmission of the virus reached anRR^t of 2.9, resulting in exponential growth of the local epidemic and widespread illness. Nonetheless, we show that after a period of less than 2 months of heightened transmission,RR^t dropped below 1, corresponding to a decline in the incidence of new cases; likely a result of a combination of herd immunity, Figure 3. Distribution of the initial effective reproduction number (Rt) across 100 simulations for the pandemic influenza A(H1N1)pdm09 epidemic in South Africa, assuming known serial interval (SI) estimates derived from (A) confirmed secondary cases only (SI: 2.3 days) and (B) confirmed plus suspected secondary cases (SI: 2.7 days) in the transmission chain (method 2).
doi:10.1371/journal.pone.0049482.g003
Figure 4. Temporal variation in the mean effective reproduc-tive number (RR^t) of influenza A(H1N1)pdm09 in South
Africa, June 15 to October 4, 2009 (method 3).
public health infection control measures and climate impact on virus transmission.
There are several limitations in this analysis which merit discussion. First, we assume that all cases are known and reported. It has been shown previously that, if cases are not reported, this may bias estimates generated using this method [39]. If the proportion of cases reported remains consistent over the study, then the estimates of transmissibility will not be biased; however, if the reporting fraction varies through time, then biased estimates of the reproductive number and serial interval may result. Likewise, variation in case ascertainment with time may bias our estimates of the temporal variation ofRt. Generally higher reporting rates may
be anticipated in the early phase, with reporting fatigue later becoming a factor. Secondly, data for this study are derived from laboratory-based surveillance data from several regions across South Africa; a large and diverse country. Our findings do not incorporate heterogeneities (such as spatial and demographic differences) that likely exist in transmission patterns, or assess the degree to which these impact aggregate measures of initial Rt.
Methodologies that incorporate heterogeneities inherent in public health data warrant further study.
Despite these limitations, the post-pandemic estimates presented here add to the body of knowledge of pH1N1 transmissibility parameters, which were previously dominated by estimates from developed nations and often based on preliminary data. It remains
important that revised parameters, from complete datasets and diverse geographies, are incorporated into planning mitigation strategies for future pandemics. Nonetheless, the methods used in this study would be adaptable to generating real-time estimates during future epidemics. As we continue to build epidemiological capacity in developing nations, including South Africa, we must keep in mind the need for rapid assessments of transmissibility of novel pathogens, in addition to disease severity, to better inform public health interventions.
Acknowledgments
We would like to acknowledge and thank the many individuals and organisations who contributed to the investigation and response to pandemic influenza in South Africa, including the public- and private-sector laboratories that contributed data to the national central registry of confirmed cases. We also acknowledge Prof. Marc Lipsitch, Harvard School of Public Health, who contributed to the conceptualization of this analysis.
Author Contributions
Conceived and designed the experiments: BA ST LFW MP CC. Performed the experiments: BA ST LW. Analyzed the data: BA ST LW. Contributed reagents/materials/analysis tools: BA ST LFW MP CC. Wrote the paper: BA ST LFW MP CC.
References
1. World Health Organization (2010) Pandemic (H1N1) 2009 - update 112. Available: http://www.who.int/csr/don/2010_08_06/en/index.html. Accessed 2012 Mar 19.
2. Yang Y, Sugimoto JD, Halloran ME, Basta NE, Chao DL, et al. (2009) The transmissibility and control of pandemic influenza A (H1N1) virus. Science 326: 729–733.
3. Boelle PY, Ansart S, Cori A, Valleron AJ (2011) Transmission parameters of the A/H1N1 (2009) influenza virus pandemic: a review. Influenza Other Respi Viruses 5: 306–316.
4. Grassly NC, Fraser C (2008) Mathematical models of infectious disease transmission. Nat Rev Microbiol 6: 477–487.
5. Chowell G, Nishiura H, Bettencourt LM (2007) Comparative estimation of the reproduction number for pandemic influenza from daily case notification data. J R Soc Interface 4: 155–166.
6. Cauchemez S, Donnelly CA, Reed C, Ghani AC, Fraser C, et al. (2009) Household transmission of 2009 pandemic influenza A (H1N1) virus in the United States. N Engl J Med 361: 2619–2627.
7. Lessler J, Reich NG, Cummings DA, Nair HP, Jordan HT, et al. (2009) Outbreak of 2009 pandemic influenza A (H1N1) at a New York City school. N Engl J Med 361: 2628–2636.
8. Odaira F, Takahashi H, Toyokawa T, Tsuchihashi Y, Kodama T, et al. (2009) Assessment of secondary attack rate and effectiveness of antiviral prophylaxis among household contacts in an influenza A(H1N1)v outbreak in Kobe, Japan, May-June 2009. Euro Surveill 14.
9. White LF, Wallinga J, Finelli L, Reed C, Riley S, et al. (2009) Estimation of the reproductive number and the serial interval in early phase of the 2009 influenza A/H1N1 pandemic in the USA. Influenza Other Respi Viruses 3: 267–276. 10. Cowling BJ, Chan KH, Fang VJ, Lau LL, So HC, et al. (2010) Comparative
epidemiology of pandemic and seasonal influenza A in households. N Engl J Med 362: 2175–2184.
11. Donnelly CA, Finelli L, Cauchemez S, Olsen S, Doshi S, et al. (2011) Serial intervals and the temporal distribution of secondary infections within households of 2009 pandemic influenza A (H1N1): Implications for influenza control recommendations. CID 52: S123–S130.
12. Tuite AR, Greer AL, Whelan M, Winter AL, Lee B, et al. (2010) Estimated epidemiologic parameters and morbidity associated with pandemic H1N1 influenza. CMAJ 182: 131–136.
13. Morgan OW, Parks S, Shim T, Blevins PA, Lucas PM, et al. (2010) Household transmission of pandemic (H1N1) 2009, San Antonio, Texas, USA, April-May 2009. Emerg Infect Dis 16: 631–637.
14. Fraser C, Donnelly CA, Cauchemez S, Hanage WP, Van Kerkhove MD, et al. (2009) Pandemic potential of a strain of influenza A (H1N1): early findings. Science 324: 1557–1561.
15. Pourbohloul B, Ahued A, Davoudi B, Meza R, Meyers LA, et al. (2009) Initial human transmission dynamics of the pandemic (H1N1) 2009 virus in North America. Influenza Other Respi Viruses 3: 215–222.
16. McBryde E, Bergeri I, van Gemert C, Rotty J, Headley E, et al. (2009) Early transmission characteristics of influenza A(H1N1)v in Australia: Victorian state, 16 May - 3 June 2009. Euro Surveill 14.
17. de Silva UC, Warachit J, Waicharoen S, Chittaganpitch M (2009) A preliminary analysis of the epidemiology of influenza A(H1N1)v virus infection in Thailand from early outbreak data, June-July 2009. Euro Surveill 14.
18. Munayco CV, Gomez J, Laguna-Torres VA, Arrasco J, Kochel TJ, et al. (2009) Epidemiological and transmissibility analysis of influenza A(H1N1)v in a southern hemisphere setting: Peru. Euro Surveill 14.
19. Nishiura H, Wilson N, Baker MG (2009) Estimating the reproduction number of the novel influenza A virus (H1N1) in a Southern Hemisphere setting: preliminary estimate in New Zealand. N Z Med J 122: 73–77.
20. Nishiura H, Chowell G, Safan M, Castillo-Chavez C (2010) Pros and cons of estimating the reproduction number from early epidemic growth rate of influenza A (H1N1) 2009. Theor Biol Med Model 7: 1.
21. Boelle PY, Bernillon P, Desenclos JC (2009) A preliminary estimation of the reproduction ratio for new influenza A(H1N1) from the outbreak in Mexico, March-April 2009. Euro Surveill 14.
22. Archer BN, Timothy GA, Cohen C, Tempia T, Huma M, et al. (2012) Introduction of 2009 pandemic influenza A(H1N1) into South Africa: Clinical presentation, epidemiology and transmissibility of the first 100 cases. J Infect Dis Suppl: Influenza in Africa.
23. Archer B, Cohen C, Naidoo D, Thomas J, Makunga C, et al. (2009) Interim report on pandemic H1N1 influenza virus infections in South Africa, April to October 2009: epidemiology and factors associated with fatal cases. Euro Surveill 14.
24. World Health Organization (2009) CDC protocol of realtime RTPCR for swine influenza A(H1N1), revision 1. Available: http://www.who.int/csr/resources/ publications/swineflu/CDCrealtimeRTPCRprotocol_20090428.pdf. Accessed 2012 Mar 19.
25. White LF, Pagano M (2008) A likelihood-based method for real-time estimation of the serial interval and reproductive number of an epidemic. Stat Med 27: 2999–3016.
26. Wallinga J, Teunis P (2004) Different epidemic curves for severe acute respiratory syndrome reveal similar impacts of control measures. Am J Epidemiol 160: 509–516.
27. Rubin DB, Little RJA (2002) Statistical analysis with missing data. New York: Hoboken, NJ: J Wiley & Sons.
28. Cowling BJ, Fang VJ, Riley S, Malik Peiris JS, Leung GM (2009) Estimation of the serial interval of influenza. Epidemiology 20: 344–347.
29. Ferguson NM, Cummings DA, Cauchemez S, Fraser C, Riley S, et al. (2005) Strategies for containing an emerging influenza pandemic in Southeast Asia. Nature 437: 209–214.
30. Viboud C, Boelle PY, Cauchemez S, Lavenu A, Valleron AJ, et al. (2004) Risk factors of influenza transmission in households. Br J Gen Pract 54: 684–689. 31. Chowell G, Viboud C, Simonsen L, Miller M, Alonso WJ (2010) The
reproduction number of seasonal influenza epidemics in Brazil, 1996–2006. Proc Biol Sci 277: 1857–1866.
32. Chowell G, Miller MA, Viboud C (2008) Seasonal influenza in the United States, France, and Australia: transmission and prospects for control. Epidemiol Infect 136: 852–864.
33. Mills CE, Robins JM, Lipsitch M (2004) Transmissibility of 1918 pandemic influenza. Nature 432: 904–906.
34. Vynnycky E, Trindall A, Mangtani P (2007) Estimates of the reproduction numbers of Spanish influenza using morbidity data. Int J Epidemiol 36: 881– 889.
35. White LF, Pagano M (2008) Transmissibility of the influenza virus in the 1918 pandemic. PLoS One 3: e1498.
36. Longini IM Jr, Halloran ME, Nizam A, Yang Y (2004) Containing pandemic influenza with antiviral agents. Am J Epidemiol 159: 623–633.
37. Gani R, Hughes H, Fleming D, Griffin T, Medlock J, et al. (2005) Potential impact of antiviral drug use during influenza pandemic. Emerg Infect Dis 11: 1355–1362.
38. Jackson C, Vynnycky E, Mangtani P (2010) Estimates of the transmissibility of the 1968 (Hong Kong) influenza pandemic: evidence of increased trans-missibility between successive waves. Am J Epidemiol 171: 465–478. 39. White LF, Pagano M (2010) Reporting errors in infectious disease outbreaks,