ISSN: 1553-3468
© 2012 Y. Zhang et al., This open access article is distributed under a Creative Commons Attribution (CC-BY) 3.0 license
doi:10.3844/ajbb.2012.44.53 Published Online 8 (2) 2012 (http://www.thescipub.com/ajbb.toc)
PHYSICAL PROPERTIES OF CORN RESIDUES
1, 2
Yaning Zhang,
1A.E. Ghaly and
2Bingxi Li
1Department of Process Engineering and Applied Science, Faculty of Engineering,
Dalhousie University, Halifax, Canada
2School of Energy Science and Engineering, Harbin Institute of Technology, Harbin, China
Received 2012-04-15; Revised 2012-05-2; Accepted 2012-05-13
ABSTRACT
Corn residues (cobs, leaves and stalks) are abundantly available renewable materials that can be used as an energy source in gasification and combustion systems. Proper understanding of the physical properties of these materials is necessary for their use in thermochemical conversion processes. The physical properties (moisture content, particle size, bulk density and porosity) of corn cobs, leaves and stalks were determined in this study. The moisture contents were 6.38, 7.92 and 6.40% of the cobs, leaves and stalks, respectively. The cobs had the highest weight percentage (18.23%) of the small particles (<0.212 mm) and the leaves had the highest weight percentage (40.10%) of large particles (>0.850 mm). Most of the stalk particles (84.82%) were in the range of 0.212-0.850 mm. The cob particle size had a normal concave (inward) distribution between particle sizes 0.106 mm (18.23 weight %) and 0.925 mm (25.26 weight %) with the lowest weight percentage (5.30 weight %) at 0.390 mm particle size while the stalk particle size had a normal convex (outward) distribution between particle sizes 0.106 mm (8.49 weight %) and 0.925 mm (6.69 weight %) with the highest weight percentage (23.47 weight %) at the 0.605 mm particle size. The leaves had an increasing trend of particle size distribution between the particle sizes 0.106 and 0.925 mm. The average particle sizes for the cobs, leaves and stalks were 0.56, 0.70 and 0.49 mm, respectively. The average bulk density was 282.38, 81.61 and 127.32 kg m−3 for the corn cobs, leaves and stalks, respectively. The average porosity was 67.93, 86.06 and 58.51% for the corn cobs, leaves and stalks, respectively. A positive relationship between the average particle size and the porosity was observed for the corn residues. The differences in the physical properties among the corn residues (cobs, leaves and stalks) observed in this study are due to variations in the compositions and structures of these materials.
Keywords: Corn, cob, leaf, stalk, moisture content, particle size, bulk density, porosity
1.
INTRODUCTION
Corn (maize) is an important food for many people in Africa, Asia and Latin America and is used in animal feeding in North America and some parts of the world. In sub-Saharan Africa, corn is a staple food for an estimated 50% of the population IITA, 2009 and it remains the most important agricultural crop for over 70 million farm families worldwide. Corn is used as human food in the form of tortillas, porridge, popcorn and barbecues and as forage and silage for animals. It is also a good source of industrial products such as starch (Zhang et al., 2012), vitamin (Warman and Havard, 1998), fiber (Pandya and Srinivasan, 2012), oil (Comin et al., 2012) and ethanol (Lamsal et al., 2011).
The global corn production increased from 599.35-867.52 million tonnes (44.74% increase) during
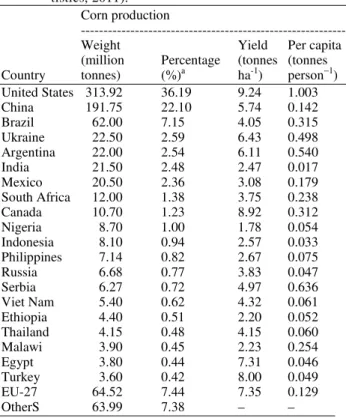
the period of 2001-2011 as shown in Fig. 1 (USDA, 2011), which is much higher than the increase in the world population of 12.34% (6.16-6.92 billion) during the same period. The estimated value of global corn production in 2011 was US$ 199.53 billion. Table 1 shows the corn production by important producing countries. The per capita corn consumption, corn imports and exports of the top 10 counties in each category are presented in Fig. 2-4, respectively.
Cobs, leaves and stalks are important residues of corn processing and consumption. For every 1 kg of dry corn grains produced, about 0.15 kg of cobs, 0.22 kg of leaves and 0.50 kg of stalks are produced (Sokhansanj et al., 2002; 2010 (USDA, 2011). This results the production of about 130.13, 190.85 and 433.76 million tonnes of cobs, leaves and stalks in 2011,
Fig. 1. World population and corn production during the period. Table 1. Word corn production (USDA, 2011; Global
Sta-tistics, 2011). Corn production
---
Weight Yield Per capita
(million Percentage (tonnes (tonnes Country tonnes) (%)a ha-1) person−1)
United States 313.92 36.19 9.24 1.003
China 191.75 22.10 5.74 0.142
Brazil 62.00 7.15 4.05 0.315
Ukraine 22.50 2.59 6.43 0.498
Argentina 22.00 2.54 6.11 0.540
India 21.50 2.48 2.47 0.017
Mexico 20.50 2.36 3.08 0.179
South Africa 12.00 1.38 3.75 0.238
Canada 10.70 1.23 8.92 0.312
Nigeria 8.70 1.00 1.78 0.054
Indonesia 8.10 0.94 2.57 0.033
Philippines 7.14 0.82 2.67 0.075
Russia 6.68 0.77 3.83 0.047
Serbia 6.27 0.72 4.97 0.636
Viet Nam 5.40 0.62 4.32 0.061
Ethiopia 4.40 0.51 2.20 0.052
Thailand 4.15 0.48 4.15 0.060
Malawi 3.90 0.45 2.23 0.254
Egypt 3.80 0.44 7.31 0.046
Turkey 3.60 0.42 8.00 0.049
EU-27 64.52 7.44 7.35 0.129
OtherS 63.99 7.38 – –
a Percentage of world production.
Currently, these residues have a number of limited ap-plications including: (a) use of corn cobs as building material and activated carbon (Pinto et al., 2012; Cao et al., 2006), (b) use of corn leaves as a feedstock for fer-mentable sugars and supplemental fiber source for paper pulp (Shinners and Binversie, 2007; Su et al., 2006) and (c) use of corn stalks as livestock feed and biofertilizer (Chen et al., 2010a; Li et al., 2007).
Fig. 2. Per capita corn consumption of the top 10 countries.
Fig. 3. Corn imports from the top 10 countries (USDA, 2011).
The physical properties (moisture content, particle size, bulk density and porosity) of a given biomass material such as corn cobs, leaves and stalks greatly influence the design and operation of thermochemical conversion systems. High moisture content decreases the heating value of fuel, which in turn reduces the conversion efficiency as a large amount of energy would be used for the initial drying step during the conversion processes (Mansaray and Ghaly, 1997). The particle size distribution affects the flowability, heating, diffusion and rate of reaction (Guo et al., 2012; Hernandez et al., 2010). The bulk density affects the economics of collection, transportation and storage as well as feeding the material into the thermochemical conversion system (Natarajan et al., 1998). Porosity affects the interstitial airflow velocity and the heat and mass transfer conditions and ultimately influences reaction parameters such as heat conductivity, burning rate, conversion efficiency and emissions (Igathinathane et al., 2010; Hamel and Krumm, 2008). Therefore, a full understanding of the physical properties of cobs, leaves and stalks is essential for the design and operation of efficient thermochemical conversion systems such as gasifiers and combustors.
The main objectives of this study were: (a) to investigate the physical properties (moisture content, particle size distribution, bulk density and porosity) of corn plant residues (cobs, leaves and stalks) as related to pre-processing and design of thermochemical conversion systems and (b) to determine if there are differences in the physical properties of these three parts of corn plant.
2.
MATERIALS AND METHODS
2.1.
Sample Preparation
Corn cobs, leaves and stalks were collected from China. The samples were ground through a coarse sieve (12.7 mm) and a 20-mesh sieve (0.85 mm) on a medium size Wiley Mill (Model X876249, Brook Crompton Parkinson Limited, Toronto, Ontario). The coarse ground samples were then ground through a 40-mesh sieve (0.425 mm) on the Wiley Mill in order to narrow the range of particle size and thus obtain homogeneous samples.
2.2.
Moisture Content
The moisture content was determined using the oven-drying method (ASTM 2010). A large aluminum dish was weighed using a digital balance (Model PM 4600, Mettler Instrument AG, Greifensee, Zurich). The ground sample was placed in the dish and the dish and sample were weighed. The dish and sample were then placed in an air-forced drying oven (Heratherm, Thermo
Fisher Scientific Inc., Waltham, USA) and kept at 105°C until a constant weight was achieved. The dish containing the dried sample was cooled to the room temperature in a desiccator and then weighed. The moisture content was calculated on a wet basis as follows Eq. 1:
WW DW
MC 100
WW −
= × (1)
Where:
MC = The moisture content (%)
WW = The wet weight of the sample and dish (g) DW = The dry weight of the sample and dish (g)
2.3.
Particle Size Distribution
The particle size distribution was determined using seven standard sieves (Canadian Standard Sieve Series, W.S. Tyler Company of Canada Limited, St. Catharines, Ontario) and a bottom pan that collects everything that passed though the seventh sieve. The sieves were mounted on an electrical sieve shaker driven by a 0.25-hp electric motor running at 1725 rpm (Model Rx-86, Hoskin Scientific Limited, Gastonia, North Carolina). The sample was placed in sieve 1, which was then covered with the sieve lid. The shaker was operated at the speed of 350 rpm for 30 min. The particles collected in each sieve were weighed. The sieve number, mesh number and mesh size of the seven sieves are shown in Table 2.
2.4.
Bulk Density
An empty container (150 mL) was weighed using a digital balance (Model PM 4600, Mettler Instrument AG, Greifensee, Zurich) to the nearest 0.0001g. The container was filled with the sample and the material was slightly compacted to ensure absence of large void spaces. The container and the sample were then weighed. Three replicates were carried out. The wet bulk density of the sample was calculated from the following Eq. 2:
2 1
b
W W
v −
ρ = (2)
Where:
ρb = The bulk density of the sample (g cm-3)
W2 = The weight of the container and sample (g)
W1 = The weight of the container (g)
V = The volume of the container (cm3)
2.5.
Porosity
Table 2. Sieve number, mesh number and mesh size.
Sieve number Mesh number Mesh size (mm)
1 20 0.850
2 25 0.710
3 35 0.500
4 40 0.425
5 45 0.355
6 50 0.300
7 70 0.212
pan - 0.000
A wire mesh screen was placed on the top of the sample to prevent material from floating once submerged in water. Distilled water was slowly poured over the sample until the water level was above the top of the sample. The cylinder was gently rocked from side to side ten times to free trapped air bubbles before recording the final water level. The amount of added water and the water level were recorded to the nearest 1 mL. The cylinder was emptied and cleaned thoroughly after each test. Three replicates were carried out. The porosity of biomass was calculated from the following Eq. 3:
i f
s
v v
P (%) 100
v −
= × (3)
Where:
P = The porosity of the sample (%)
Vi = The combined volume of the sample plus added water
(ml)
Vf = The final total volume of the sample and added water
(ml)
Vs = The volume of the sample (ml)
3.
RESULTS AND DISCUSSION
3.1.
Moisture Content
The moisture content results of the corn cobs, leaves and stalks are shown in Table 3. The moisture content was 6.38, 7.92 and 6.40% for the corn cobs, leaves and stalks, respectively. The moisture contents of corn cobs and stalks are in the range of 5.3-7.2% reported by Ileleji and Zhou (2008) for the corn stover (whole corn plant tissue except the ear) from USA. The moisture content of corn leaves is similar to the values of 8-9% reported by Kumar et al. (2011) from the leaves of corn stover from USA. However, the moisture contents reported in this study (6.38-7.92%) are lower than the value of 9% reported by Bitra et al. (2009) for the corn stover from USA, the value of 11.3% reported by Igathinathane et al. (2009) for the corn stalk from the USA and the value of 11.4% reported by Luo et al. (2011) for the corn stalk from China. These variations could be due to differences in the collection and storage procedures and the use of different techniques to determine the moisture content.
Table 3. Moisture content, average particle size, bulk density and porosity of corn residues.
Average Bulk
Moisture Particle density Porosity Corn a content (%) size (mm) (kg m-3) (%)
Cobs 6.38 0.56 282.38 67.93
Leaves 7.92 0.70 81.61 86.06
Stalks 6.40 0.49 127.32 58.51
a Average of three replicates.
Table 4. Particle size distribution of corn residues. Weight percentage (%)a
---
Size range (mm) Cobs Leaves Stalks
0~0.212 18.23 4.03 8.49
0.212~0.300 9.19 4.19 8.70
0.300~0.355 6.15 3.89 10.67
0.355~0.425 5.30 5.83 12.60
0.425~0.500 6.90 7.78 16.93
0.500~0.710 10.98 12.70 23.47
0.710~0.850 17.99 21.48 12.45
>0.850 25.26 40.10 6.69
a Average of three replicates.
The samples reported by Bitra et al. (2009) and Igathinathane et al. (2009) were oven-dried at 103°C for 24 hours, the sample reported by Luo et al. (2011) was air-dried, while the samples used in this study were oven-dried at 105°C for about 24 h.
Liang et al. (2003) and Pommier et al. (2008) stated that the moisture content provides a medium for the transport of dissolved nutrients required for the metabolic and physiological activities of microorganisms in the solid fuels and an increase in moisture content will increase the biodegradation rate of organic material, resulting in the loss of solid fuels. The high moisture content of wheat straw will substantially affect its quality as a fuel source and decreases its heating value, which in turn reduces the conversion efficiency and performance of the system, because a large amount of energy would be used for vaporization of the fuel moisture during the conversion processes (Chen et al., 2009; Ghaly and Al-Taweel, 1990). A dry material is thus preferred for storage, size reduction, gasification and combustion. On the other hand, a certain amount of moisture in the fuel may be beneficial for densification and gasification (Mani et al., 2006; Swierczynski et al., 2007).
3.2.
Particle Size Distribution
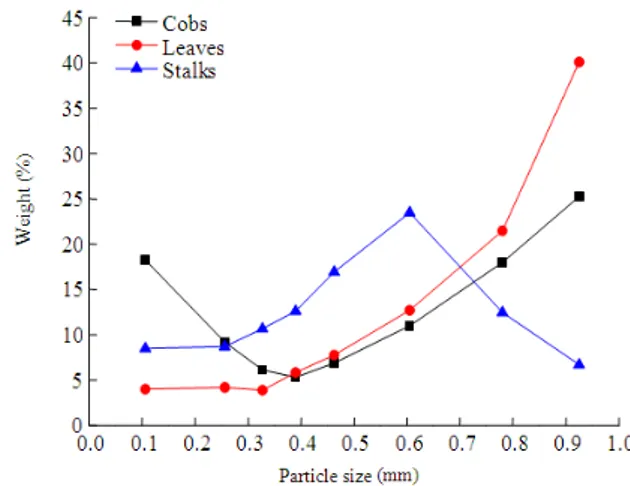
(25.26%) and stalks (6.69%). However, the medium particles (0.212-0.850 mm) for the cobs, leaves and stalks were 56.51, 55.87 and 84.82%, respectively.
Figure 5 shows the particle size distribution for the three corn residues. The particle size distribution of the cobs had a normal concave (inward) distribution between particle sizes 0.106 mm (18.23 weight %) and 0.925 mm (25.26 weight %) with the lowest weight percentage (5.30 weight %) at 0.390 mm particle size. The particle size distribution of the stalks had a normal convex (outward) distribution between particle sizes 0.106 mm (8.49 weight %) and 0.925 mm (6.69 weight %) with the highest weight percentage (23.47 weight %) at the 0.605 mm particle size. However, the particle size of the leaves had an increasing trend distribution between particle sizes 0.106 mm and 0.925 mm, the smaller the particle size the lower the weight percentage and the larger the particle size the greater the weight percentage.
Fig. 5. Particle size distribution of corn residues.
Fig. 6.Average particle size of corn residues.
The variations in particle size distribution among the three corn residues observed in this study could be due to variations in their compositions. Duguid et al. (2009) reported that the glucan, xylan, acid insoluble lignin, acid soluble lignin and ash contents were 36.6, 29.2, 17.8, 4.9 and 0.3% for corn cobs, 35.8, 20.0, 17.0, 5.4 and 2.0% of corn leaves and 35.4-37.3, 18.5-20.5, 17.8-20.2, 4.4-4.6 and 0.5-1.2% of corn stalks, respectively. Montross and Crofcheck (2004) reported that the glucose concentrations for corn cobs, leaves and stalks were 55.9, 35.7 and 29.6%, respectively. There are also reported variations in the cellulose, hemicellulose and lignin contents among the corn cobs, leaves and stalks. The reported cellulose, hemicellulose and lignin contents were 30, 38 and 3% for corn cobs (Mullen et al., 2010), 38.77, 23.74 and 7.15% for corn leaves (Wang et al., 2012) and 40.4, 71.3 and 18.3% of corn stalks (Luo et al., 2011), respectively.
The average particle sizes for corn cobs, leaves and stalks were 0.56, 0.71 and 0.49 mm, respectively (Table 3 and Fig. 6). These values are within the range of 0.25-4.42 mm reported by Ileleji and Zhou (2008) for the corn stover from USA and similar to the value of 0.77 mm reported by Li et al. (2008) for the corn leaves, stalks and bracts from China. They are, however, lower than the values of 1-2 mm reported by Chen et al. (2010b) for the corn cobs from China and the value of 5.6 mm reported by Mani et al. (2006) for the corn stover from Canada. These differences could be the result of using different equipment and different grinding procedures. The sample presented by Chen et al. (2010b) was chopped in a knife mill, the sample reported by Mani et al. (2006) was ground in a tub grinder, whereas the samples in this study were ground through a Wiley mill with three sieves: a coarse sieve (12.7 mm), a 20-mesh sieve (0.85 mm) and a 40-mesh sieve (0.425 mm).
Ryu et al. (2006) stated that large particles are thermally thick thereby having a slow devolatilization rate and more distributed heat transfer to nearby particles. On the other hand, small particles of fuel may enhance the reaction area and result in high burning rates and ignition front speeds (Kwong et al., 2007). Small particle size can also significantly increase the bulk density of biofuels and eventually increase the energy density and reduce the cost of transport and storage (Sangnark and Noomhorm, 2004; Chiueh et al., 2012; Deng et al., 2009). Size reduction therefore appears to be beneficial and important for pretreatment of biofuels before the utilization (Zhang and Zhang, 1999).
3.3.
Bulk Density
was 282.38, 81.61 and 127.32 kg m−3 for the corn cobs, leaves and stalks, respectively. The average bulk density of corn stalks is similar to the value of 127.5 kg m−3 reported by Sciban et al. (2008) for the corn stalks from Serbia and the value of 129 kg m−3 reported by Raveendran et al. (1995) for the corn stalks from India. The bulk density values of corn leaves and stalks are within the values of 37-150 kg m−3 reported by Shinners et al. (2007) for the corn stover from USA. The average bulk density of corn cobs is within the range of 170.00-297.78 kg m−3 reported by Pinto et al. (2012) for the corn cobs from Portugal. However, these values (81.61-282.38 kg m−3) are lower than the values of 695.5-1169.9 kg m-3 reported by Kaliyan and Morey (2009) and higher than the values of 34.44-80.24 kg m−3 reported by Chevanan et al. (2010) for the corn stovers from USA. These differences could also be the result of using different equipment and different grinding procedures. The samples reported by Kaliyan and Morey (2009) were densified by a cylinder, the samples reported by Chevanan et al. (2010) were chopped in a knife mill, whereas the samples used in this study were ground in a Wiley mill (12.7, 0.85 and 0.425 mm).
The bulk density of the cobs was 121.79% higher than that of the stalks and 246.01% higher than that of the leaves. The bulk density of the stalks was only 56.01% higher than that of the leaves. These differences may be due to variations in the particle size distribution, the chemical composition and the structures of these materials. Figure 7 shows SEM photographs of the corn residues which indicate structural differences among these residues. The structure of cobs is more compact than the leaves and stalks which results in a higher bulk density.
Rozainee et al. (2008) stated that the bulk density of fuel affects its residence time in the reactor. Lower bulk density may result in lower conversion efficiency, as it gives rise to poor mixing characteristics and a nonuniform temperature distribution, both of which create unfavorable operating conditions of the thermochemical conversion systems. Densification of corn stover can increase its density to more than 600 kg m-3 (Petrolia, 2008) through a squeezer and to more than 1100 kg m-3 (Kaliyan and Morey, 2009) through a compression cylinder. The major advantages of this technique include high volumetric density and energy content, lower transportation and storage costs and lower emissions during combustion (Sokhansanj et al., 2010; Ryu et al., 2006; Mani et al., 2006; Khan et al., 2009). The high investment on equipment and energy input required for pelletization and compression are the major constraints of the densification process (Adapa et al., 2009). However, the high cost of oil, current demand for biomass utilization and technology improvement will make the processes of densification and compression more attractive.
3.4.
Porosity
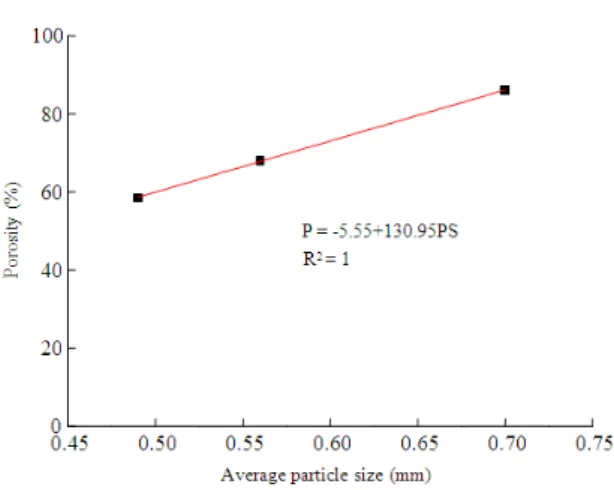
The porosity results of the corn cobs, leaves and stalks are shown in Table 3. The average porosity was 67.93, 86.06 and 58.71% for the corn cobs, leaves and stalks, respectively. Corn leaves have the highest porosity, because they have larger particles and the greatest average particle size than those of the cobs and stalks.
The porosity values (58.51-86.06%) obtained in this study are lower than the values of 88.21-88.80% (calculated from the bulk density and particle density) presented by Mani et al. (2004) for the corn stover from Canada. They are, however, higher than the values of 11.36-29.06% presented by Theerarattananoon et al. (2011) for the corn stover from USA. These may be due to the fact that the samples presented by Mani et al. (2004) were milled though 3.2 mm, 1.6 mm and 0.8 mm sieves, the samples presented by Theerarattananoon et al. (2011) were made into pellets, while the samples in this study were milled though 12.7, 0.85 0.425 mm sieves and not made into pellets.
Fig. 8.Relationship between porosity and average particle size for corn residues.
A positive relationship between average particle size and porosity was observed for the corn residues (Fig. 8), the smaller the particle size the lower the porosity. The relationship can be described by the following Eq. 4:
2
P=.5.55 130.95PS (R+ =1.00) (4)
Where:
P = The porosity (%)
PS = The average particle size (mm)
The porosity of biomass samples depends on a number of factors including particle size distribution, particle shape, shaking and pressing (Igathinathane et al., 2010). A decrease in the porosity will increase the interstitial airflow velocity and brings changes in heat and mass transfer conditions and ultimately influences the combustion parameters such as heat conductivity, burning rate, conversion efficiency and emissions (Igathinathane et al., 2010; Hamel and Krumm, 2008). Pelletizing or compacting can decrease the porosity of biomass samples. However, these dense materials may deteriorate the flow characteristics in the gasifier or combustor, thereby causing post-processing problems (Chen et al., 2009).
4.
CONCLUSION
The results showed that the cobs, leaves and stalks of corn plant had different physical properties (moisture content, particle size distribution, bulk density and porosity). The moisture contents were 6.38, 7.92 and 6.40% for the cobs, leaves and stalks, respectively. The cobs had the highest weight percentage (18.23%) of most
of the small particles (<0.212 mm) while the leaves had the highest weight percentage (40.10%) of large particles (>0.850 mm). Most of the stalk particles (84.82%) were in the range of 0.212-0.850 mm. The cob particle size had a normal concave (inward) distribution between particle sizes 0.106 mm (18.23 weight %) and 0.925 mm (25.26 weight %) with the lowest weight percentage (5.30 weight %) at 0.390 mm particle size while the stalk particle size had a normal convex (outward) distribution between particle sizes 0.106 mm (8.49 weight %) and 0.925 mm (6.69 weight %) with the highest weight percentage (23.47 weight %) at the 0.605 mm particle size. The leaves had an increasing trend of particle size distribution between the particle sizes 0.106 and 0.925 mm. The average particle sizes for the cobs, leaves and stalks were 0.56, 0.70 and 0.49 mm, respectively. The average bulk density was 282.38, 81.61 and 127.32 kg m−3 for the corn cobs, leaves and stalks, respectively. The average porosity was 67.93, 86.06 and 58.51% for the corn cobs, leaves and stalks, respectively. A positive relationship between the average particle size and the porosity was observed for the corn residues. The differences in the physical properties among the corn residues (cobs, leaves and stalks) observed in this study are due to variations in the compositions and structures of these materials.
5.
ACKNOWLEDGEMENT
The project was funded by National Science and Engineering Council (NSERC) of Canada. The authors would like to thank Mr. Rye Dube and Mr. Weida Shi for their technical support during the grinding experiments.
6.
REFERENCES
Adapa, P., L. Tabil, G. Schoenau, 2009. Compaction characteristics of barley, canola, oat and wheat straw. Biosyst. Eng., 104: 335-344. DOI: 10.1016/j.biosystemseng.2009.06.022
Bitra, V.S.P., A.R. Womac, N. Chevanan, P.I. Miu and C. Igathinathane et al., 2009. Direct mechanical energy measures of hammer mill comminution of switchgrass, wheat straw and corn stover and anal-ysis of their particle size distributions. Powder
Technol., 193: 32-45. DOI:
10.1016/j.powtec.2009.02.010
Chen, L.J., L. Xing and L.J. Han, 2009. Renewable energy from agro-residues in China: Solid biofuels and biomass briquetting technology. Renew. Sus-tain. Energy Rev., 13: 2689-2695. DOI: 10.1016/j.rser.2009.06.025
Chen, G., Z. Zheng, S. Yang, C. Fang and X. Zou et al., 2010a. Experimental co-digestion of corn stalk and vermicompost to improve biogas production. Waste
Manage., 30: 1834-1840. DOI:
10.1016/j.wasman.2010.03.014
Chen, Y., B. Dong, W. Qin and D. Xiao, 2010b. Xylose and cellulose fractionation from corncob with three different strategies and separate fermentation of them to bioethanol. Bioresource Technol., 101: 6994-6999. DOI: 1 0.1016/j.biortech.2010.03.132 Chevanan, N., A.R. Womac, V.S.P. Bitra, C.
Igathina-thane and Y.T. Yang et al., 2010. Bulk density and compaction behavior of knife mill chopped switch-grass, wheat straw and corn stover. Bioresource
Technol., 101: 207-214. DOI:
10.1016/j.biortech.2009.07.083
Chiueh, P.T., K.C. Lee, F.S. Syu and S.L. Lo, 2012. Im-plications of biomass pretreatment to cost and car-bon emissions: Case study of rice straw and Penni-setum in Taiwan. Bioresource Technol., 108: 285-294. DOI: 10.1016/j.biortech.2012.01.006 Comin, L.M., F. Temelli, M.D.A. Saldaña. 2012.
Im-pregnation of flax oil in pregelatinized corn starch using supercritical CO2. J. Supercritical Fluids, 61:
221-228. DOI: 10.1016/j.supflu.2011.08.013 Deng, J., G.J. Wang, J.H. Kuang, Y.L. Zhang and Y.H.
Luo, 2009. Pretreatment of agricultural residues for co-gasification via torrefaction. J. Anal. Applied
Pyrolysis, 86: 331-337. DOI:
10.1016/j.jaap.2009.08.006
Duguid, K.B., M.D. Montross, C.W. Radtke, C.L. Crof-check, L.M. Wendt, S.A. Shearer. 2009. Effect of anatomical fractionation on the enzymatic hydroly-sis of acid and alkaline pretreated corn stover. Bio-resource Technol., 100: 5189-5195. DOI: 10.1016/j.biortech.2009.03.082
Ghaly, A.E. and A. Al-Taweel, 1990. Physical and ther-mochemical properties of cereal straws. Energy
Sources, 12: 131-145. DOI:
10.1080/00908319008960195
Guo, Q., X.L. Chen and H.F. Liu, 2012. Experimental research on shape and size distribution of biomass
particle. Fuel, 94: 551-555. DOI:
10.1016/j.fuel.2011.11.041
Hamel, S. and W. Krumm, 2008. Near-wall porosity characteristics of fixed beds packed with wood chips. Powder Technol., 188: 55-63. DOI: 10.1016/j.powtec.2008.03.011
Hernandez, J.J., G. Aranda-Almansa and A. Bula, 2010. Gasification of biomass wastes in an entrained flow gasifier: Effect of the particle size and the residence time. Fuel Processing Technol.,91: 681-692. DOI: 10.1016/j.fuproc.2010.01.018
Igathinathane, C., A.R. Womac, S. Sokhansanj and S. Narayan, 2009. Size reduction of high- and low-moisture corn stalks by linear knife grid system. Biomass Bioenergy, 33: 547-557. DOI: 10.1016/j.biombioe.2008.09.004
Igathinathane, C., J.S. Tumuluru, S. Sokhansanj, X. Bi and C.J. Lim et al., 2010. Simple and inexpensive method of wood pellets macro-porosity measure-ment. Bioresource Technol., 101: 6528-6537. DOI: 10.1016/j.biortech.2010.03.034
Ileleji, K.E. and B. Zhou, 2008. The angle of repose of bulk corn stover particles. Powder Technol., 187: 110-118. DOI: 10.1016/j.powtec.2008.01.029 Ioannidou, O., A. Zabaniotou, E.V. Antonakou, K.M.
Papazisi and A.A. Lappas et al., 2009. Investigating the potential for energy, fuel, materials and chemi-cals production from corn residues (cobs and stalks) by non-catalytic and catalytic pyrolysis in two reac-tor configurations. Renew. Sustain. Energy Rev., 13: 750-762. DOI: 10.1016/j.rser.2008.01.004
Kaliyan, N. and R.V. Morey, 2009. Constitutive model for densification of corn stover and switchgrass.
Biosyst. Eng., 104: 47-63. DOI:
10.1016/j.biosystemseng.2009.05.006
Khan, A.A., W.D. Jong, P.J. Jansens and H. Spliethoff, 2009. Biomass combustion in fluidized bed boilers: Potential problems and remedies. Fuel Process.
Technol., 90: 21-50. DOI:
10.1016/j.fuproc.2008.07.012
Kumar, A., L. Wang, Y.A. Dzenis, D.D. Jones and M.A. Hanna, 2008. Thermogravimetric characterization of corn stover as gasification and pyrolysis feedstock. Biomass Bioenergy, 32: 460-467. DOI: 10.1016/j.biombioe.2007.11.004
Kumar, S., U. Kothari, L. Kong, Y.Y. Lee and R.B. Gupta, 2011. Hydrothermal pretreatment of switch-grass and corn stover for production of ethanol and carbon microspheres. Biomass Bioenergy, 35: 956-968. DOI: 10.1016/j.biombioe.2010.11.023 Kwong, P.C.W., C.Y.H. Chao, J.H. Wang, C.W.
Lamsal, B.P., H. Wang and L.A. Johnson, 2011. Effect of corn preparation methods on dry-grind ethanol production by granular starch hydrolysis and parti-tioning of spent beer solids. Bioresource Technol.,
102: 6680-6686. DOI:
10.1016/j.biortech.2011.03.040
Li, B.Y., D.M. Zhou, L. Cang, H.L. Zhang and X.H. Fan et al., 2007. Soil micronutrient availability to crops as affected by long-term inorganic and organic ferti-lizer applications. Soil Tillage Res., 96: 166-173. DOI: 10.1016/j.still.2007.05.005
Li, Z., W. Zhao, B. Meng, C. Liu and Q. Zhu and G. Zhao, 2008. Kinetic study of corn straw pyrolysis:
Comparison of two different
three-pseudocomponent models. Bioresource
Tech-nol., 99: 7616-7622. DOI:
10.1016/j.biortech.2008.02.003
Liang, C., K.C. Das and R.W. McClendon, 2003. The influence of temperature and moisture contents re-gimes on the aerobic microbial activity of a bioso-lids composting blend. Bioresource Technol., 86: 131-137. DOI: 10.1016/S0960-8524(02)00153-0 Luo, S., C. Liu, B. Xiao and L. Xiao, 2011. A novel
biomass pulverization technology. Renew. Energy, 36: 578-582. DOI: 10.1016/j.renene.2010.08.003 Mani, S., L.G. Tabil and S. Sokhansanj, 2006. Specific
energy requirement for compacting corn stover. Bioresource Technol., 97: 1420-1426. DOI: 10.1016/j.biortech.2005.06.019
Mani, S., L.G. Tabil and S. Sokhansanj. 2004. Grinding performance and physical properties of wheat and barley straws, corn stover and switchgrass. Biomass
Bioenergy, 27: 339-352. DOI:
10.1016/j.biombioe.2004.03.007
Mansaray, K.G. and A.E. Ghaly, 1997. Physical and thermochemical properties of rice husk. Energy
Sources, 19: 989-1004. DOI:
10.1080/00908319708908904
Montross, M.D. and C.L. Crofcheck, 2004. Effect of stover fraction and storage method on glucose pro-duction during enzymatic hydrolysis. Bioresource
Technol., 92: 269-274. DOI:
10.1016/j.biortech.2003.09.007
Mullen, C.A., A.A. Boateng, N.M. Goldberg, I.M. Lima and D.A. Laird et al., 2010. Bio-oil and bio-char production from corn cobs and stover by fast pyro-lysis. Biomass and Bioenergy, 34: 67-74. DOI: 10.1016/j.biombioe.2009.09.012
Natarajan, E., A. Nordin and A.N. Rao, 1998. Overview of combustion and gasification of rice husk in flui-dized bed reactors. Biomass Bioenergy, 14: 533-546. DOI: 10.1016/S0961-9534(97)10060-5 Pandya, T.S. and R. Srinivasan, 2012. Effect of hammer
mill retention screen size on fiber separation from corn flour using the Elusieve process. Indus. Crops
Products, 35: 37-43. DOI:
10.1016/j.indcrop.2011.06.003
Petrolia, D.R., 2008. The economics of harvesting and transporting corn stover for conversion to fuel etha-nol: A case study for Minnesota. Biomass
Bioener-gy, 32: 603-612. DOI:
10.1016/j.biombioe.2007.12.012
Pinto, J., D. Cruz, A. Paiva, S. Pereira and P. Tavares et al., 2012. Characterization of corn cob as a possible raw building material. Constr. Buil. Mater., 34: 28-33. DOI: 10.1016/j.conbuildmat.2012.02.014 Pommier, S., D. Chenu, M. Quintard and X. Lefebvre,
2008. Modelling of moisture-dependent aerobic de-gradation of solid waste. Waste Manage., 28: 1188-1200. DOI: 10.1016/j.wasman.2007.05.002 Raveendran, K., A. Ganesh and K.C. Khilart, 1995.
In-fluence of mineral matter on biomass pyrolysis
cha-racteristics. Fuel, 74: 1812-1822.
0016-2361(95)00142-5
Rozainee, M., S.P. Ngo, A.A. Salema, K.G. Tan and M. Ariffin et al., 2008. Effect of fluidising velocity on the combustion of rice husk in a bench-scale fluidised bed combustor for the production of amorphous rice husk ash. Bioresource Technol., 99: 703-713. DOI: 10.1016/j.biortech.2007.01.049 Ryu, C., Y.B. Yang, A. Khor, N.E. Yates and V.N.
Sha-rifi et al., 2006. Effect of fuel properties on biomass combustion: Part I. Experiments-fuel type, equiva-lence ratio and particle size. Fuel, 85: 1039-1046. DOI: 10.1016/j.fuel.2005.09.019
Sangnark, A. and A. Noomhorm, 2004. Chemical, phys-ical and baking properties of dietary fiber prepared from rice straw. Food Res. Int., 37: 66-74. DOI: 10.1016/j.foodres.2003.09.007
Sciban, M., M. Klasnja and B. Skrbic, 2008. Adsorption of copper ions from water by modified agricultural by-products. Desalination, 229: 170-180. DOI: 10.1016/j.desal.2007.08.017
Shinners, K.J., B.N. Binversie, R.E. Muck and P.J. Weimer, 2007. Comparison of wet and dry corn stover harvest and storage. Biomass Bioenergy, 31: 211-221. DOI: 10.1016/j.biombioe.2006.04.007 Sokhansanj, S., A. Turhollow, J. Cushman and J.
Cun-diff, 2002. Engineering aspects of collecting corn stover for bioenergy. Biomass Bioenergy, 23: 347-355. DOI: 10.1016/S0961-9534(02)00063-6 Sokhansanj, S., S. Mani, S. Tagore and A.F. Turhollow,
2010. Techno-economic analysis of using corn stov-er to supply heat and powstov-er to a corn ethanol plant – Part 1: Cost of feedstock supply logistics. Biomass
Bioenergy, 34: 75-81. DOI:
10.1016/j.biombioe.2009.10.001
Su, D., J. Sun, P. Liu and Y. Lu, 2006. Effects of differ-ent pretreatmdiffer-ent modes on the enzymatic digestibil-ity of Corn Leaf and Corn stalk. Chinese J. Chem.
Eng., 14: 796-801. DOI:
10.1016/S1004-9541(07)60014-7
Swierczynski, D., S. Libs, C. Courson and A. Kienne-mann. 2007. Steam reforming of tar rom a biomass gasification process over Ni/olivine catalyst using toluene as a model compound. Applied Catalysis B:
Environ., 74: 211-222. DOI:
10.1016/j.apcatb.2007.01.017
Theerarattananoon, K., F. Xu, J. Wilson, R. Ballard and L. Mckinney et al., 2011. Physical properties of pel-lets made from sorghum stalk, corn stover, wheat straw and big bluestem. Indus. Crops Prod., 33: 325-332. DOI: 10.1016/j.indcrop.2010.11.014
USDA, 2011. World agricultural production archives. United States Department of Agriculture.
Wang, T., J. Yin and Z. Zheng, 2012. Effects of chemi-cal inhomogeneity of corn stalk on solvolysis lique-faction. Carbohydrate Polymers, 87: 2638-2641. DOI: 10.1016/j.carbpol.2011.11.040
Warman, P.R. and K.A. Havard, 1998. Yield, vitamin mineral contents of organically conventionally grown potatoes sweet corn. Agric., Ecosyst.
Envi-ron., 68: 207-216. DOI:
10.1016/S0167-8809(97)00102-3
Zhang, B., D. Cui, M. Liu, H. Gong, Y. Huang, F. Han. 2012. Corn porous starch: Preparation, characteriza-tion and adsorpcharacteriza-tion property. Int. J. Biol.
Macromo-lecules, 50: 250-256. DOI:
10.1016/j.ijbiomac.2011.11.002