Phase Separation and Phase Preferences
in
Pigmented, Impact-Modified, PC/PBT Blends
VOLUME I
by
José Manuel Ribeiro Correia Afonso dos Santos
Submitted in accordance with the requirements for the degree of
Doctor of Philosophy
The University of Leeds
Department of Colour Chemistry
June 2003
This copy has been supplied on the understading that it is copyright material and that no quotation from the thesis may be published without proper acknowledgement.
ACKNOWLEDGEMENTS
I hereby acknowledge the invaluable support of my family and friends. Thank you for accompanying me throughout this endeavour and for your continuous support and understanding.
I am very grateful to my supervisor, Professor Jim Guthrie, for his friendship, guidance and encouragement. I owe a debt of gratitude to my colleagues Karen Fagelman and Carolyn Pearce for their patience and friendship. In addition, I acknowledge the help and collaboration of the members of staff of the Colour Chemistry Department and from the various Departments of the University of Leeds, without whom it would not had been possible to carry out this project.
Also, I am very thankful to the sponsors of this project, General Electric (Plastics), Bergen op Zoom (The Netherlands), for providing the opportunity to carry out this applied research study. I specially acknowledge the invaluable collaborations, discussions and guidance from the GE Plastics European Colour Technology group.
I also acknowledge the staff of the Department of Chemical Engineering of the University of Coimbra, Portugal, particularly Professor Helena Gil, for allowing me to use the facilities available in the Polymeric Materials Research Section.
- iii -
ABSTRACT
Polycarbonate/poly(butylene terephthalate)/impact modifier (PC/PBT/IM) blends are a commercially important type of polymer blend. In recent years, pigmented PC/PBT/IM blends have been produced for specific applications, with particular attention being given to the method of mass coloration. The useful properties of these pigmented blends are determined, to a large extent, by the phase separation and phase preference phenomena that occur in these multi-component polymeric systems. In this study, the thermodynamic origins of the phase separation and phase preferences that exist in pigmented PC/PBT/IM blends have been assessed by means of inverse gas chromatography (IGC). Subsequently, in order to characterise these blends both physically and chemically, and to assess the influence of the pigment (C. I. Pigment Blue 28) on the physical properties, on the mechanical properties, and on the morphology of the blends, several analytical techniques and mechanical tests were used. These analytical techniques and mechanical tests, along with the controlled surface modifications of the pigment (which were achieved by means of a photo-sensitised grafting procedure), allowed for a rationalisation of the interactions that exist between the components of the pigmented blends as encountered in the phase separation, the phase preferences, the physical properties and the mechanical properties of these polymeric systems.
The Lewis acid/base interaction between the major components of these blends has been proven to influence decisively the physical properties and the mechanical properties of the pigmented PC/PBT/IM blends. Phase separation exists in PC/PBT/IM blends as the PBT molecules are preferentially involved in specific intermolecular, and intramolecular, interactions with themselves and other PBT molecules. Partial miscibility between the PC and the PBT has been interpreted on the basis of the Lewis acid/base attraction between these polymers, with contributions from the repulsion effect that exists between the Lewis basic centres in PBT. The impact modifier is shown to interact preferentially with the PC phase rather than with the PBT phase. This is due to the preference of the PBT molecules to interact with PBT molecules and to the strong Lewis base/base repulsion between the impact modifier PMMA shell and the PBT molecules. The fast crystallisation of PBT, favoured by the strong Lewis amphoteric character of this polymer, also contributes to the expulsion of the IM particles, and of the PC, from the PBT domains. The pigment interacts favourably with both the PBT and the PC, but preferentially with the PBT phase. This is because of the Lewis amphoteric properties of C. I. Pigment Blue 28.
- iv -
depends on the magnitude of the molecular weights of PC and of PBT. The influence of the pigment on the physical and mechanical properties of the pigmented blends has both direct and indirect consequences. The direct consequences arise from the physical properties of the pigment (particle size and particle size distribution, surface area) and from the chemical properties of the pigment (inorganic nature, surface chemical composition). In particular, the surface chemical composition and the surface area determine the interaction potential of the pigment with the other components of the PC/PBT/IM blends. The indirect consequences stem from the influence the pigment has on the occurrence of transesterification, on the crystalline properties of PBT, and on the molecular weights of PC and of PBT. The influence of these factors on the physical properties and on the mechanical properties of the pigmented blends has been rationalised.
C. I. Pigment Blue 28 enhances the impact resistance of the blends by means of altering the mechanisms of absorption of the impact energy. The pigment decreases the crystallisation activation energy and increases the rate of crystallisation of PBT. The crystallinity degree is not directly affected by the presence of the pigment. At low loadings, the pigment enhances the transesterification reactions that occur between PC and PBT and the thermal degradation of the molecular weight of PBT. At greater pigment loadings, the pigment particles act as an inhibitor of the transesterification reactions and of the polymer chains thermal scission. The effect that C. I. Pigment Blue 28 has on the transesterification reactions is thought to be due mainly to the thermal conductivity differences between the inorganic pigment particles and the polymers.
TABLE OF CONTENTS
VOLUME I
ACKNOWLEDGEMENTS ... ii
ABSTRACT... iii
TABLE OF CONTENTS ... v
LIST OF FIGURES ... xi
LIST OF TABLES ... xviii
LIST OF ABBREVIATIONS ... xxiii
1. INTRODUCTION... 1
1.1.POLYMER BLENDS AND THE SYSTEM STUDIED... 1
1.2.COMPONENT INTERACTIONS IN POLYMER SYSTEMS... 5
1.2.1. Thermodynamic Requirements for Miscibility in Polymer Blends ... 7
1.2.2. The Solubility Parameter – Relevance to Interactions in Multicomponent Polymeric Systems ... 9
1.2.3. Interaction Parameters from Polymer Solution Theories ... 10
1.2.4. Work of Adhesion and Interfacial Tension ... 11
1.2.5. Inverse Gas Chromatography and Some of Its Uses ... 13
1.2.5.1. IGC and Quantification of Interactions in Multicomponent Polymeric Systems ... 15
1.2.5.2. The use of IGC on the Determination of Flory-Huggins Interaction Parameters and Solubility Parameters ... 17
1.2.5.3. IGC and the Quantification of Lewis Acidity/Basicity Parameters ... 18
1.3.PC/PBTBLENDS... 32
1.3.1. Development of PC/PBT Blends... 32
1.3.2. The PC/PBT Blends Studied in this Project... 33
1.3.2.1. Poly(butylene terephthalate) ... 34
1.3.2.2. Bisphenol A Polycarbonate... 35
1.3.2.3. Impact Modification of PC/PBT Blends... 35
1.3.2.4. Mechanical Properties of PC/PBT Blends ... 37
1.4.1. The Transesterification Reaction between PC and PBT ... 41
1.4.2. Crystallisation Properties of PC/PBT Blends... 46
1.4.3. Phase Separation in PC/PBT Blends ... 48
1.4.4. Phase Preferences in PC/PBT Blends ... 53
1.5.PLASTICS COLORATION... 54
1.6.USES,PROPERTIES, AND CHARACTERISATION OF C.I.PIGMENT BLUE 28(COBALT ALUMINATE)... 57
1.6.1. Uses ... 57
1.6.2. Physical/Chemical Characterisation of Cobalt Aluminate ... 58
1.6.3. Synthesis of Cobalt Aluminate... 59
1.7.SURFACE MODIFICATIONS OF INORGANIC PARTICLES... 60
2. EXPERIMENTAL PROCEDURES ... 65
2.1.COMPOUNDING... 66
2.1.1. Tape Extrusion ... 71
2.2.INJECTION MOULDING... 72
2.3.MECHANICAL TESTING... 73
2.3.1. Izod Notched Impact Testing ... 73
2.3.2. Tensile Testing ... 74
2.3.3. Puncture Impact Testing... 75
2.4.THERMAL ANALYSIS... 76
2.4.1. Differential Scanning Calorimetry ... 76
2.4.2. Thermogravimetric Analysis... 78
2.4.3. Dynamic Mechanical Thermal Analysis ... 78
2.5.MICROSCOPY... 80
2.5.1. Scanning Electron Microscopy/Energy Dispersive X-ray Spectrometry ... 80
2.5.1.1. Scanning Electron Microscopy/Energy Dispersive X-ray Spectrometry on Blends ... 80
2.5.1.2. Scanning Electron Microscopy/ Energy Dispersive X-ray Spectrometry on the Unmodified Pigment and on the Surface-Modified Pigments ... 81
2.5.2. Transmission Electron Microscopy... 81
2.6.INVERSE GAS CHROMATOGRAPHY... 82
2.6.1. Materials Studied and Materials Used in the IGC Analysis... 82
2.6.2. Column Preparation... 82
2.6.3. IGC Experimental Set-Up ... 85
2.6.4. Determination of the Retention Time... 88
2.7.GEL PERMEATION CHROMATOGRAPHY... 89
2.8.PARTICLE SIZING... 90
2.9.RHEOLOGICAL ASSESSMENT (MELT VOLUME RATE) ... 90
2.11.SAMPLE GRINDING... 91
2.12.BETSURFACE AREA DETERMINATION... 91
2.13.SURFACE MODIFICATIONS OF C.I.PIGMENT BLUE 28 ... 92
2.13.1. Materials and Apparatus... 96
2.13.2. Surface Modification Experimental Procedure ... 98
2.13.2.1. Pre-treatment of the Pigment ... 98
2.13.2.2. Treatment of the Pigment with the Photoinitiator... 98
2.13.2.3. Photosensitised Grafting Method and Filtration of the Reaction Medium ... 99
2.13.2.4. Soxhlet Extraction... 100
2.13.2.5. Neutralisation of the MAA-Modified Pigment ... 101
3. RESULTS AND DISCUSSION ... 102
3.1.STUDY OF PHASE SEPARATION AND PHASE PREFERENCES PHENOMENA BY IGC ... 102
3.1.1. Study of the Retention of Probe Molecules on the Support Material... 102
3.1.1.1. Chromosorb® W AW DCMS ... 102
3.1.1.2. Chromosorb® P AW DCMS ... 104
3.1.2. Study of the Reproducibility of Retention Times Determined Using Different IGC Units ... 106
3.1.3. IGC Study of C. I. Pigment Blue 28... 108
3.1.3.1. Preliminary Studies... 108
3.1.3.2. Determination of the Dispersive Component of the Surface Tension ... 110
3.1.3.3. Determination of the Energy, the Enthalpy and the Entropy of Adsorption of Polar Probes ... 113
3.1.3.4. Determination of Ka and Kb... 116
3.1.4. IGC Study of the MBS elastomer (IM) ... 118
3.1.4.1. Preliminary Studies... 118
3.1.4.2. Determination of the Dispersive Component of the Surface Tension ... 119
3.1.4.3. Determination of the Energy, the Enthalpy and the Entropy of Adsorption of Polar Probes ... 121
3.1.4.4. Determination of Ka and Kb... 124
3.1.5. IGC Study of the PC 125... 125
3.1.5.1. Preliminary Studies... 125
3.1.5.2. Determination of the Dispersive Component of the Surface Tension ... 126
3.1.5.3. Determination of the Energy, the Enthalpy and the Entropy of Adsorption of Polar Probes ... 128
3.1.5.4. Determination of Ka and Kb... 130
3.1.6. IGC Study of PBT 195 ... 131
3.1.6.1. Preliminary Studies... 132
3.1.6.3. Determination of the Energy, the Enthalpy and the Entropy of Adsorption of
Polar Probes ... 135
3.1.6.4. Determination of Ka and Kb... 138
3.1.6.5. Determination of the Energy, the Enthalpy, and the Entropy of Adsorption on the Bulk PBT 195 ... 139
3.1.7. IGC Study of PBT 315 ... 144
3.1.7.1. Determination of the Dispersive Component of the Surface Tension ... 144
3.1.7.2. Determination of the Energy, the Enthalpy and the Entropy of Adsorption of Polar Probes ... 146
3.1.7.3. Determination of Ka and Kb... 149
3.1.8. Intermolecular Interactions in Pigmented PC/PBT/IM blends... 150
3.1.8.1. Dispersive Interactions in Pigmented PC/PBT/IM blends... 152
3.1.8.2. Specific Interactions in Pigmented PC/PBT/IM blends... 153
3.2.INFLUENCE OF C.I.PIGMENT BLUE 28 ON THE PHYSICAL PROPERTIES AND ON THE MECHANICAL PROPERTIES OF PC/PBT/IMBLENDS... 159
3.2.1. Gel Permeation Chromatography... 159
3.2.2. Differential Scanning Calorimetry ... 164
3.2.2.1. Heating Mode... 164
3.2.2.2. Cooling Mode ... 171
3.2.3. Dynamic Mechanical Thermal Analysis ... 177
3.2.4. Vicat Softening Temperature ... 190
3.2.5. Thermogravimetric Analysis... 192
3.2.6. Izod Notched Impact Testing ... 193
3.2.7. Puncture Impact Testing... 200
3.2.8. Tensile Testing ... 202
3.2.9. Rheological Assessment (Melt Volume Rate) ... 214
3.2.10. Transmission Electron Microscopy... 216
3.3.SURFACE MODIFICATIONS OF C.I.PIGMENT BLUE 28 ... 220
3.3.1. Assessment of the Surfaces Interaction Potential by IGC... 220
3.3.1.1. Determination of the Dispersive Component of the Surface Tension ... 220
3.3.1.2. Determination of the Energy, Enthalpy and Entropy of Adsorption of Polar Probes... 222
3.3.1.3. Consequences of the Surface Modifications to the Intermolecular Interactions Potential of the Pigments ... 224
3.3.2. SEM/EDXA on the Unmodified C. I. Pigment Blue 28 and on the Modified C. I. Pigment Blue 28 ... 227
3.3.3. Determination of the pH of Dispersions of the Unmodified and Modified Pigments in Water ... 230
3.3.4. Thermogravimetric Analysis... 231
3.3.6. Titration of the Carboxylic Acid Groups Fixed to the Surface of the Modified
Pigments ... 232
3.3.7. Particle Sizing of the Unmodified Pigment and of the Modified Pigments ... 233
3.4.INFLUENCE OF THE SURFACE MODIFICATIONS OF C.I.PIGMENT BLUE 28 ON THE PHYSICAL PROPERTIES AND ON THE MECHANICAL PROPERTIES OF PC/PBT/IMBLENDS.. 234
3.4.1. Gel Permeation Chromatography... 234
3.4.2. Differential Scanning Calorimetry ... 236
3.4.2.1. Heating Mode... 236
3.4.2.2. Cooling Mode ... 238
3.4.3. Dynamic Mechanical Thermal Analysis ... 241
3.4.4. Vicat Softening Temperature ... 246
3.4.5. Izod Notched Impact Testing ... 246
3.4.6. Puncture Impact Testing... 249
3.4.7. Tensile Testing ... 249
3.4.8. Rheological Assessment (Melt Volume Rate) ... 252
3.4.9. Scanning Electron Microscopy/EDXA ... 254
3.4.10. Transmission Electron Microscopy/Photography Imaging ... 259
4. GENERAL DISCUSSION OF RESULTS... 266
5. CONCLUSIONS ... 284
6. REFERENCES... 290
VOLUME II
APPENDIX A. ERROR PROPAGATION IN IGC CALCULATIONS... 1
APPENDIX B. TABLES CONCERNING IGC ... 2
APPENDIX C. FIGURES CONCERNING DSC STUDIES... 43
APPENDIX D. FIGURES CONCERNING TGA STUDIES... 71
APPENDIX E. FIGURES CONCERNING EDXA STUDIES ... 77
APPENDIX F. FIGURES CONCERNING DMTA STUDIES... 80
APPENDIX G. IZOD NOTCHED IMPACT TEST INFORMATION ... 84
APPENDIX H. TENSILE TEST INFORMATION... 85
APPENDIX I. DYNAMIC MECHANICAL THERMAL ANALYSIS INFORMATION ... ... 86
APPENDIX J. RHEOLOGICAL ASSESSMENT (MELT VOLUME RATE) INFORMATION... 89
LIST OF FIGURES
Figure 1-1. Repeating unit in poly(butylene terephthalate) and in bisphenol A polycarbonate...4
Figure 1-2. Spinel structure of C. I. Pigment Blue 28 (CoAl2O4) ...5
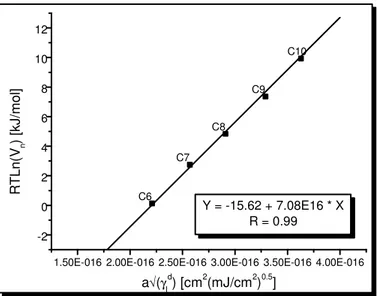
Figure 1-3. Typical Fowkes plot. Energy of adsorption (RTln(Vg)) versus a× γld of n-alkanes
and polar probes on the surface of C. I. Pigment Blue 28, at T = 313 K...26
Figure 2-1. Cross section of an extruder ...66
Figure 2-2. Hoppers system in extruder E1...69
Figure 2-3. Tape-extruder (on the left-hand side) and detail of the die (on the right-hand side) used for the production of samples...72
Figure 2-4. Cross section of an injection moulder...73
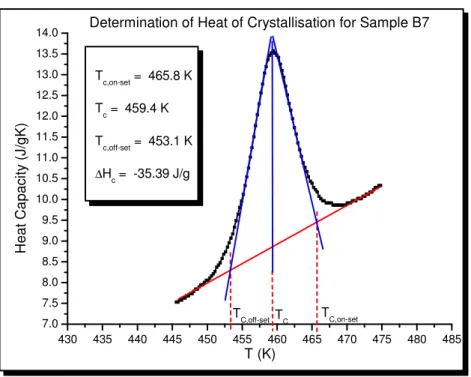
Figure 2-5. Graphical procedure for the determination of the crystallisation properties of the samples...77
Figure 2-6. Sample clamped in the bending mode...79
Figure 2-7. Exemplification of an asymmetric peak and determination of the retention time using the Condor and Young method...88
Figure 2-8. Typical IGC chromatogram...89
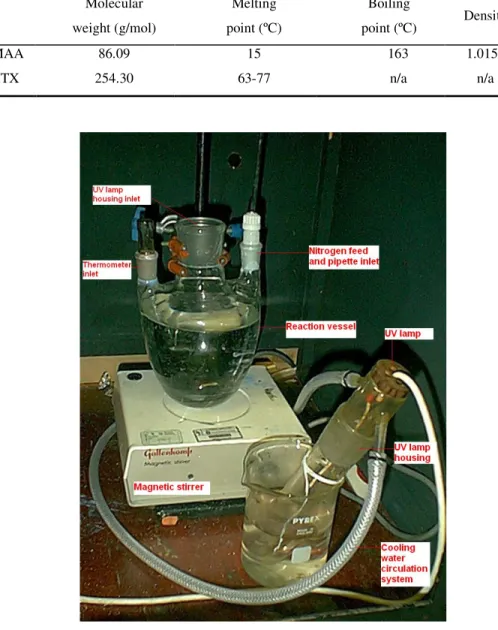
Figure 2-9. Structure of the photoinitiator, ITX (on the left-hand side), and of the monomer, MAA (on the right-hand side)...93
Figure 2-10 Activation of the photoinitiator (ITX) molecule by UV light (schematic)...94
Figure 2-11. Complex formation between the excited state of the photoinitiator molecules and the surface OH groups of the pigment, leading to the formation of surface radical species (schematic)...94
Figure 2-12. Initiation of polymerisation of the methacrylic acid monomer units by the surface oxy-radicals (schematic)...94
Figure 2-13. Experimental set-up relating to the photosensitised grafting reaction...97
Figure 3-1. Energy of adsorption versus d l
a× γ for n-alkanes and polar probes on the surface of
Figure 3-2. Energy of adsorption versus d l
a× γ for n-alkanes and polar probes on the surface of
Chromosorb® P AW DCMS, at T = 353 K...106
Figure 3-3. Energy of adsorption versus d l
a× γ of n-alkanes on the surface of Chromosorb® W
AW DCMS , at T = 313 K...107
Figure 3-4. Influence of the carrier gas flow rate on the energy of adsorption of n-decane on the surface of C. I. Pigment Blue 28...108
Figure 3-5. Energy of adsorption of n-decane versus pigment mass on the stationary phase...109
Figure 3-6. Energy of adsorption versus d l
a× γ of n-alkanes and polar probes on the surface of
C. I. Pigment Blue 28, at T = 313 K...111
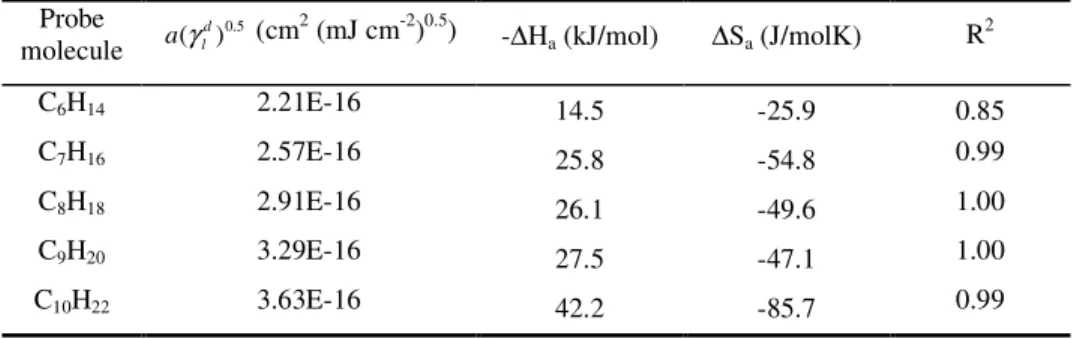
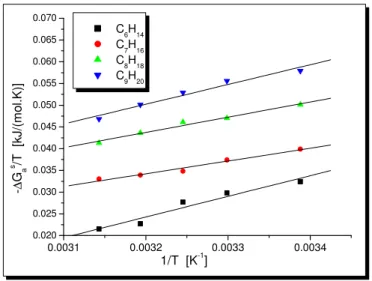
Figure 3-7. Determination of the enthalpy, and of the entropy, of adsorption of the n-alkanes on the surface of C. I. Pigment Blue 28...112
Figure 3-8. Determination of the specific component of the enthalpy, and of the entropy, of adsorption of polar probes on the surface of C. I. Pigment Blue 28...115
Figure 3-9. Determination of Ka and Kb of the surface of C. I. Pigment Blue 28...117
Figure 3-10. Effect of the carrier gas flow rate, and of the MBS rubber loading on the support material, on the value of the energy of adsorption of n-octane...118
Figure 3-11. Energy of adsorption versus d l
a× γ for n-alkanes and polar probes on the surface
of the MBS rubber, at T = 333 K...119 Figure 3-12. Repeating unit in poly(methyl methacrylate)...120
Figure 3-13. Determination of the enthalpy, and of the entropy of adsorption of n-alkanes on the surface of the MBS rubber...121
Figure 3-14. Determination of the specific component of the enthalpy, and of the entropy of adsorption of polar probes on the surface of the MBS rubber...123
Figure 3-15. Determination of Ka and Kb of the surface of the MBS rubber...124
Figure 3-16. Effect of the carrier gas flow rate, and of the PC 125 loading on the support material, on the value of the energy of adsorption of n-hexane...125
Figure 3-17. Energy of adsorption versus d l
a× γ for n-alkanes and for polar probes on the
Figure 3-19. Determination of the specific component of the enthalpy and of the entropy of adsorption, of polar probes on the surface of PC 125...130
Figure 3-20. Determination of the Ka and of the Kb of the surface of PC 125...131
Figure 3-21. Influence of the carrier gas flow rate on the energy of adsorption of n-decane on the surface of PBT 195...132
Figure 3-22. Energy of adsorption versus d l
a× γ for n-alkanes and polar probes on the surface
of PBT 195, at T = 295 K...133
Figure 3-23. Determination of the enthalpy and of the entropy of adsorption of n-alkanes, on the surface of PBT 195...134
Figure 3-24. Determination of the specific component of the enthalpy and of the entropy of adsorption, of polar probes on the surface of PBT 195...136
Figure 3-25. Determination of the Ka and of the Kb of the surface of PBT 195...139
Figure 3-26. Determination of the energy of adsorption of n-octane, of TCM, and of THF on the bulk PBT 195, at zero carrier gas flow rate...141
Figure 3-27. Extrapolated value of the energy of adsorption versus d l
a× γ for n-alkanes and
polar probes on the bulk PBT 195, at T = 353 K...141
Figure 3-28. Comparison of the specific component of the energy of adsorption of the polar probes on the bulk PBT 195 (at 353 K) and on the surface of PBT 195 (at 295 K)...142
Figure 3-29. Energy of adsorption versus d l
a× γ for n-alkanes and polar probes on the surface
of PBT 315, at T = 295 K...144 Figure 3-30. Determination of the enthalpy and of the entropy of adsorption of n-alkanes, on the surface of PBT 315...145
Figure 3-31. Comparison of the specific component values of the energy of adsorption of the polar probes on the surface of PBT 195 with those relating to the surface of PBT 315, at 295 K...147
Figure 3-32. Determination of the specific component of the enthalpy and of the entropy of adsorption, of polar probes on the surface of the PBT 315...148
Figure 3-33. Comparison of the specific component values of the enthalpy of adsorption of the polar probes on the surface of PBT 195 with those relating to the surface of PBT 315...149
Figure 3-34. Determination of the Ka and of the Kb of the surface of PBT 315...149
Figure 3-36. Comparison of the specific component of the enthalpy of adsorption of DCM and of THF on the surface of the materials studied. ∆Has for PBT 195 and for PBT 315, -∆Has for the remaining materials...154
Figure 3-37. Comparison of the values of the Ka and of the Kb for the surface of the materials
studied...155
Figure 3-38. Weight-average molecular weight, number-average molecular weight and polydispersity of PC and of PBT in samples of Sets 1, 2 and 7...159
Figure 3-39. Weight-average molecular weight, number-average molecular weight and polydispersity of PC and of PBT in samples of Sets 2, 3 and 4...163
Figure 3-40. First scan melting temperature, second scan melting temperature and melting temperature variation from the first scan to the second scan, as a function of the pigment loading in samples of Sets 1, 2 and 7...167
Figure 3-41. Non-isothermal crystallisation temperature, and T, versus C. I. Pigment Blue 28 loading for samples of the PC/PBT/IM blends represented by Sets 1, 2, 3 and 7...172
Figure 3-42. Enthalpy of crystallisation, and degree of crystallinity, versus C. I. Pigment Blue 28 loading for samples of the pigmented PC/PBT/IM blends represented by Sets 1, 2, 3 and 7...173
Figure 3-43. Non-isothermal crystallisation temperature and enthalpy of crystallisation versus
PBT 315 loading in samples of PBT granulate...174
Figure 3-44. Loss modulus, loss tangent and storage modulus versus temperature, for the blend sample and samples that mimic the PBT-rich phase and the PC-rich phase...179
Figure 3-45. Loss modulus, loss tangent and storage modulus versus temperature, for the samples that mimic the PBT-rich phase and the PC-rich phase, PBTX and PCX, respectively...182
Figure 3-46. Loss modulus, loss tangent and storage modulus versus temperature, for samples of increasing pigment loading processed using extruder E1 (Set 2)...183
Figure 3-47. Loss modulus, loss tangent and storage modulus versus temperature, for the samples of increasing pigment loading processed using extruder E2 (Set 7)...185
Figure 3-48. Loss modulus, loss tangent and storage modulus versus temperature, for samples BX and LX, processed in extruder E1 and E2, respectively...189
Figure 3-49. Vicat softening temperature as a function of pigment loading for samples of Sets 1, 2, 3, 4 and 7...191
Figure 3-51. Izod impact testing results, as a function of test temperature and pigment loading, for samples of Sets 2 and 7...197
Figure 3-52. Variation of the notched Izod impact energy absorption for samples of Sets 2, 3 and 4, as a function of pigment loading and test temperature...197
Figure 3-53. Puncture energy and energy at maximum force as a function of the pigment loading, for samples of Sets 1, 2 and 7...200
Figure 3-54. Puncture energy and energy at maximum force as a function of the pigment loading for samples of Sets 2, 3 and 4...201
Figure 3-55. Tensile modulus and strain at break as a function of C. I. Pigment Blue 28 loading, for samples of Sets 2, 3 and 4...203
Figure 3-56. Stress at break, strain at yield and stress at yield as a function of C. I. Pigment Blue 28 loading, for samples of Sets 2, 3 and 4...206
Figure 3-57. Tensile modulus and strain at break as a function of C. I. Pigment Blue 28 loading, for samples of Sets 1, 2 and 7...208
Figure 3-58. Stress at break, strain at yield and stress at yield as a function of C. I. Pigment Blue 28 loading, for samples of Sets 1, 2 and 7...212
Figure 3-59. Melt volume rate as a function of the pigment loading for samples of Sets 1, 2, 3, 4 and 7...214
Figure 3-60. TEM image of the PC/PBT/IM blend corresponding to unpigmented blend BX...216
Figure 3-61. TEM images of samples of the blends processed in extruder E2 (Set 7)...217
Figure 3-62. TEM images of blend samples pigmented with 0.30 % C. I. Pigment Blue 28 loading, processed in different extruders...218
Figure 3-63. TEM images of blend samples (B6 and B9), processed in extruder E2...219
Figure 3-64. TEM images of blend samples (BX, B6 and B9), processed in extruder E2...219
Figure 3-65. Comparison of the specific component of the energy of adsorption of DCM and of THF on the unmodified pigment and on the surface-treated pigments, at 353 K...225
Figure 3-66. Comparison of the specific component of the enthalpy of adsorption of DCM and of THF on the unmodified pigment and on the surface-treated pigments...226
Figure 3-67. SEM imaging of aqueous dispersions of the unmodified pigment and of the surface-treated C. I. Pigment Blue 28...228
Figure 3-69. Weight-average molecular weight, number-average molecular weight and polydispersity of PC and of PBT in samples of Sets 1, 2, 5 and 6...235
Figure 3-70. Melting temperature, second scan melting temperature and Tm variation from the
first scan to the second scan, as a function of the pigment loading in the PC/PBT/IM blends represented by Sets 1, 2, 5 and 6...237
Figure 3-71. Non-isothermal crystallisation temperature and T, versus pigment loading for samples of the PC/PBT/IM blends represented by Sets 1, 2, 5 and 6...239
Figure 3-72. Enthalpy of crystallisation and degree of crystallinity, versus pigment loading for samples of the pigmented PC/PBT/IM blends represented by Sets 1, 2, 5 and 6...241
Figure 3-73. Loss modulus, loss tangent and storage modulus versus temperature, for the unpigmented blend, and pigmented blend samples relating to unmodified and modified pigments...242
Figure 3-74. Loss modulus, loss tangent and storage modulus versus temperature, for samples of increasing pigment loading relating to Set 5...243
Figure 3-75. Loss modulus, loss tangent and storage modulus versus temperature, for samples of increasing pigment loading relating to Set 6...245
Figure 3-76. Vicat softening temperature as a function of pigment loading for samples of Sets 1, 2, 5 and 6...247
Figure 3-77. Variation of the notched Izod impact energy absorption for samples of Sets 1, 2, 5 and 6, as a function of pigment loading and test temperature...247
Figure 3-78. Izod impact testing results, as a function of test temperature and pigment loading, for samples of Sets 5 and 6...248
Figure 3-79. Puncture energy and energy at maximum force as a function of the pigment loading, for samples of Sets 1, 2, 5 and 6...249
Figure 3-80. Tensile modulus and strain at break as a function of pigment loading, for samples of Sets 1, 2, 5 and 6...250
Figure 3-81. Stress at break, strain at yield and stress at yield as a function of pigment loading, for samples of Sets 1, 2, 5 and 6...251
Figure 3-82. Melt volume rate as a function of the pigment loading, for samples of Sets 1, 2, 5 and 6...252
Figure 3-83. SEM images of tape-extruded, DCM-extracted, sample of unpigmented blend (BX)...254
Figure 3-84. SEM/EDX images of tape-extruded, DCM-extracted, sample of blend B10...255
Figure 3-86. SEM/EDX images of tape-extruded, DCM-extracted, sample of blend B22...257
Figure 3-87. SEM/EDX images of tape-extruded, DCM-extracted, sample of blend B27...259
Figure 3-88. SEM/EDX images of tape-extruded, DCM-extracted, samples of blends B10, B22 and B27, at a magnification level of x20000...259
Figure 3-89. TEM images of tape-extruded samples of blends BX, B9, B22 and B27, prior to DCM extraction of PC, at a scale of 1.0 m………...260
Figure 3-90. TEM images of tape-extruded samples of blends BX, B9, B22 and B27, prior to DCM extraction of PC, at a scale of 0.5 m...261
Figure 3-91. TEM images of tape-extruded samples of blends BX, B10, B22 and B27, after extraction of PC with DCM. The red circles indicate the location of pigment particles...262
Figure 3-92. TEM images of tape-extruded samples of blends BX, B10, B22 and B27, after extraction of PC with DCM, at a greater magnification than in Figure 3-91...263
Figure 3-93. TEM images of tape-extruded sample of blend B22, after extraction of PC with DCM, at a greater magnification than was represented in Figure 3-92...264
LIST OF TABLES
Table 1-1. Values of a(
γ
ld)0..5for several n-alkanes (Schultz and Lavielle 1989; Riddle andFowkes 1990; Kamdem et al. 1993)...23
Table 1-2. Values of DN and AN*, of the surface area, and of 0..5
) ( d l aγ for the polar probes used in the present study (Schultz and Lavielle 1989; Riddle and Fowkes 1990; Kamdem et al. 1993; Mukhopadhyay and Schreiber 1994; Belgacem 1995; Chtourou et al. 1995)...28
Table 1-3. Value of Isp3, for the acid/base interaction potential of a hypothetical material with itself. Values of Ka and Kb are given only as an example...30
Table 1-4. Crystallographic data and magnetic nature of CoAl2O4 (Busca et al. 1991; Wu and Mai 1993; O'Neill 1994)...59
Table 2-1. Some characteristics of the C. I. Pigment Blue 28 studied...67
Table 2-2. Weight-average molar mass (MW __ ), polydispersity (D), and number-average molar mass (Mn __ ), of PC and of PBT, and Tg and Tm of the PC, of the PBT and of the IM...68
Table 2-3. Carboxyl end-group concentration, and hydroxyl end-group concentration, of PBT 315 and of PBT 195, determined by FTIR. Source: GE Plastics, Bergen op Zoom, The Netherlands...68
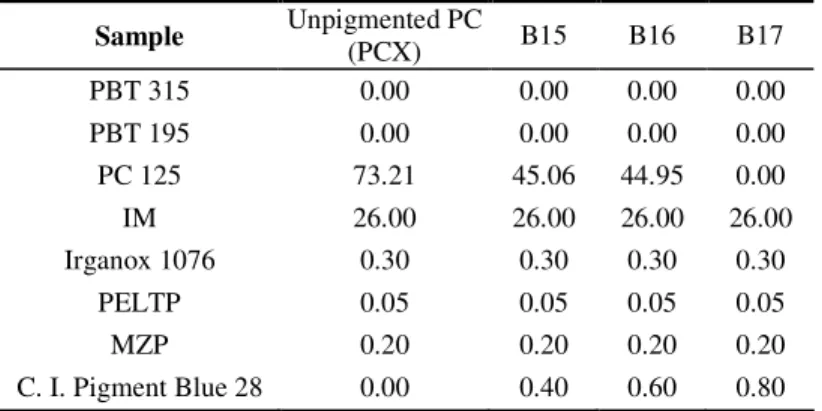
Table 2-4. Summary of formulations (% w/w) extruded using extruder E1, Set 1...69
Table 2-5. Summary of formulations (% w/w) extruded using extruder E1, Set 2...69
Table 2-6. Summary of formulations (% w/w) extruded using extruder E1, Set 3...69
Table 2-7. Summary of formulations (% w/w) extruded using extruder E1, Set 4...70
Table 2-8. Summary of formulations (% w/w) extruded using extruder E1, Set 5...70
Table 2-9. Summary of formulations (% w/w) extruded using extruder E1, Set 6...70
Table 2-10. Summary of formulations (% w/w) extruded using extruder E2, Set 7...71
Table 2-11. Dimensions of the tensile testing specimen...75
Table 2-12. IGC columns analysed...85
Table 2-14. Selected properties of the monomer (MAA) and of the photoinitiator (ITX), from technical data sheets...97
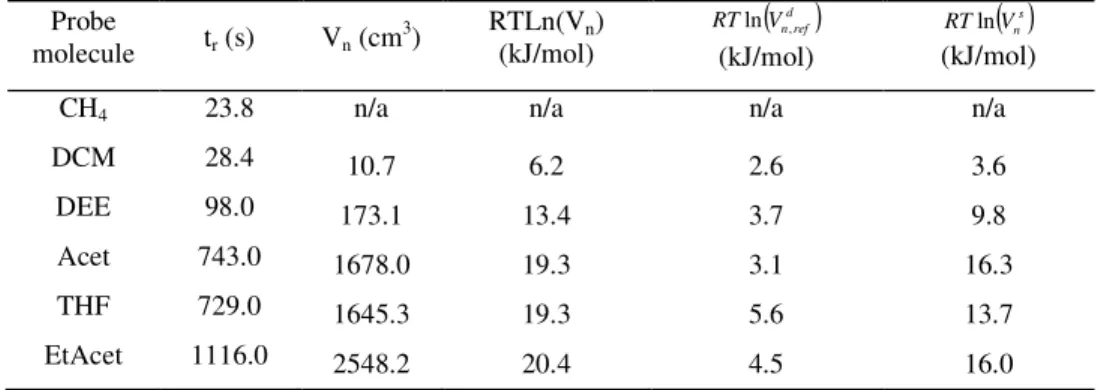
Table 3-1. Retention time, tr, net retention volume, Vn, energy of adsorption, RTLn(Vn), and
corresponding dispersive and specific components, RTln(Vdn,ref) and RTln(V s
n), respectively, for
the n-alkanes and polar probes on the surface of Chromosorb® W AW DCMS, at T = 313 K...103
Table 3-2. Retention time, tr, net retention volume, Vn, energy of adsorption, RTLn(Vn), and
corresponding dispersive and specific components, RTln(Vdn,ref) and RTln(Vsn), respectively, for
the n-alkanes and polar probes on the surface of Chromosorb® P AW DCMS, at T = 353 K...105
Table 3-3. Dispersive component of the surface free energy of Chromosorb® W AW DCMS, at 313 K...107
Table 3-4. Retention time, tr, specific retention volume, Vg, and energy of adsorption,
RTLn(Vg), of n-alkanes on the surface of C. I. Pigment Blue 28, at T = 313 K, F = 18.22
cm3/min, J = 0.85, C = 0.98, Pin = 133.53 kPa, Pout = 99.06 kPa, and Tflow meter = 290 K...110
Table 3-5. Values of the dispersive component of the surface tension, d s
γ , for the surface of C. I. Pigment Blue 28...111
Table 3-6. Enthalpy of adsorption, ∆Ha, and entropy of adsorption, ∆Sa, of the n-alkanes on the
surface of C. I. Pigment Blue 28...113
Table 3-7. Retention time, tr, specific retention volume, Vg, energy of adsorption, RTLn(Vg),
and corresponding dispersive and specific components, RTln(Vdg,ref) and RTln(Vsg),
respectively, for the adsorption of polar probes on the surface of C. I. Pigment Blue 28, at T = 313 K, F = 21.77 cm3/min, J = 0.85, C = 0.98, Pin = 134.31 kPa, Pout = 99.84 kPa, and Tflow meter =
291 K...114
Table 3-8. Dispersive and specific components of the enthalpy of adsorption, and of the entropy of adsorption, ∆Hda, ∆Hsa and ∆Sda, ∆Ssa, respectively, of the polar probes, on the surface of C. I.
Pigment Blue 28...115
Table 3-9. Values of the dispersive component of the surface tension of the MBS rubber...120
Table 3-10. Enthalpy of adsorption, ∆Ha, and entropy of adsorption, ∆Sa, of the n-alkanes on
the surface of the MBS rubber...121
Table 3-11. Retention time, tr, specific retention volume, Vg, energy of adsorption, RTLn(Vg),
and corresponding dispersive and specific components, RTln(Vdg,ref) and RTln(V s
g),
respectively, for the adsorption of polar probes on the surface of the MBS rubber, at T = 333 K, F = 35.29 cm3/min, J = 0.86, C = 0.97, Pin = 131.87 kPa, Pout = 100.16 kPa, and Tflow meter = 296
K...122
Table 3-12. Dispersive and specific components of the enthalpy of adsorption, and of the entropy of adsorption, ∆Hda, ∆H
s
a and ∆S d
a, ∆S s
a, respectively, for the adsorption of polar probes
Table 3-13. Values of the dispersive component of the surface tension of PC 125, determined in the present study and from literature...127
Table 3-14. Enthalpy of adsorption, ∆Ha, and entropy of adsorption, ∆Sa, of the n-alkanes on
the surface of PC 125...128
Table 3-15. Retention time, tr, specific retention volume, Vg, energy of adsorption, RTLn(Vg),
and corresponding dispersive and specific components, RTln(Vdg,ref) and RTln(V s
g),
respectively, relating the adsorption of the polar probes on the surface of PC 125, at T = 353 K, F = 47.40 cm3/min, J = 0.92, C = 0.98, Pin = 118.47 kPa, Pout = 101.24 kPa, and Tflow meter = 291
K...129
Table 3-16. Dispersive and specific components of the enthalpy of adsorption and of the entropy of adsorption, ∆Hda, ∆Hsa and ∆Sda, ∆Ssa, respectively, of the polar probes on the surface
of PC 125...129
Table 3-17. Values of the dispersive component of the surface tension of PBT 195...133
Table 3-18. Enthalpy of adsorption, ∆Ha, and entropy of adsorption, ∆Sa, of the n-alkanes on
the surface of PBT 195...135
Table 3-19. Retention time, tr, specific retention volume, Vg, energy of adsorption, RTLn(Vg),
and corresponding dispersive and specific components, RTln(Vdg,ref) and RTln(V s
g),
respectively, for the adsorption of polar probes on the surface of PBT 195, at T = 295 K, F = 11.94 cm3/min, J = 0.95, C = 0.97, Pin = 111.59 kPa, Pout = 101.25 kPa, and Tflow meter = 295
K...135
Table 3-20. Dispersive and specific components of the enthalpy of adsorption and of the entropy of adsorption, ∆Hda, ∆H
s
a and ∆S d
a, ∆S s
a, respectively, of the polar probes, on the
surface of PBT 195...136
Table 3-21. Energy of adsorption at zero flow rate, RTLn(Vg), and corresponding dispersive
and specific components, RTln(Vdg,ref) and RTln(V s
g), respectively, for the bulk PBT 195, at T =
353 K...142
Table 3-22. Enthalpy of adsorption, ∆Ha, and entropy of adsorption, ∆Sa, of TCM and of THF
on the bulk PBT 195...143
Table 3-23. Values of the dispersive component of the surface tension of PBT 315...145
Table 3-24. Enthalpy of adsorption, ∆Ha, and entropy of adsorption, ∆Sa, of the n-alkanes on
the surface of PBT 315...146
Table 3-25. Retention time, tr, specific retention volume, Vg, energy of adsorption, RTLn(Vg),
and corresponding dispersive and specific components, RTln(Vdg,ref) and RTln(Vsg),
respectively, for the adsorption of the polar probes on the surface of PBT 315, at T = 295 K, F = 11.94 cm3/min, J = 0.97, C = 0.98, Pin = 108.13 kPa, Pout = 101.24 kPa, and Tflow meter = 291
Table 3-26. Dispersive and specific components of the enthalpy of adsorption and of the entropy of adsorption, ∆Hda, ∆H
s
a and ∆S d
a, ∆S s
a, respectively, of the polar probes, on the
surface of PBT 315...148
Table 3-27. Carboxyl end-group concentration, hydroxyl end-group concentration (source: GE Plastics, Bergen op Zoom, The Netherlands), and Ka and Kb, for PBT 195 and for PBT
315...150
Table 3-28. Values of d s
γ (mJ/m2) determined for the surface of C. I. Pigment Blue 28, of the MBS rubber, of PC 125, of PBT 195, and of PBT 315...152
Table 3-29. Values of the crystallisation on-set temperature (Tc,on-set), the crystallisation off-set
temperature (Tc, off-set), the difference between Tc,on-set and Tc, off-set ( T), the crystallisation
temperature (Tc) and the enthalpy of crystallisation (- Hc), relating to samples of Sets 1, 2, 3
and 7...172
Table 3-30. Values of the decomposition temperature of the pigmented blends processed in extruder E2...192
Table 3-31. Ductile to brittle fracture mechanism transition temperature for samples of Set 7...194
Table 3-32. Percent ductility of samples of Set 7...202
Table 3-33. Values of the dispersive component of the surface tension, d s
γ (mJ/m2), for the surfaces of the unmodified and surface-modified pigments...221
Table 3-34. Enthalpy of adsorption, ∆Ha, and entropy of adsorption, ∆Sa, of the n-alkanes on
the surface-modified pigment (hiwre)...222
Table 3-35. Enthalpy of adsorption, ∆Ha, and entropy of adsorption, ∆Sa, of the n-alkanes on
the surface-modified pigment (hiwren)...222
Table 3-36. Retention time, tr, specific retention volume, Vg, energy of adsorption, RTLn(Vg),
and corresponding dispersive and specific components, RTln(Vdg,ref) and RTln(Vsg),
respectively, for the surface-modified pigment (hiwre), at T = 353 K, F = 17.95 cm3/min, J = 0.93, C = 0.98, Pin = 113.94 kPa, Pout = 100.15 kPa, Tflow meter = 294 K...223
Table 3-37. Retention time, tr, specific retention volume, Vg, energy of adsorption, RTLn(Vg),
and corresponding dispersive and specific components, RTln(Vdg,ref) and RTln(Vsg),
respectively, for the surface-modified pigment (hiwre), at T = 353 K, F = 85.71 cm3/min, J = 0.77, C = 0.97, Pin = 157.04 kPa, Pout = 100.16 kPa, Tflow meter = 295 K...223
Table 3-38. Retention time, tr, specific retention volume, Vg, energy of adsorption, RTLn(Vg),
and corresponding dispersive and specific components, RTln(Vdg,ref) and RTln(Vsg),
Table 3-39. Retention time, tr, specific retention volume, Vg, energy of adsorption, RTLn(Vg),
and corresponding dispersive and specific components, RTln(Vdg,ref) and RTln(V s
g),
respectively, for the surface-modified pigment (hiwren), at T = 353 K, F = 78.62 cm3/min, J = 0.80, C = 0.98, Pin = 148.42 kPa, Pout = 100.15 kPa, Tflow meter = 294 K...223
Table 3-40. Dispersive and specific components of the enthalpy of adsorption and of the entropy of adsorption, ∆Hda, ∆H
s
a and ∆S d
a, ∆S s
a, respectively, of the polar probes, on the
surface of the surface-modified pigment (hiwre)...224
Table 3-41. Dispersive and specific components of the enthalpy of adsorption and of the entropy of adsorption, ∆Hda, ∆Hsa and ∆Sda, ∆Ssa, respectively, of the polar probes, on the
surface of the surface-modified pigment (hiwren)...224
Table 3-42. Percentage of carbon, aluminium, cobalt and oxygen elements present at the surface of the unmodified and surface-modified pigments, as determined by EDXA...229
Table 3-43. Effectiveness of the surface treatment of C. I. Pigment Blue 28 as quantified by the pH of aqueous dispersions of the pigments...230
Table 3-44. Weight losses of the photoinitiator (ITX), PMMA, and pigments (C. I. Pigment Blue 28 and surface-modified versions: hiwre and hiwren), after heat treatment at 600 ºC for 30 minutes...231
Table 3-45. Average particle size and 95 % limits of the particle size distribution of the control samples and of the surface-modified pigments...233
Table 3-46. Values of the crystallisation on-set temperature (Tc,on-set), the crystallisation off-set
temperature (Tc, off-set), the difference between the latter ( T), the crystallisation temperature (Tc)
LIST OF ABBREVIATIONS
PC – Polycarbonate
PBT – Poly(butylene terephthalate) IM – impact modifier
MBS – methyl methacrylate-butadiene-styrene PE – poly(ethylene)
PVC – poly(vinyl chloride) PET – poly(ethylene terephthalate) EVA – ethylene-vinyl acetate copolymer
LLDPE – low pressure, low-density poly(ethylene) EPR – ethylene-propylene rubber
EPDM – ethylene-propylene-diene rubber NBR – nitrile rubber
PMMA – poly(methyl methacrylate) MMA – methyl methacrylate PS – poly(styrene)
MAA – methacrylic acid TEA – triethylaluminium
PELTP – [pentaerythritol tetrakis(3-n-dodexyl thiopropionate)] MZP – monozinc phosphate
DCM – dichloromethane DEE – diethyl ether THF – tetrahydrofuran Acet – acetone EtAcet – ethyl acetate
hiwre – “Lewis acidic” pigment hiwren – “neutralized” hiwre pigment LCST – lower critical solution temperature UCST – upper critical solution temperature IGC – inverse gas chromatography
GC – gas chromatography
GPC – gel permeation chromatography
DMTA – dynamic mechanical thermal analysis DTA – dynamic thermal analysis
DMA – dynamic mechanical analysis DSC – Differential scanning calorimetry TGA – thermogravimetric analysis SEM – scanning electron microscopy TEM – transmission electron microscopy OM – optical microscopy
FTIR – Fourier transform infra-red spectroscopy NMR – nuclear magnetic resonance (spectroscopy) WAXS – wide angle X-ray scattering
XRD – X-ray difraction
EDX – Energy Dispersive X-ray Spectrometry MAI – multi-axial impact
MVR – melt volume rate
1. INTRODUCTION
1.1. Polymer Blends and the System Studied
Polymer blends, by definition, are physical mixtures of structurally different homopolymers or copolymers. In polyblends or polymer alloys, the mixing of two or more polymers leads to a new material with its own characteristic set of properties. The constituent polymers adhere together through the action of secondary bond forces only. In favourable cases, multiphase systems can display an interesting synergism of properties. The properties of immiscible and partially miscible blends are highly sensitive to their morphology: phase separation, (that is miscibility, connectivity and sizes of the phases, interface thickness), and phase preferences. These in turn strongly depend on the interactions between the blend components and on the processing conditions. Most polymers are mutually immiscible from the thermodynamic standpoint since the entropic contribution to the free energy of mixing is negligible (Delimoy et al. 1988; Favis 1991; Lyngaae-Jorgensen 1993; Al Saigh 1997b; Liang et al. 2000; Ryan 2002). Hence, most commercial polymer blends are multiphase systems.
Polymer alloys and polymer blends have been known since the 1940’s. Such polymer alloys represent one of the faster growing sectors of the plastics industry (Utracki et al. 1989; Keskula and Paul 1994). In the recent past, research into polymer blends has increased significantly with more than 4500 patents being produced annually world-wide. In the 1980-1990 decade, the use of polymer blends in the market place was growing at approximately 10-15 % per year (Fayt 1989) compared to a growth of 4 % for all plastics (Favis 1991). The primary uses of polymer blends are in the automotive and business machine applications.
Blends can result in completely new materials that exhibit high degrees of synergism compared to the properties of the single components. In other cases, blends serve as materials with optimal cost/performance behaviour. Blending has several important economic advantages as it can: a) generate a material with unique properties and/or processability, b) extend the performance of expensive polymers, c) allow for the quick modification of performance, d) increase plant capacity since most polymer blends are processed on standard processing equipment, and e) be achieved through low capital investment and be accomplished much more rapidly than would developing a totally new polymer (Al Saigh and Chen 1991; Favis 1991; Mishra and Venkidusamy 1995). The major physical properties that are targeted for improvements in blending are: impact strength > heat deflection > cost/processability (Favis 1991).
stabilisers, plasticizers, organic/inorganic pigments, other polymers to form blends and alloys, and reinforcing fibres to formulate high-performance material composites. Not infrequently, these additives are used in combination, thereby further complicating the composition of interfaces and their potential for interaction.
Particulate fillers, including glass beads and mineral fillers such as silicates, metal flakes and talc, are generally added to improve stiffness and compressive strength and to reduce shrinkages and the cost of the material. In most cases, the addition of these fillers tends to reduce the toughness of the thermoplastic matrix. However, a greater retention of the toughness can be obtained in fillers that have stronger interfacial adhesion with the matrix (Folkes and Hope 1993).
Commercial polymer blends or alloys normally consist of binary systems with partial solubility, thus containing more than two phases. Occasionally, a third component may be added to serve as a compatibiliser or as an impact modifier. Among the factors influencing the degree of solubility of the components and also the morphological structure of a moulded part, processing conditions play an important role (Bertilsson et al. 1988a; Ryan 2002).
Most commercial polymer alloys are prepared by mechanical mixing, largely because of the simplicity and low cost of such a procedure (Utracki et al. 1989). The preferred industrial method of mechanical mixing is to use a screw compounder or extruder that can operate continuously and can produce a product in a convenient form for further processing. Extrusion is, thus, the most common operation encountered in plastics processing.
Other methods for forming blends, such as by evaporation of a solvent or by polymerisation of a monomer in the presence of a polymer, involve at least three components in the preparation process, one of which is a solvent/polymerisation medium. These methods are not normally used commercially due to their being costly and the solvent being difficult to recover. There are also potential environmental hazards that are associated with handling large volumes of often toxic chemicals (Utracki et al. 1989).
Blends of thermoplastic polyesters with the polycarbonate of bisphenol-A constitute an important type of commercial blend. The alloys, usually with cocontinuous morphology, have good processability, heat and chemical resistance, elongation, low temperature impact and tensile strength. Most of these blends show high notched impact strength down to -40 ºC. From the commercial application point of view, it can be said that the major advantages of polycarbonate/poly(butylene terephthalate) (PC/PBT) alloys are increased stiffness, low susceptibility to stress cracking on contact with fuels and an improved resistance to chemicals and fuels (Utracki 1998).
racks. PC/PBT blends are also used in outdoor power equipment (tractor or lawn mower shrouds, consoles, grilles, trim and equipment parts), recreational applications, for the manufacture of consumer goods (vacuum cleaner housings and nozzles, utility locks, protective face guards, beverage containers, dishes, food transport bins, dinnerware, mixing bowls, salad tongs and swimming pool pump housings), telecommunications (radio housings, speakers and instrument housings) and many other applications (Utracki 1998).
PC/PBT blends are mainly processed by injection moulding. However, grades for extrusion, blow moulding as well as for transfer and compression moulding, solid state processing, and thermoforming are also available (Utracki 1998). The moulded parts can be painted, hot stamped, metalised and plated.
Commercial blends of PC and of PBT include Xenoy®, from General Electric Plastics, Makroblend®, from Bayer, Sabre® 1600 from Dow Chemical Company, Stapron® E from DSM and Ultrablend® KR from BASF.
The Xenoy® alloy, in particular, is commercially important, offering a very good balance of chemical and mechanical properties, good weatherability, low temperature impact strength, heat resistance, UV stability, colour retention, lubricity, and very good melt flow. Common applications of this alloy include automotive bumpers/ fascia, tractor hoods and panels, lawn mower decks, business equipment housings, outdoor recreational vehicle components, material handling pallets, cellular phones and large structural parts. Since its introduction as a bumper material on the Ford Sierra 1982 model, the Xenoy® alloy, a modified PC/PBT blend, has found wide use in automotive applications. Besides bumpers, painted as well as unpainted (Ford, Mercedes, BMW 7 series, Rover 4WD, Fiat Barchetta, Peugeot 2D coupe), substantial penetration has been achieved in other automotive applications such as cladding on trucks, trunklids (Volvo S80), doorhandles, tankflaps, and the like. In most of these applications, the Xenoy® PC/PBT blend has been chosen also for the obvious advantages over steel (weight reduction, design freedom, low cost forming/assembly) and also for its paintability, dimensional stability, high impact and fuel resistance and wide processing window. As far as the use of Xenoy® on the Smart car (commercialised by MCC Ltd.) is concerned, the applications consist of: door panels, front centre parts, front fenders, rear door panel, rear wheellarch cladding/bumper corner and rear bumper centre section.
References to studies carried out on Xenoy® blends can be found commonly in the literature. This literature demonstrates well the attention that academia has been giving to these commercial polymer alloys (Wahrmund et al. 1978; Birley and Chen 1984; Delimoy et al. 1988; Golovoy et al.
1988; Bertilsson et al. 1988a, 1988b and 1989; Dekkers et al. 1990; Bennekom et al. 1997b; Choi
toughness. The amorphous PC provides the impact resistance, the toughness, and the dimensional stability at elevated temperatures. The semi-crystalline PBT provides the chemical resistance and the thermal stability. The degree of chemical resistance of these blends is directly related to the relative percentage of PBT. In general, the higher the percentage of PBT the higher is the chemical resistance of the blend.
Figure 1-1. Repeating unit in poly(butylene terephthalate) and in bisphenol A polycarbonate.
The matrix itself is created by extrusion of a mixture of the PC, of the PBT granulate, of a rubber based impact modifier and of additives (including anti-oxidants and a transesterification stabiliser). The blend displays a co-continuous morphology, with a designed miscibility level of the polymers of approximately 5-10 %.
Commercial, pigmented, impact-modified PC/PBT blends (for example Xenoy®, from GE Plastics) are currently commercialised in yellow, red, green, purple, brown, white and black colour forms, with an overlaid polyurethane clear coating to improve the weatherability. It has been stated by the manufacturers of mass-coloured Xenoy® that the colorant suppliers do not, currently, possess good knowledge with respect to this type of application (Timmerman, T. et al. 2001, Personal Communication). Thus, fundamental studies relating to the interactions between colorants and the remaining components of polymer blends, namely impact-modified PC/PBT blends, are of crucial importance to an understanding of the properties (physical, mechanical and coloristic) of these commercially important polymeric systems.
In the mass coloration of plastics, the pigment is added to the polymer matrix either during extrusion or during moulding. Some of the advantages of the mass coloration method over more traditional methods of decorating and/or coloration, such as painting or coating the plastic parts, include technological aspects, aesthetic aspects, lower cost factors and better environmental prospects. On the other hand, mass colouration can lead to a reduction in the material properties such as weatherability, physical properties, and mechanical properties. The effect of a pigment on such a system is dependent on the level of interaction between the various components of the blend.
inorganic coloured pigments, (also called mixed-metal oxide pigments), having a spinel structure (Figure 1-2).
Figure 1-2. Spinel structure of C. I. Pigment Blue 28 (CoAl2O4).
The Al3+ cations are represented in blue, the Co2+ cations are represented in red and the O 2-anions are represented in green.
Inorganic coloured pigments have a widespread range of uses in applications such as paints, plastics, printing inks, building materials, and ceramics. This is due to their excellent hiding power, colour fastness and stability, heat resistance and their reasonable chemical resistance. These characteristics ensure that they are very suitable for use in plastic applications. However, there are some pigmentary exceptions to these performance characteristics. The application of inorganic pigments is influenced by their physical properties as well as their chemical properties. The particle size, shape, and surface properties are important in the pigment performance as is the surface chemical composition. The commercial form of C. I. Pigment Blue 28 is not surface treated.
1.2. Component Interactions in Polymer Systems
The strong correlations that exist between the morphology, the processing, and the physical properties in polymer blends are well recognised (Utracki et al. 1989; Ryan 2002). As the number of constituents in these blends increases, the ways in which the various components become dispersed and segregated during melt compounding become increasingly important. Among these added materials are the stabilisers, plasticizers, reinforcing fibres, pigments and other polymers.
molten state, the cooling rate and the kinetics of non-isothermal crystallisation influence the final extent of phase separation at room temperature.
The morphologies of two-component polymer blends have been widely discussed in the literature as these represent the more common commercial form of polymer blends. In response to commercial pressures and to the need for precisely tailored physical properties, more complex blends that consist of multiple components are under active development. In such blends, morphological concerns go beyond questions concerned with the dispersed phase size, anisotropy, etc., to include more subtle issues such as why one of the dispersed polymer phases may spontaneously encapsulate another (Schreiber and Germain 1990) or encapsulate the filler particles (Premphet and Horanont 2000). Obviously, in multi-phase polymer systems, interfaces and interphases must exit. Therefore, it is reasonable to assume that under equilibrium conditions, such effects must arise from interfacial energy differences among the blend components. Surface and interfacial phenomena have been proven to influence:
i) The dispersion of minor phases in polymer matrices (Boluk and Schreiber 1986; Boluk and Schreiber 1989);
ii) The processability of polymer blends and composites (Malik et al. 1988; Trujillo et al.
1988), and
iii) The mechanical properties of polymer blends (Ishida 1984; Ratzsch et al. 1990).
The use properties of polymer blends depend strongly on the miscibility (compatibility) of the polymers. For the particular case of binary polymer blends, according to Raetzsch (1990), to state that two polymers are partially miscible implies that a two-phase structure is generated when they are mixed. Both phases contain different but limited amounts of each component. Miscibility occurs when specific interaction forces develop between the two polymers (Al Saigh and Chen 1991; Coleman et al. 1991). Specific interactions may be in the form of hydrogen bonding, charge transfer complexes, acid-base type interactions, dipole moments, and electron donor-acceptor complexes (Ponec et al. 1974; Huyskens et al. 1991; Israelachvili 1991; Lara and Schreiber 1991b; Stone 1998). These specific interactions are of a highly directional nature and are present in addition to the dispersive forces. A current view, pioneered by Fowkes (Fowkes and Mostafa 1978; Fowkes 1980, 1983a, 1983b and 1990; Lara and Schreiber 1991b; Nardin and Schultz 1993a; Liang
et al. 2000), which is increasingly accepted, suggests that the totality of specific interactions may be viewed as acid/base forces. This approach has been supported by experimental results (Liang et al. 2000).
1.2.1. Thermodynamic Requirements for Miscibility in Polymer Blends
The basic question when considering a polymer blend concerns the extent of thermodynamic miscibility. Several polymer pairs are known to be miscible or partially miscible, and many of these have become commercially important (Utracki et al. 1989). Considerable attention has been focused on the origins of miscibility and on binary polymer/polymer phase diagrams. It is usually observed that high molar mass polymer pairs, showing partial miscibility, exhibit phase diagrams that indicate a lower critical solution temperature (LCST) (Utracki et al. 1989; Bonner and Hope 1993; Cheng et al. 1996; Pompe 1997). In a polymer blend that exhibits LCST behaviour, the miscibility is higher at low temperatures. As temperature increases phase separation occurs because the intermolecular attractive forces responsible for the miscible behaviour tend to disappear as the internal energy of the molecules becomes high enough to overcome them.
The classic Flory-Huggins theory and extensions of this model, have been most helpful in providing an understanding of the phase behaviour of polymer blends (Ratzsch et al. 1990). Miscibility is understood to be the penetration of components on the molecular level, analogous to the behaviour of low molecular weight substances. Fundamentally, one thermodynamically describes the miscibility of two arbitrary components by the Gibbs free energy of mixing, Gmix:
Gmix = Hmix - T Smix (1-1)
Here Hmix denotes the enthalpy of mixing and Smix denotes the entropy of mixing.
Any two components are mutually miscible if the mixing free energy of the systems meets the following conditions (Lyngaae-Jorgensen 1993; Al Saigh 1997b):
Gmix < 0 Scheme 1-1
0
, 2 2
> ∂
∆ ∂
T p
mix G
φ
Scheme 1-2Here φ is the molar fraction of a component.
For spontaneous mixing, the value of Gmix must be negative. Thus, and bearing in mind the
small contribution of the entropy of mixing to the free energy of mixing, exothermic mixtures ( Hmix < 0) will mix spontaneously. On the other hand, for endothermic mixtures, miscibility will
only occur at high temperatures. The condition expressed in Scheme 1-2 means that, mathematically, Gmix (φ) is a convex function of the composition of the mixture (φ). This results
many cases, in the creation of a stable, finely dispersed distribution of the polymers in one another (Ratzsch et al. 1990).
In Equation 1-1, the combinatorial entropy of mixing of components 1 and 2 depends on the number of molecules present, according to Equation 1-2 (Utracki et al. 1989):
2 2 1
1ln
φ
n lnφ
n RT
Smix
+ =
∆
(1-2)
Here, φ1 is the molar fraction of component 1 in the mix and φ2 is the molar fraction of
component 2 in the mix. R is the gas constant and T is the temperature. The parameters n1 and n2
are the number of moles of molecules of components 1 and 2, respectively. Therefore, as the molar mass increases, the number of molecules per unit mass becomes small and the combinatorial entropy of mixing becomes negligibly small (Lyngaae-Jorgensen 1993).
In order to explain phase separation that occurs on heating, i. e. LCST behaviour, the effect of volume changes on mixing must be considered. This effect is described by equation-of-state theories such as that developed by Flory and co-workers (Utracki et al. 1989). The free volume contributions to the free energy are unfavourable and increase with temperature.
A question arises as to why miscible polymer pairs exist. In the case of polymers that are very similar physically and chemically, the occurrence of miscibility is comprehendible. If that is not the case, the major driving force for miscibility must be the enthalpic contributions to the free energy (Utracki et al. 1989). There are two ways, not mutually exclusive, of explaining favourable enthalpic contributions (Utracki et al. 1989; Lee et al. 2001):
a) Positive interactions between the two polymers, and
b) Unfavourable interactions between groups on the same polymer, causing an overall favourable interaction with another polymer.
Examples of favourable interactions between the polymer chains include specific intermolecular interactions, such as acid/base interactions involving hydrogen bonds. In these cases, phase separation that occurs on heating may be due to dissociation of the hydrogen bond matrix (Utracki et al. 1989).
explained by the presence of a favourable specific interaction without recourse to a cross term. If one separates the normal dispersive forces from the specific interaction then, as a first approximation, when the solubility parameters of the two polymers are similar, the unfavourable dispersive interactions are small and the specific interactions yield miscibility.
Summarising, it can be said that for most miscible blends, the miscibility stems from specific interactions. However, the miscibility can also originate from reduction of unfavourable specific interactions between groups of the same polymer (Bertilsson et al. 1988b; Utracki et al. 1989; Lee
et al. 2001).
1.2.2. The Solubility Parameter – Relevance to Interactions in Multicomponent
Polymeric Systems
One widely used approach to the quantification of interactions that occur in multicomponent polymeric systems is through the determination of “solubility” or “cohesion” parameters, T. The
parameter is, in effect, the square root of a cohesive energy density, as defined by Hildebrand in Equation 1-3 (Jackson et al. 1994; Walker and Collyer 1994; Guthrie 1996):
2 / 1 ∆ =
V Hv
T
δ
(1-3)Here Hv is the molar vaporisation energy of the substance and V its molar volume.
The solubility parameter was originally intended to be applied to substances whose cohesion arises from dispersion forces (Fowkes et al. 1990). Consequently, this parameter seems to be of limited use with polymers that generally decompose before vaporisation enthalpies can be determined (Schreiber 1993). Since then, the concept underlying the use of solubility parameters has been greatly expanded. The overall T can be divided into dispersion contributions and polar
contributions. Often non-polar homomorphs of polar molecules can provide values for the dispersive contribution, d, and the polar contributions, p, can then be obtained from differences
between T and d. Further refinements (Fowkes 1980 and 1983a; Schreiber 1993; Walker and
Collyer 1994) due to Hansen, have introduced a three-component solubility parameter, which separates non-dispersive contributions into polar components and hydrogen bond components. This has been applied to organic liquids and some polymers (Walker and Collyer 1994). Calculations of
T for macromolecules can also be made from tabulated values of molar attraction constants, as
carried out, for example, by Ryan and colleagues (1988). Extensive summaries of T and of other
cohesion parameters are readily available in the literature (Ryan et al. 1988; Walker and Collyer 1994).
reliable as an indication of short-range polar, or acid-base interactions, for semi-crystalline polymers and for crosslinked polymers.
For solids, polymers, and many liquids, it is necessary to use indirect evaluation methods in the estimation of solubility parameters, as such materials have a vapour pressure that is too low to detect. Although these indirect methods are useful, they are also tedious and time consuming.
Furthermore, ultimately, the application of T to polymer systems is impeded by the
following factors (Hobbs et al. 1988a; Schreiber 1993; Liang et al. 2000):
1) No direct, experimental determinations of T for polymers exist to corroborate the validity
of calculations and inferences. Only relatively complex scattering techniques being promising in this regard;
2) Available solubility parameters generally apply to polymers as solutes at very high dilution. The concentration dependence of T is difficult to assess;
3) Data generally apply to room temperature conditions. The evaluation of a temperature dependence of behaviour is problematic.
1.2.3. Interaction Parameters from Polymer Solution Theories
Polymer solution thermodynamics, as developed firstly by Flory and Huggins (Su et al.
1976; Galin and Rupprecht 1979a-c; Ward et al. 1980), express the interaction between a polymer and a liquid in terms of a dimensionless parameter, χ1,2. This can be written as Equation 1-4:
2 2 2 1 1
2 1
2 1 2 ,
1 ln
ϕ
1ϕ
ϕ
ϕ
µ
µ
χ
= − − + −V V
RT (1-4)
The subscripts 1 and 2 denote the liquid (solvent) and the polymer (solute), respectively. µ is the chemical potential, are the volume fractions and V molar volumes. Miscibility occurs when
χ1,2 is lower than a critical value, or lower than zero.
The parameter χ1,2, as expressed in this manner, indicates intermolecular forces between the
components of any polymer-liquid mixture. Therefore, this parameter is not dependent on the choice of theory or theoretical model. Its usefulness in practice, however, is once more limited because χ1,2 is usually determined by methods such as vapour pressure lowering, osmotic pressure