ISSN 1553-345X
© 2007 Science Publications
Corresponding Author: A.E. Ghaly, Department of Process Engineering and Applied Science Dalhousie University, P.O. Box
Effective Coagulation Technology for Treatment of Grease Filter Washwater
A.E. Ghaly, A. Snow and B.E. Faber Department of Process Engineering and Applied Science
Dalhousie University, P.O. Box 1000, Halifax, Nova Scotia, Canada B3J 2X4
Abstract: The treatment of grease filter washwater by chemical coagulation and sedimentation using different dosages of aluminum sulfate was investigated. Pollutant removal efficiency was measured in terms of total solids, pH and optical density. The process was found to be effective at the room temperature and the filter washwater pH (9.5). The optimum aluminum sulfate dosage was 2 g/L. The treatment reduced the total solids of the wastewater by 89.6%, and produced a supernatant with a pH of 4.15 and an optical density of 0.194 nm. A fully automated prototype was then constructed for the treatment of grease filter washwater. Three distinct layers were formed in the system (fat, liquid and sludge) and each was removed separately. The system successfully recovered over 80% recyclable water with a quality comparable to that of tap water. The combined mixture of sludge and fat (20%) contained high levels of heavy metals and was not suitable for bioconversion into value added product. However, dewatering the sludge using vacuum filtration reduced its volume to 0.8% of the original volume of washwater. As a result, about 99.2% of the washwater (treated water) is recycled in the washing operation.
Keywords: pH, temperature, washwater, grease filter, coagulation, sedimentation, aluminum sulfate
INTRODUCTION
Wastewaters from food processing plants, restaurants and hospitals contain a wide variety of chemical, biological and physical constituents such as fat, meat, bone scraps, animal or fish entrails and excreta, blood and dairy wastes, pulp and peels of vegetable origin and detergents from washing [1]. Although their compositions and contamination loads will vary greatly from one operation to another [2], they share several characteristics: (a) high strength compared to domestic wastewaters, (b) high concentrations of fats, oils and greases (FOG), soaps and waxes, (c) high biodegradability, (d) sufficient amount of nutrients such as nitrogen and phosphorous which are required for biological processes, (e) high concentrations of proteinaceous materials which deaminate to form large concentrations of ammonia in wastewater and (f) high concentrations of heavy metals (lead, zinc, cadmium, silver, antimony, etc.), synthetic non-biodegradable organics, phthalates, pesticides (Dieldrin, Lindane, etc.), toluene, benzene, PAHs, acids, dioxins, furans, halogen compounds and pathogenic materials all of which are objectionable features of these wastes [1].
High concentrations of biodegradable materials in untreated food processing wastewaters will: (a) increase nutrient levels, which over-stimulate the growth of algae and other aquatic plants (blooms), (b) deplete dissolved oxygen as a result of decaying organic wastes, (c) increase sedimentation and chemical toxicity and (d) render water unfit for domestic, recreational and industrial use [2, 3, 4, 5, 6]. An example of these wastewaters is grease filter washwater.
20
(b) vertical baffle filter (a) screen filter
39.5
mm
49.5
mm
49.5 mm 49.5 mm
Fig 1: Types of grease filters used in fume hoods.
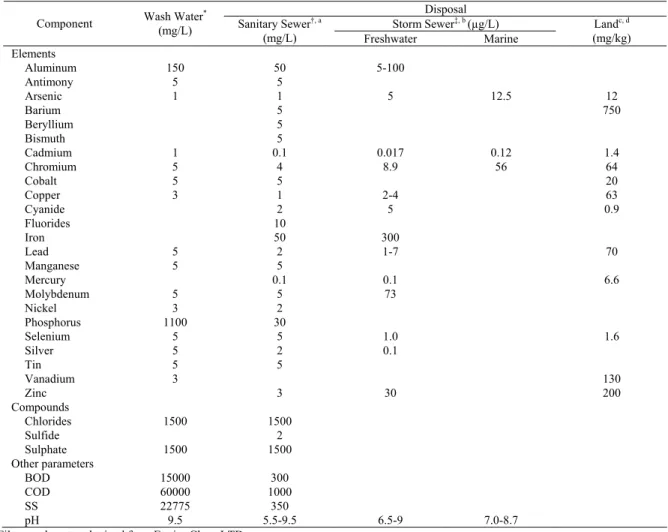
Table 1 shows the composition of the washwater produced and environmental limits for different disposal options. Currently, the three avenues for disposal of wastewater are: (a) storm sewers, (b) sanitary sewers, and (c) land. Since storm sewer waters are released directly to streams, rivers and oceans, discharging the washwater to storm systems would have serious consequences for the aquatic environment as the inorganic pollutants could be toxic to marine life and the organic material in the wastewater would begin to decompose, depleting the water body of oxygen. Also, discharging the washwater to sanitary sewers has several disadvantages as fats, oils and grease may: (a) clog sewers, pumps, screens, air diffuses, clarifier feedwells, and raleways, (b) hinder oxygen transfer in aerobic biological treatment processes and (c) slow the rate of biodegradation [7]. Finally, land disposal of washwater may lead to contamination of the groundwater table and destruction of wildlife habitats. Therefore, the washwater must be properly treated before final disposal in order to protect the environment and comply with current environmental laws. Environmental laws in Canada are becoming more and more stringent. Current laws state that if an industrial plant discharges pollutants in excess of established Provincial or Federal Standards, it will be heavily fined [8, 9, 10]
. The fines for environmental offenses in Canada have increased from an average of $300 in 1991 to $30, 000 in 2004 as shown in Table 2.
Because of the high concentration of inorganic solids in the washwater, Ghaly et al. [11] recommended treatment with chemical coagulation. The authors indicated that aluminum sulfate was a superior coagulant to ferrous sulfate and ferric chloride achieving good results at ambient temperature and high pH. The objective of this study was to develop and evaluate an efficient coagulation system for the treatment of grease filter washwater in which aluminum sulfate is used as a coagulant.
MATERIALS AND METHODS
Preliminary Experiment: The coagulation/
sedimentation process was conducted using aluminum sulfate as a coagulant. The test was conducted at various concentrations (1.0, 1.5, 2.0, 2.5, and 3.0 g/L). By comparing the total solids reduction and the clarity of the separated liquid (as measured by optical density), an optimum concentration of the coagulant was determined and later used in the developed system.
The wastewater used in this study was a grease filter washwater obtained from Enviro Clean Ltd located in Waverly, Nova Scotia. The washwater was first mixed to ensure a homogeneous sample. A volume of 1 L was drawn into a beaker and placed on a magnetic stirrer. The proper amount of the coagulant was weighed on an analytical balance and added to the washwater. The washwater was mixed for period of ten minutes to ensure that the coagulant was completely dissolved. The mixture was then transferred to 1000 mL graduated cylinders where sedimentation was to take place. Samples of the treated water were taken at the completion of the sedimentation process and placed into 100 mL beakers. It was then analyzed for pH, total solids and clarity (optical density).
Table 1. Wash water characteristics and environmental limits for different disposal alternatives
Disposal Storm Sewer‡, b (µg/L)
Component Wash Water
*
(mg/L) Sanitary Sewer
†, a
(mg/L) Freshwater Marine
Landc, d
(mg/kg)
Elements
Aluminum 150 50 5-100
Antimony 5 5
Arsenic 1 1 5 12.5 12
Barium 5 750
Beryllium 5
Bismuth 5
Cadmium 1 0.1 0.017 0.12 1.4
Chromium 5 4 8.9 56 64
Cobalt 5 5 20
Copper 3 1 2-4 63
Cyanide 2 5 0.9
Fluorides 10
Iron 50 300
Lead 5 2 1-7 70
Manganese 5 5
Mercury 0.1 0.1 6.6
Molybdenum 5 5 73
Nickel 3 2
Phosphorus 1100 30
Selenium 5 5 1.0 1.6
Silver 5 2 0.1
Tin 5 5
Vanadium 3 130
Zinc 3 30 200
Compounds
Chlorides 1500 1500
Sulfide 2
Sulphate 1500 1500
Other parameters
BOD 15000 300
COD 60000 1000
SS 22775 350
pH 9.5 5.5-9.5 6.5-9 7.0-8.7
* Filter wash water obtained from Enviro Clean LTD
† Sanitary sewer is a sewer for the collection and transmission of domestic, commercial and industrial
wastewaters
‡ Storm sewer is a sewer and all related structures designed exclusively for the collection and
transmission of uncontaminated stormwater, and drainage from land.
a Service Nova Scotia and Municipal Relations [12]
b CCME [13]
c CCME [14]
d Nova Scotia Department of Environment and Labor [15]
Prototype Development
Prototype components: From the preliminary
experiments, it was determined that the optimum concentration of aluminum sulfate was 2.0 g/L, which resulted in a liquid-solid ration of 80-20 (80% liquid and 20% sludge). It was also determined that a height to width ratio of 3:1 was acceptable for the prototype. Based on these findings, a 20-L working volume prototype was designed and constructed. The main components of the system were: a washwater storage and feeding unit, a chemical addition unit, a coagulation/flocculation and settling unit, a fat removal unit, a water and sludge removal unit and a control unit (Figure 2).
The washwater storage and feeding unit consisted of a holding tank, a mixer, a pump and two solenoid valves. A 250 L storage tank (60 cm diameter and 100 cm height) was constructed of Plexiglas. A mixer was incorporated on the top of the holding tank to ensure that a homogeneous amount of washwater was supplied to the settling tank. The mixer was operated with a motor and the washwater was supplied to the settling tank using a pump and two solenoid valves.
22
Table 2. Examples of prosecuted environmental offenses related to food waste in Canada [1, 16, 17].
Year Act Defendant Offence Fine ($)
2004 Fisheries Act section 36(3)
J.M. Schneider Inc. illegal discharge of poultry liquid effluent
30, 000.00
2004 Fisheries Act section 36(3)
Cavendish Farms illegal discharge of effluent (potato leachate)
30, 000.00
2003 Canadian Environmental Protection Act
section 125(1) Fisheries Act section 36(1)(b)
Dandy Dan’s Fish Market Ltd. illegal ocean disposal of fish offal
1,750.00
2003 Canadian Environmental Protection Act
section 124(1)
St. Paul Sea Food Ltd. illegal dumping of fish waste
10, 000.00
2001 Canadian Environmental Protection Act
section 124(1)(b)
Daley Brothers Limited illegal disposal of fish offal 10, 000.00
2000 Fisheries Act section 36(3)
Maple Leaf Foods Inc. (Rothsay Recycles)
illegal discharge of meat and poultry liquid effluent
100,000.00
1992 Environmental Protection Act S.23 (1)
Seafreaze Food Inc. unlawfull discharge of material into environment
15,000.00
1991 General Litter Abatement Regs S.8(2)
European Food Shop Limited failure to clean up property within 50 feet of food concession
300.00
1991 General Litter Abatement Regs S.5 (SOT)
Stirling Fruit Farm Limited unlawfull discharge of litter into the environment
250.00
1989 Water Act Oxford Frozen Foods Limited unlawfull discharge of contaminant
4,000.00
P = Pump V = Valve M = Motor
Disposal Sludge
Tank
V3
V2 V4
V5
P1 Recycle
V1
Water Tank Wastewater
Tank V6
M1 P3
M2 P2
M4
M3
Fat Tank
Settling Tank
Fig. 2: System components.
addition to the settling tank, a mixer was used to mix the solution prior to chemical addition. The mixer was operated with a motor and the chemical solution was added to the washwater settling tank by a pump.
20.0 cm
Fat Door
Fat Scraper
38.0 cm 30.0 cm
Fat Zone
Liquid Zone
Sludge Zone Louvers
20.0 cm
Fig. 3: The coagulation/flocculation and settling tank.
The skimming process was accomplished by the use of a skimming device constructed of stainless steel. The skimmer operated a 9.5 cm threaded rod and a motor. To remove the fat layer, the motor was turned on and the skimmer traveled along the rod removing the fat material. The water removal system drained the liquid portion of the treated material from the settling unit using a pump and two solenoid valves. The treated water was pumped to a holding tank for reuse. The sludge removal unit removed the settled particulate material in the sludge zone using a pump and two solenoid valves. The sludge was pumped to a holding tank for further treatment/disposal.
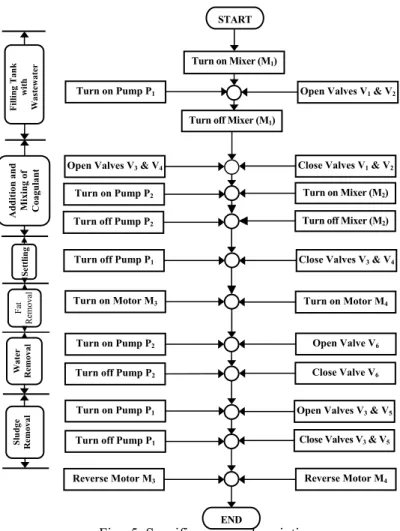
Prototype operation: The process involved several
distinct unit operations including filling, mixing, coagulation/flocculation, settling and removal of the various fractions of treated material as shown in Figure 4. During the initial testing stage of the prototype, each individual operation was controlled by a manual switch. The switches facilitated the testing of the different operations of the prototype during the preliminary experiments. Once an initial test of the system was completed, an electronic control system was developed. The circuit was built with small scale integration (SSI) logic. The core of the circuit was a ring counter that responded to various electronic time delays, switch closures and level sensors. The general process was
carried out by a system of motors, solenoid valves and pumps using the control system. A specific process description is shown in Figure 5.
Fig. 4: General process operations.
The first step in the process involved filling the settling tank with washwater, which was accomplished by turning on mixer M1, turning on pump P1 and opening valves V1 and V2. Once the tank was filled, mixer M1 was turned off and valves V1 and V2 were closed. Mixing of the washwater in the settling tank began before the coagulant was applied and was facilitated by pump P1 (which was left running) and opening valves V3 and V4. The washwater was drawn from the bottom of the tank to the top through an orifice at the center of the tank. The chemical coagulant was applied, mixer M2 and pump P2 were turned off. Valves V3 and V4 were left open for 3 minutes to ensure complete mixing of the chemical in the washwater. The mixture was then allowed to coagulate and flocculate for approximately 4 hours.
Following coagulation/flocculation of the washwater, three distinct layers were visible: fat, liquid, and sludge.
Mixing of Chemical
Mixing of Raw Wastewater
Addition of Chemical Coagulant
Filling of Settling Tank
Mixing of Wastewater/Chemical
Coagulation and Flocculation
Sedimentation
Separation
Sludge Liquid
Disposal Recycle
24
Fig. 5: Specific process description
Removal of the fat layer was accomplished by turning on motor M3 which opened the fat door in the side of the settling tank and closed the louvers. Motor M4 was then activated and the fat layer was skimmed off the surface of the liquid. The liquid layer was removed from the settling tank by turning on pump P2 and opening valve V6. Once the liquid was drained, pump P2 was switched off and valve V6 was closed. Finally, the sludge was removed from the system by turning on pump P1 and opening valves V3 and V5. The system was prepared for the next batch of wastewater by retuning the skimmer to its original position and resetting the fat door and louvers, which was accomplished by operating motors M3 and M4 in reverse.
RESULTS AND DISCUSSION
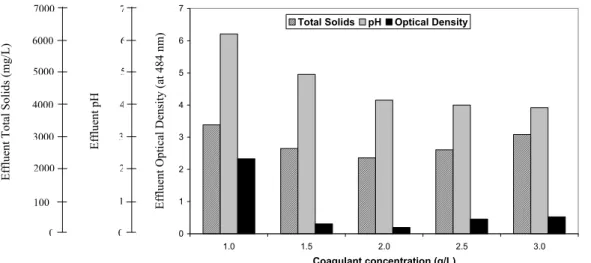
Preliminary Experiments: The total solids, pH and
optical density results of the treated water after the coagulation/sedimentation process had been completed
are presented in Figure 6. The solids removal efficiency and the change in pH are shown in Table 3.
Total solids: The total solids of the washwater was 22775 mg/L. The total solids of the treated water was substantially lower than the washwater. The total solids of the liquid portion (treated water) initially decreased (from 3385 to 2358 mg/L) when the aluminum sulfate was increased from 1 to 2 g/L, thus, achieving a solids removal efficiency of 89.6%. It then increased (from 2358 to 3088 mg/L) when the concentration of aluminum sulfate was increased above 2 g/L, thus, reducing the solids removal efficiency to 86.4% (3.2% reduction). The relationship between the total solids (TS) of the treated wastewater and the concentration of aluminum sulfate (CAS)can be described by the following equation:
TS = 22775– 32221 CAS + 15879 CAS2 -2450.5 CAS3 (1) (R2 = 0.99)
Open Valves V1 & V2
START
Turn on Mixer (M1)
Turn off Mixer (M1)
Turn on Mixer (M2)
Turn on Pump P1
Open Valves V3 & V4 Close Valves V1 & V2
Turn on Pump P2
END
Turn off Pump P2
Turn off Pump P1
Turn on Motor M3
Turn on Pump P2
Turn off Pump P2
Turn on Pump P1
Turn off Pump P1
Reverse Motor M3
Turn off Mixer (M2)
Close Valves V3 & V4
Turn on Motor M4
Open Valve V6
Close Valve V6
Open Valves V3 & V5
Close Valves V3 & V5
Reverse Motor M4
Filling Tank
with
Wastewater
Addition and Mixing of Coagulant
Se
tt
ling
Fa
t
Removal
Water Removal
Fig. 6: The total solids, pH and optical density of the liquid portion of the treated wastewater.
Table 3. Solids removal efficiency and pH change.
Total Solids pH
Reduction Change
Chemical Concentration
(g/L)
Value
(mg/L) (mg/L) (%)
Value
(-) (-) (%)
1.0 3385 19390 85.1 6.21 3.29 34.6
1.5 2650 20125 88.3 4.95 4.55 47.9
2.0 2358 20417 89.6 4.15 5.35 56.3
2.5 2613 20162 88.5 4.0 5.5 57.9
3.0 3088 19687 86.4 3.92 5.58 58.7
The total solids of the raw wastewater was 22775 mg/L. The pH of the raw wastewater was 9.5.
Where:
TS = total solids (mg/L)
CAS = concentration of aluminum sulfate (g/L)
Liu and Lien [19] reported that at a pH of 6 and an aluminum sulfate concentration of 70 mg/L, 85.9% of suspended solids (SS) was removed from bakery wastewater and when the aluminum sulfate concentration was increased to 100 mg/L, 95.3% of SS was removed. Sanchis et al. [20] reported that at a pH of 5 and an aluminum sulfate dosage of 600 mg/L, 97.14% of total suspended solids (TSS) was removed from slaughterhouse effluent. Ndegwa et al. [21] reported that increasing the concentration of aluminum sulfate from 500 to 2000 mg/L increased the removal efficiency of suspended solids in swine wastewater from 70 to 96%.
pH: The pH of the washwater was 9.5. The pH of the treated water was substantially lower than the initial pH. The pH of the treated water decreased with increasing coagulant concentration. Increasing the coagulant concentration from 1 to 3 g/L decreased the pH of the
treated water from 6.2 to 3.9. The relationship between the pH of the treated water and the concentration of aluminum sulfate (CAS) can be described by the following equation:
pH = 9.5 – 4.15 CAS + 0.77 CAS2 (R2 = 0.99) (2)
Where:
pH = negative logarithm of [H+] ions
Song et al. [22] reported a decrease (from 9.2 to 8.8) in pH of tannery wastewater upon the addition of 100 mg/L of aluminum sulfate and a final pH of 6.6 occurred with coagulant concentrations in the range of 500-900 mg/L. Hilal et al. [23] reported that when the coagulant concentration was increased to 1.8 g/L a decrease in pH (from 8.5 to 4.3) of waste coolant from cutting tools in the metal working industry was observed. Pinotti and Zaritzky [24] reported a decrease in the pH of sunflower oil processing wastewater (from 8.5 to 3.6) when the concentration of aluminum sulfate applied to the wastewater was increased to 1000 mg/L.
0 1 2 3 4 5 6 7
1.0 1.5 2.0 2.5 3.0
Coagulant concentration (g/L) Total Solids pH Optical Density
E
ff
luent Optical Density (
at 484 nm
)
E
ff
luent pH
0 1 2 3 4 5 6 7
0 100 2000 3000 4000 5000 6000 7000
26 A decrease in solution pH occurs because aluminum sulfate consumes alkalinity [22, 25]. Alkalinity is defined as the quantity of ions in water that will react to neutralize hydrogen or the ability of water to neutralize acids. The ions that constitute alkalinity are primarily hydroxide (OH-), carbonate (CO32-) and bicarbonate (HCO3-), and their presence in solution depends on the pH of the solution. At a pH above 8.3, all of the hydroxide ions and half of the carbonate ions react to neutralize the acid in the wastewater, whereas at a pH of 4.5-8.3, half of the carbonate ions and all of the bicarbonate ions are consumed by the acid [26]. In this study, the initial pH of the wastewater was 9.5. The Al3+ ions will react with the OH- ions in the wastewater and precipitate in the form of aluminum hydroxides [Al(OH)3] as shown in the following equations [25]:
Al2(SO4)3·18H2O+6H2O→2Al(OH)3(S)+6H++ 3SO42- +
18H2O (3)
Then, the hydrogen ions interact with the hydroxyl, carbonate and bicarbonate ions as follows:
OH- + H+→ H
2O (4)
CO32- + H+↔ HCO3- (5)
HCO3- + H+↔ H2CO3↔ CO2 + H2O (6)
Optical density: The optical density initially decreased from 2.332 to 0.194 nm when the aluminum sulfate concentration was increased from 1 to 2 g/L and then increased from 0.194 to 0.526 nm when the aluminum sulfate concentration was increased from 2 to 3 g/L. The relationship between the optical density (OD) and the concentration of aluminum sulfate (CAS) can be described by the following equation:
OD = 2.89 + 0.12 CAS – 1.61 CAS2 + 0.44 CAS3 (7) (R2 = 0.99)
Where:
OD = optical density (nm)
The optical density of the treated water was used to determine the optimum concentration of the coagulant because the lower the optical density, the clearer the liquid and the better suited it will be for reuse. The optical density results indicated that the optimum dosage for aluminum sulfate was 2.0 g/L. Song et al. [22] reported that when aluminum sulfate was used as a coagulating agent at a concentration of 800 mg/L and a pH of 7.5, the average removal efficiencies from tannery wastewater in terms of suspended solids and color were 37 and 86%, respectively. Mutlu et al. [27] reported that at a coagulant
dosage of 250 mg/L, the average removal efficiencies in terms of color and optical density (OD) on effluent from a baker’s yeast plant were 10%, but when the dosage of aluminum sulfate was increased to 2000 and 4000 mg/L, the removal efficiencies in terms of color and OD were 47 and 60% and 81 and 88%, respectively.
In this study, increasing the concentration of the chemical coagulant above 2 g/L, not only increased the total solids of the treated water, but also increased the color intensity, which is in direct conflict with the results reported by Mutlu et al. [27]. The increase in total solids and color intensity of the treated water can be explained by examining the mechanisms of coagulation. According to Droste [25], coagulation is the process of adding chemical reagents or coagulants to wastewater to destabilize colloidal particles and allow them to agglomerate with other suspended materials forming larger, more readily settled particles. Colloidal particles are negatively charged and upon addition of aluminum sulfate to wastewater, the Al3+ ions are attracted to these particles. At the point of complete charge neutralization, the colloids begin to agglomerate due to collisions between particles. If excess coagulant is added to the wastewater, the results are: (a) excess adsorption of Al3+ ions, (b) reversal of the net charge on the colloidal particles (from negative to positive) and (c) particle restabilization. Particle restabilization by charge reversal allowed greater amounts of smaller particles to remain in solution, thus increasing the total solids as well as the color intensity of the treated water. The results obtained in this study are similar to those reported by Schafran and Tekleab [28] who reported particle restabilization by charge reversal.
Prototype
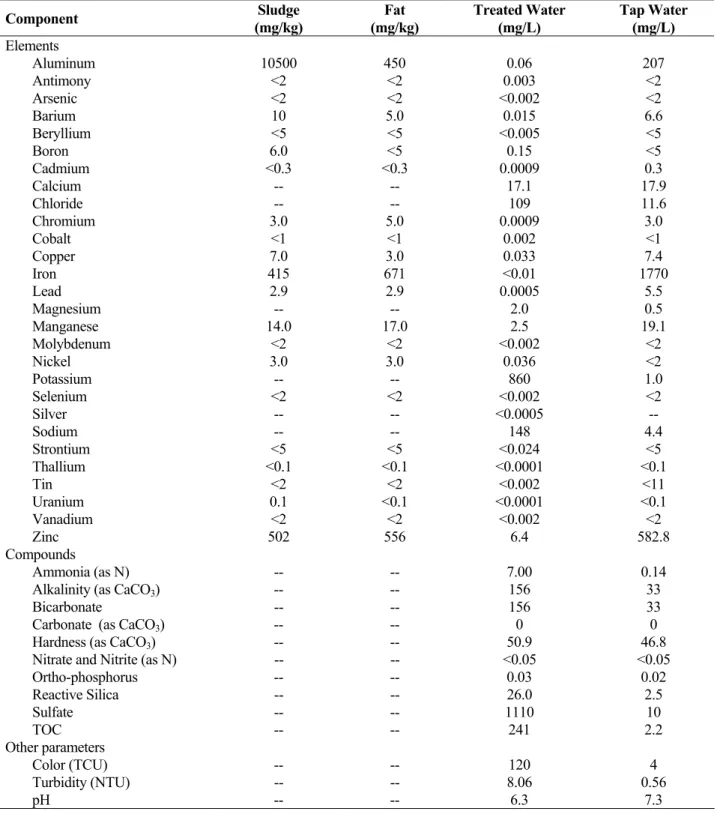
Table 4 shows some characteristics of the fat, liquid and sludge obtained from the prototype. The liquid portion was about 80% of the total volume and had a water quality comparable to or better than that of drinking water. The fat and sludge portions were about 1% and 19% of the original volume of the wastewater. The sludge contained high concentrations of heavy metals and was not suitable for bioconversion into a value added product. However, dewatering of the sludge using vacuum filtration reduced its volume to 0.8% (from 20% to 0.8%) of the original volume of the wastewater. About 99.2% of the water was recycled as shown in Figure 7.
Impact of the pH of the Treated Water: The final pH
Table 4. Characteristics of sludge, fat and water layers obtained after treatment.
Component Sludge
(mg/kg)
Fat (mg/kg)
Treated Water (mg/L)
Tap Water (mg/L)
Elements
Aluminum 10500 450 0.06 207
Antimony <2 <2 0.003 <2
Arsenic <2 <2 <0.002 <2
Barium 10 5.0 0.015 6.6
Beryllium <5 <5 <0.005 <5
Boron 6.0 <5 0.15 <5
Cadmium <0.3 <0.3 0.0009 0.3
Calcium -- -- 17.1 17.9
Chloride -- -- 109 11.6
Chromium 3.0 5.0 0.0009 3.0
Cobalt <1 <1 0.002 <1
Copper 7.0 3.0 0.033 7.4
Iron 415 671 <0.01 1770
Lead 2.9 2.9 0.0005 5.5
Magnesium -- -- 2.0 0.5
Manganese 14.0 17.0 2.5 19.1
Molybdenum <2 <2 <0.002 <2
Nickel 3.0 3.0 0.036 <2
Potassium -- -- 860 1.0
Selenium <2 <2 <0.002 <2
Silver -- -- <0.0005 --
Sodium -- -- 148 4.4
Strontium <5 <5 <0.024 <5
Thallium <0.1 <0.1 <0.0001 <0.1
Tin <2 <2 <0.002 <11
Uranium 0.1 <0.1 <0.0001 <0.1
Vanadium <2 <2 <0.002 <2
Zinc 502 556 6.4 582.8
Compounds
Ammonia (as N) -- -- 7.00 0.14
Alkalinity (as CaCO3) -- -- 156 33
Bicarbonate -- -- 156 33
Carbonate (as CaCO3) -- -- 0 0
Hardness (as CaCO3) -- -- 50.9 46.8
Nitrate and Nitrite (as N) -- -- <0.05 <0.05
Ortho-phosphorus -- -- 0.03 0.02
Reactive Silica -- -- 26.0 2.5
Sulfate -- -- 1110 10
TOC -- -- 241 2.2
Other parameters
Color (TCU) -- -- 120 4
Turbidity (NTU) -- -- 8.06 0.56
pH -- -- 6.3 7.3
environment. In aquatic ecosystems, the pH of water should fall within the range of 6.5-9.0 [14]. A fluctuation in pH within this range within this range is harmless to most fish and other aquatic life. However, as the pH
28 the rate of organic matter decomposition declines because the fungi and bacteria responsible for degradation are not acid tolerant, and most green algae, diatoms, snails and phytoplankton disappear when the pH drops below 5 [29]. Bamber [30] and Bamber [31] reported that as the pH of the aquatic environment continues to decrease below 7, the biodiversity of the ecosystem continues to decline, fish population numbers diminish and some aquatic animals such as frogs, toads and salamanders are completely eliminated from the water body [29]. Changes in water chemistry may also occur as a result
Fig. 7: Final products after coagulation/sedimentation of washwater and dewatering of sludge.
of a decrease in pH. At low pH, aluminum is released from soils into lakes and streams, and as the pH of the water body decreases, aluminum levels increase leading to weight loss, stunted growth and death of fish. Phosphates can also be complexed to the mobilized aluminum resulting in a decrease in the primary production of aquatic plants [29]. In order to neutralize the final pH of the treated water, calcium carbonate [Ca(HCO3)2], hydrated lime [Ca(OH)2] or caustic soda (NaOH) can be used to provide alkalinity species as follows:
Al2(SO4)3·18H2O+3Ca(HCO3)2→2Al(OH)3(S) + 3CaSO4 + 18H2O + 6CO2 (8)
Al2(SO4)3·18H2O + 3Ca(OH)2→ 2Al(OH)3(S)
+ 3CaSO4 + 18H2O (9)
Al2(SO4)3·18H2O+6NaOH→2Al(OH)3(S)+3Na2SO4+ 18H2O (10)
CONCLUSIONS
Aluminum sulfate (at a dosage of 2 g/L) was found to be an effective coagulant. The average removal efficiency in terms of total solids was 89.6% and the pH and optical density of the treated wastewater were 4.15 and 0.194 nm, respectively. A 20 L fully automated prototype was then constructed for the treatment of grease filter washwater. Three distinct layers were visible: fat at the top, liquid in the middle and sludge at the bottom. The system successfully recovered 80% recyclable water with a quality comparable to that of drinking water. The treated water was tested for 30 elements and 9 compounds, as well as turbidity and pH. The treated water contained less concentrations of most elements than tap water except chloride, magnesium, potassium and sodium which were slightly higher. It had, also, slightly higher concentrations of ammonia, bicarbonate, alkalinity, silica and TOC than tap water and was slightly acidic.
The combined mixture of sludge and fat (20%) contained high levels of heavy metals and was not suitable for bioconversion. However, dewatering the sludge using vacuum filtration reduced its volume to 0.8% of the original volume of washwater which could significantly lower the cost of its disposal .
The system is capable of handling wastes of varying strengths with notable flexibility, has low maintenance and low labor requirements. The design can be easily scaled up for use in industry.
ACKNOWLEDGEMENTS
This research was funded by the National Science and Engineering Research Council of Canada (NSERC).
REFERENCES
1. Environment Canada, 2004a. Recent Enforcement Actions, Ottawa, ON. http://www.ec.gc.ca/ 3 December 2005.
2. Environment Canada. 2004b. The State of Municipal Wastewater Effluents in Canada, Ottawa, ON.
http://www.ec.gc.ca/soerree/English/soer/MWWE. cfm. 3 December 2005.
Wastewater (0.6% solids)
Coagulation/Flocculation and Sedimentation
Water (0.125% solids)
Sludge/Fat (2.5% solids)
Dewatering
Cakes (67% solids) Water
(0.140% solids)
Water (0.2% solids) 80%
volum
20% volume
0.8% volume 19.2%
volume
3. Besselieve, E. B. 1952. Industrial Waste Treatment. McGraw-Hill Publishing Co., New York, NY.
4. Patterson, J. W., 1975. Wastewater treatment technology. Ann Arbor Science, Ann Arbor, Michigan, Illinois.
5. Besselierve, E. B., Sscwarchz, O. O., 1976. The Treatment of Industrial Wastes. McGraw-Hill Publishing Co., New York, NY.
6. Conway, J. A., Ross, R. J., 1980. Handbook of Industrial Waste Disposal. Van Nostramd Reinhood, Co., New York, NY
7. Green, J. H., Kramer, A., 1979. Food Processing Waste Management. AVI Publishers, New York, NY.
8. Department of Justice, 2004a. Canadian Environmental Protection Act, 1999, Ottawa. ON. http://laws.justice.gc.ca/en/C-15.31/index.html 4 January 2006.
9. Department of Justice, 2004b. Fisheries Act, 1985, Ottawa, ON. http://laws.justice.gc.ca/en/F1 4/index.html 4 January 2006
10. Legislative Council, 2004. Environment Act, 1994-95, Halifax, NS. http://www.gov.ns.ca/legisl ature/legc. 7 December 2005.
11. Ghaly, A. E., Snow, A., Faber, B., 2006.Treatment of grease filter washwater by chemical coagulation. Canadian Biosystems Engineering 48, 6.13 – 6.22. 12. Service Nova Scotia and Municipal Relations, 2004.
Sewer Use Model Bylaws, Halifax, NS. http://www.gov.ns.ca/snsmr/muns/infr/sew/discharg.as p. 28 Novermber 2005.
13. CCME, 2002a. Canadian water quality guidelines for the protection of aquatic life: Summary tables. In: Canadian Environmental Quality Guidelines. Canadian Council of Ministers of the Environment, Winnipeg, Manitoba.
14. CCME, 2002b. Canadian soil quality guidelines for the protection of environment and human health: Summary tables. In: Canadian Environmental Quality Guidelines. Canadian Council of Ministers of the Environment, Winnipeg, Manitoba.
15. Nova Scotia Department of Environment and Labor. 2004. Guidelines for Land Application and Storage of Biosolids in Nova Scotia, Halifax, NS. http://www.gov.ns.ca/enla/ecs/Biosolids_Guidelines_ May1304.pdf. 4 January 2006.
16. Environment Canada, 2003. Prosecutions Under the Canadian Environmental Protection Act and the Federal Fisheries Act, Ottawa, ON. http://www.ns.ec.gc.ca/enforcement/ studies.html. 3 December 2005.
17. Nova Scotia Department of Environment, 1992. Environmental Offenses in Nova Scotia. (Legal Document). Nova Scotia Department of the Environment, Halifax, NS.
18. APHA, 1989. Standard Methods for the Examination of Water and Wastewater. American Public Health Association, Washington, D.C.
19. Liu, J. C., Lien, C. S. 2001. Pretreatment of bakery wastewater by coagulation flocculation and dissolved air floatation. Water Science and Technology 43(8),131-137.
20. Sanchis, M. I. A., Saez, J., Llorens, M., Sole,r A., Ortuno, J. F., 2003. Particle size distribution in slaughterhouse wastewater before and after coagulation-flocculation. Environmental Progress 22(3), 183-188.
21. Ndegwa, P. M., Zhu, J., Luo, A. 2001. Effects of solid levels and chemical additives on removal of solids and phosphorus in swine manure. Journal of Environmental Engineering 127(12),1111-1115. 22. Song. Z, Williams, C. J., Edyvean, R. G. J., 2004.
Treatment of tannery wastewater by chemical coagulation. Desalination 164, 249-259.
23. Hilal, N., Busca, G., Talens-Alesson, F., Atkin, B. P., 2004. Treatment of waste coolants by coagulation and membrane filtration. Chemical Engineering and Processing 43(7),811-821.
24. Pinotti, A., Zaritzky, N. 2001. Effect of aluminum sulfate and cationic polyelectrolytes on the destabilization of emulsified wastes. Waste Management 21(6), 535-542.
25. Droste, R. L., 1997. Theory and Practice of Water and Wastewater Treatment. John Wiley and Sons, Toronto, ON.
26. Peavy, H. S., Rowe, D. R., Tchoboanoglous, G., 1985. Environmental Engineering, McGraw Hill, New York, NY.
27. Mutlu, S.H., Yetis, U., Gurkan, T., Yilmaz, L., 2002. Decolorization of wastewater of a baker’s yeast plant by membrane processes. Water Research 36, 609-616.
28. Schafran, G.C., Tekleab, T. M., 2000. TBT Treatability Studies Progress Report, Norfolk, VA. http://www.eng.odu.edu/casrm/tbt/Mar2000ProgRpt. pdf. 7 December 2005.
29. EPA. 2003. Effects of Acid Rain: Lakes and Streams, United States Environmental Protection
Agency, Washington, DC. http://www.epa.gov/acidrain/effects/surfacewater.
html. 29 November 2005.
30. Bamber, R. N., 1987. The effects of acidic sea water on young carpet-shell clams Venerupis decussata. Journal of Experimental Marine Biology and Ecology 108, 241-260.

![Table 2. Examples of prosecuted environmental offenses related to food waste in Canada [1, 16, 17]](https://thumb-eu.123doks.com/thumbv2/123dok_br/17180791.241826/4.918.127.790.110.621/table-examples-prosecuted-environmental-offenses-related-waste-canada.webp)