©2014 Science Publication
doi:10.3844/ajassp.2014.329.336 Published Online 11 (2) 2014 (http://www.thescipub.com/ajas.toc)
Corresponding Author: P. Shantha Kumar, Department of Computer Applications, RVS College of Engineering and Technology, Dindigul, India
PERFORMANCE ANALYSIS OF BRAIN TUMOR
DIAGNOSIS BASED ON SOFT COMPUTING TECHNIQUES
1
P. Shantha Kumar and
2P. Ganesh Kumar
1
Department of Computer Applications, RVS College of Engineering and Technology, Dindigul, India 2Department of Information Technology, KLN College of Engineering, Madurai, India
Received 2013-11-09; Revised 2013-11-19; Accepted 2013-12-27
ABSTRACT
Computed tomography images are widely used in the diagnosis of brain tumor because of its faster processing, avoiding malfunctions and suitability with physician and radiologist. This study proposes a new approach to automated detection of brain tumor. This proposed work consists of various stages in their diagnosis processing such as preprocessing, anisotropic diffusion, feature extraction and classification. The local binary patterns and gray level co-occurrence features, gray level and wavelet features are extracted and these features are trained and classified using Support vector machine classifier. The achieved results and quantitatively evaluated and compared with various ground truth images. The proposed method gives fast and better segmentation and classification rate by yielding 99.4% of sensitivity, 99.6% of specificity, 97.03% of positive predictive value and 99.5% of overall accuracy.
Keywords: Tumor, Classifier, Segmentation, Classification
1. INTRODUCTION
Magnetic Resonance Imaging (MRI) has become a widely employed high quality medical imaging nowadays in the field of tumor detection. Brain tissue and tumor segmentation in MR images have become a vital area of discussion. For accurate image segmentation, some good features have to be extracted. The brain is comprised of different tissues such as the White Matter (WM), Cerebrospinal Fluid (CSF) and Gray Matter (GM). During the segmentation of the MR brain images, variability in certain aspects such as, tumor shape, location, size, intensity and textural properties makes the segmentation process difficult. In tumor segmentation, intensity feature plays a vital role in differentiating tumor from other brain soft tissues. But, intensity alone is not sufficient, therefore other texture based features such as Local Binary Pattern (LBP), gray level based features, Gray Level Co-occurrence Matrix (GLCM), wavelet features are extracted.
Automatic tumor segmentation helps physicians from the burden of manual labeling by providing an aid in disease diagnosis. We consider the Glioblastoma Multiforme (GBM) brain tumor as it is the most commonly occurring tumor in the brain across patients of all ages. Automatic segmentation of tumors becomes critical due to the variations in texture, intensity, shape and size of the tumor.
Furthermore, a major portion of segmented voxels (volumed pixels) are likely to be matched with non-tumor brain structures such as, blood vessels, soft tissues. Besides, some noise like patterns in MRI such as, marking with pen, clips creates a region which resembles tumor region. This leads to complexity in detection and causes occurrence of many False Positives (FPs). Most of the existent techniques for tumor segmentation are not fully automatic.
Kumar and Raju (2010) Computer aided diagnosis systems for detecting malignant texture in biological study have been investigated using several techniques. This study presents an approach in computer-aided diagnosis for early prediction of brain cancer using Texture features and neuro classification logic. A neuro fuzzy approach is used for the recognition of the extracted region. The implementation is observed on various types of MRI images with different types of cancer regions.
Sharma et al. (2012) has provided an efficient algorithm for detecting the edges of brain tumor. The first step starts with the acquisition of MRI scan of brain and then digital imaging techniques are applied for getting the exact location and size of tumor. MRI images consist of gray and white matter and the region containing tumor has more intensity.
Tirpude and Welekar (2013) has provided an accurate demarcation of the boundary of the tumor, along with correct visual location of the tumor with the help of a bounding circle. This study has also provided a diagnosis decision whether the tumor is present or absent along with the exact size of the tumor. This decision can assist as a supportive aid which can be used at the doctor’s discretion in finally declaring a decision.
Corso et al. (2008) presented a new method for automatic segmentation of heterogeneous image data that takes a step toward bridging the gap between bottom-up affinity-based segmentation methods and top-down generative model based approaches. The main contribution of the paper is a Bayesian formulation for incorporating soft model assignments into the calculation of affinities, which are conventionally model free.
Sridhar and Krishna (2013) has presented a method which is the combination of Discrete Cosine Transform and Probabilistic Neural Network. By using these
scale, multi physics model including tissue deformation. Large-scale deformations are handled with an Eulerian approach for finite element computations, which can operate directly on the image voxel mesh. Consequently, dense correspondence between the modified atlas and patient image was established using non-rigid registration. Their technique provides atlas-based segmentation of tumor bearing brain images as well as for improved patient specific simulation and diagnosis of tumor progression.
3. PROPOSED SYSTEM MODEL
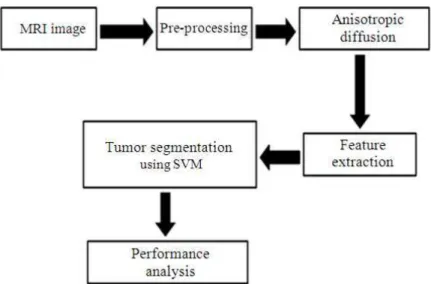
The proposed system for brain tumour segmentation method is illustrated in Fig. 1. The proposed method consists of five stages named as pre-processing, anisotropic diffusion, feature extraction, training and classification of tumours and performance analysis.
3.1. Pre-Processing
Fig. 1. Process flow of the proposed tumour segmentation method In this study, we use anisotropic diffusion filtering to
perform denoising. The filter ranks the neighboring pixels according to its intensity value and the median value is found for the pixel under evaluation. The new median or middle value then replaces the central pixel. Anisotropic diffusion filters perform well for noises such as, shot or impulse noise even if the values extremely large.
3.2. Feature Extraction
3.2.1. GLCM Features
The Gray Level Co-occurrence Matrix (GLCM) is a feature to identify texture in an image, by modelling texture as a 2-Dimensional array gray level variation. This array is called Gray Level co-occurrence matrix. GLCM is a statistical method that considers the spatial relationship of pixels, hence it is also known as the gray-level spatial dependence matrix.
GLCM features are calculated in four directions -0, 45, 90 and 145° and four distances-(1,2,3,4). Five properties of GLCM namely, contrast, correlation, energy and homogeneity are computed using Equation (1 to 4):
(
2)
Contrast=
∑
i− ×j p(i, j) (1)2
Engery=
∑
p(i, j) (2)p(i, j) Homogeneity
1 i j
= + −
∑
(3)
p(i, j)
Correlation (i i)( j j)
[ i, j]
= − µ − µ
σ σ
∑
(4)The number of gray levels in an image determines the size of GLCM. The matrix element P(i,j| x, y) is the relative frequency with two pixels separated by pixel distance ( x, y), which occurs within a given neighbourhood, one with intensity i and other with intensity j.
A Gray Level Co-occurrence Matrix (GLCM) contains information about the positions of pixels having similar gray level values. A GLCM P[i,j] is defined by first specifying a displacement vector d = (dx,dy) and counting all pairs of pixels separated by d having gray levels i and j.
3.2.2. Local Binary Pattern (LBP)
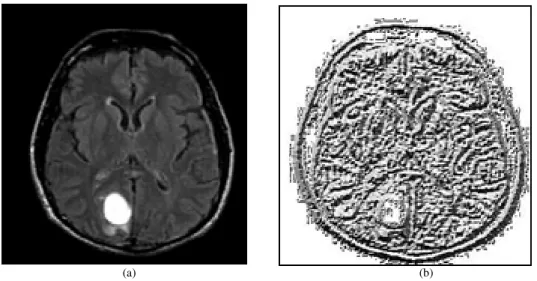
The MRI image is divided into several regions from which the LBP feature distributions are extracted and concatenated into an enhanced feature vector to be used as an image feature descriptor. The source brain image and its LBP feature image are shown in Fig. 2a and b respectively.
Fig. 2. (a) Source brain MR image (b) Local binary pattern feature MR image obtained using proposed method
3.2.3. Gray Level Based Features
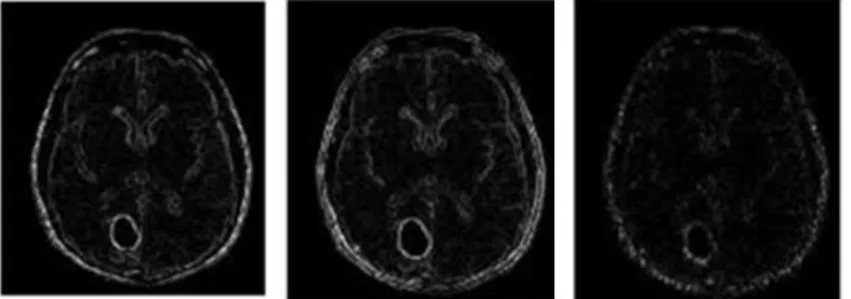
Gray level features help detect the tumours more easily as the blood vessel pixels are darker than its background pixels and gray level intensity variations between a candidate pixel and its surrounding pixels play a better role in classification and provide a better feature. Considering a small pixel region on the given brain image, with the described pixel at the centre, we develop a set of gray level based descriptors for the pre-processed image. Five feature images are extracted and given as follows Equation (5 to 9):
1 H
F (x, y)=I (x, y)−min{IH(s, t)} (5)
2 H H
F (x, y)=max{I (s, t)} I (x, y)− (6)
3 H H
F (x, y)=I (x, y)} m ean{I (s, t)}− (7)
4 H
F (x, y)=std{I (s, t)} (8)
5 H
F (x, y)=I (x, y) (9)
The gray level features extracted from the source image (Fig. 2a) are shown in Fig. 3.
3.2.4. Wavelet Features
Wavelets are small waves and are mathematical functions that represent scaled and shifted copies of a
finite-length waveform called the mother wavelet Equation (10):
a ,b
1 t b
(t)
a a
−
ψ = ψ
(10)
where, a is the scaling parameter and b is the shifting parameter.
A Wavelet Transform (WT) is based on wavelets. WT analyzes the image on different resolution scales and splits the image into various frequency components, i.e., multi-resolution image. This permits to view the spatial and frequency attributes of the image simultaneously.
The wavelet is discontinuous and resembles a step function. For a function f, the Haar WT is defined as Equation (11):
L L
f →(a d ) (11)
where, L is the decomposition level, a is the approximation sub-band and d is the detail sub-band.
Fig. 3. Gray level based feature extracted MR image simulated using MATLAB
(a) (b)
Fig. 4. Pyramid decomposition using discrete wavelet transform: (a) Decomposition at Level 1 (b) Decomposition at Level 2
3.2.5. Law’s Energy Texture Features
In this feature set, the 1D kernels of the brain image are converted into 2D filter kernels at the first step. Then, the input mammogram image is filtered with Law’s 2D kernels and the energy features of the image are calculated.
3.3. SVM Architecture
A Support Vector Machine (SVM) is a new and popular classifier which has self-learning features. SVMs were introduced by Vapnik (1998). SVM has been proved as one of the most accurate classifier with high efficiency. The SVM classifying technique, even though requires a very long training time, it is dimensionality independent and also feature space
independent. SVM is a feed forward network with a single layer of non-linear units and the classifying results of SVM are highly accurate. Its architecture has a good generalization of performance and aims at the implementation of structural risk minimization as explained in Vapnik Chervonenkis (VC) dimension theory.
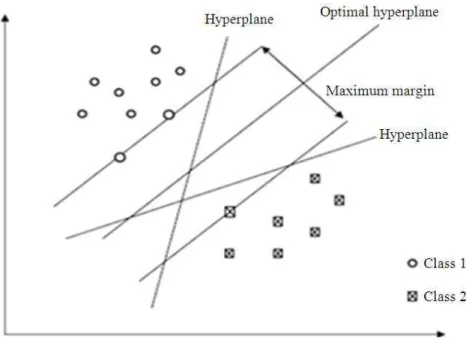
Fig. 5. SVM classification methodology In simple, SVM locates the hyper-plane that largely
separates the decision functions into two classes for the difficult dataset. In Fig. 5, the two classes are separated by a margin denoted by points marked as ‘X’s and ‘O’s after the location of hyper-plane using SVM classification. In this, the support vectors are present near the boundary of hyper-planes of the two classes.
If a projection Φ: X→H is used, the dot product is represented by a kernel function k Equation (12):
k(x, x ')=< Φ(x), (x ')Φ > (12)
Equation (12) tends to be less complex rather than projecting x and x’ explicitly into the feature space H.
4. RESULTS
To analyse the performance of the proposed algorithm to detect the tumours, the images obtained using the proposed methodology is compared with its corresponding ground truth images. The proposed technique is analyzed with the following quality parameters to study its performance:
• Sensitivity [Se = Tpos/(Tpos + Fneg)]
• Specificity [Sp = Tneg/(Tneg + Fpos)]
• Positive predictive value [Ppv = Tpos/(Tpos+Fpos)]
• Negative predictive value [Npv=Tneg/(Tneg+Fneg)]
• Accuracy [Acc = (Tpos+Tneg)/(Tpos+Fneg+Tneg+Fpos)]
where, Tpos is True positive, Tneg is True negative, Fpos is
False positive and Fneg is False negative.
The parameters, Se and Sp define the ratio of well-classified tumour pixels and non-tumour pixels, respectively. Ppv is the ratio of pixels classified as tumour pixels that have been correctly classified. Npv is the ratio of pixels classified as background pixels that are correctly classified. Lastly, Acc is the ratio of total well-detected and classified Tumour pixels. All these parameters help in defining the performance of our proposed technique as explained in the previous sections and are tabulated in Table 1.
The entire algorithm was developed based on MATLAB and the code takes 36 seconds per image on an average to run on a 2.1 GHz Intel Pentium Core i3 machine with 2GB RAM.
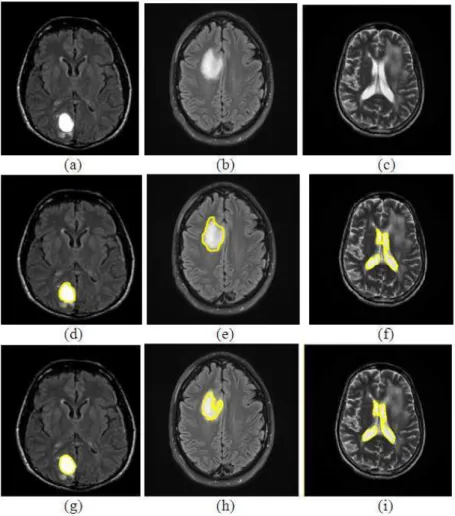
The original (source) images considered for our experiment are illustrated in Fig. 6a-c, ground truth images of the same (manually segmented images by a physiologist) are illustrated in Fig. 6d-f and lesion segmented images by our proposed method are depicted in Fig. 6g-i.
Fig. 6. (a-c) Source images, (d-f) Ground truth images, (g-i) tumour identified images using proposed method
5. CONCLUSION
In this research, a new approach for the segmentation and classification of brain tumor is proposed. It helps the physician and radiologist for brain tumor detection and diagnosis for tumor surgery. The local binary patterns and gray level co-occurrence features are extracted from brain images with benign and brain images with malignant and normal brain images. These extracted features are trained using SVM classifier in training mode. The same features are extracted from test brain image and classified with trained patterns using SVM classifier in classification mode. This proposed computer aided automation system for brain tumor segmentation and classification achieves 99.4% of sensitivity, 99.6% of specificity, 97.03% of positive predictive value and 99.5% of overall accuracy.
6. REFERENCES
Bauer, S., C. May, D. Dionysiou, G. Stamatakos and P. Buchler et al., 2012. Multiscale modeling for image analysis of brain tumor studies. IEEE Trans.
Biomed. Eng., 59: 25-29. DOI:
10.1109/TBME.2011.2163406
Corso, J.J., E. Sharon, S. Dube, S. El-Saden and U. Sinha et al., 2008. Efficient multilevel brain tumor segmentation with integrated Bayesian model classification. IEEE Trans. Med. Imag., 27: 629-640. DOI: 10.1109/TMI.2007.912817
Karimaghaloo, Z., M. Shah, S.J. Francis, D.L. Arnold and D.L. Collins et al., 2012. Automatic detection of gadolinium-enhancing multiple sclerosis lesions in brain MRI using conditional random fields. IEEE Trans. Med. Imag., 31: 1181-1193. DOI: 10.1109/TMI.2012.2186639
Kumar, G.V. and G.V. Raju, 2010. Biological early brain cancer detection using artificial neural network. Int. J. Comput. Sci. Eng., 2: 2721-2725.
Logeswari, T. and M. Karnan, 2010. An improved implementation of brain tumor detection using segmentation based on hierarchical self organizing map. Int. J. Comput. Theory Eng., 2: 591-595. Sharma, P., M. Diwakar and S. Choudhary, 2012.
Application of edge detection for brain tumor detection. Int. J. Comput. Applic., 58: 21-27. DOI: 10.5120/9366-3820
Sridhar, D. and I.V.M. Krishna, 2013. Brain tumor classification using discrete cosine transform and probabilistic neural network. Proceedings of the International Conference on Signal Processing, Image Processing and Pattern Recognition, Feb. 7-8, IEEE Xplore Press, Coimbatore, pp: 92-96. DOI: 10.1109/ICSIPR.2013.6497966
Tirpude, N. and R. Welekar, 2013. Automated detection and extraction of brain tumor from MRI images. Int. J. Comput. Applic., 77: 26-30. DOI: 10.5120/13383-1007