RESEARCH ARTICLE
Global Carrier Rates of Rare Inherited
Disorders Using Population Exome Sequences
Kohei Fujikura*
Kobe University School of Medicine, 7-5-1, Kusunoki-cho, Chuo-ku, Kobe, 650-0017, Japan *kofujikura@gmail.com
Abstract
Exome sequencing has revealed the causative mutations behind numerous rare, inherited disorders, but it is challenging to find reliable epidemiological values for rare disorders. Here, I provide a genetic epidemiology method to identify the causative mutations behind rare, inherited disorders using two population exome sequences (1000 Genomes and NHLBI). I created global maps of carrier rate distribution for 18 recessive disorders in 16 diverse ethnic populations. Out of a total of 161 mutations associated with 18 recessive dis-orders, I detected 24 mutations in either or both exome studies. The genetic mapping revealed strong international spatial heterogeneities in the carrier patterns of the inherited disorders. I next validated this methodology by statistically evaluating the carrier rate of one well-understood disorder, sickle cell anemia (SCA). The population exome-based epidemi-ology of SCA [African (allele frequency (AF) = 0.0454, N = 2447), Asian (AF = 0, N = 286), European (AF = 0.000214, N = 4677), and Hispanic (AF = 0.0111, N = 362)] was not signifi-cantly different from that obtained from a clinical prevalence survey. A pair-wise proportion test revealed no significant differences between the two exome projects in terms of AF (46/ 48 cases;P>0.05). I conclude that population exome-based carrier rates can form the foundation for a prospectively maintained database of use to clinical geneticists. Similar modeling methods can be applied to many inherited disorders.
Introduction
Recent advances in next-generation sequencing (NGS) technology have revolutionized the field of clinical genetics [1–4]. This technology has facilitated the identification of the novel causative genes for>3,000 inherited disorders, which are currently annotated in the Online Mendelian Inheritance in Man (OMIM) [2,3]. Most of these disorders are referred to as rare or orphan diseases because of their low incidence [5]. In clinical practice, molecular genetic testing is already being applied to screen for these inherited disorders [6]. However, the epide-miological information of many inherited disorders is completely insufficient and inconclusive. Particularly for rare diseases, epidemiology is a research field that remains largely unexplored by clinical geneticists and researchers [7]. Total global prevalence of all monogenic disorders at birth has been calculated to be several percent [5]. In Canada, it has been estimated that
single-PLOS ONE | DOI:10.1371/journal.pone.0155552 May 24, 2016 1 / 18
a11111
OPEN ACCESS
Citation:Fujikura K (2016) Global Carrier Rates of Rare Inherited Disorders Using Population Exome Sequences. PLoS ONE 11(5): e0155552. doi:10.1371/journal.pone.0155552
Editor:Klaus Brusgaard, Odense University Hospital, DENMARK
Received:January 9, 2016
Accepted:April 29, 2016
Published:May 24, 2016
Copyright:© 2016 Kohei Fujikura. This is an open access article distributed under the terms of the
Creative Commons Attribution License, which permits unrestricted use, distribution, and reproduction in any medium, provided the original author and source are credited.
Data Availability Statement:All relevant data are within the paper and its Supporting Information files.
Funding:The author has no support or funding to report.
gene disorders may account for approximately 40 percent of cases in pediatric practice [8]. Therefore, the public health impact of Mendelian diseases is a topic of growing interest world-wide. Reliable estimates of the populations affected by inherited diseases have become increas-ingly important to guide efficient allocation of public health resources in each country, region, and city [7,9,10].
The lack of epidemiologic studies of inherited disorders is particularly true for developing countries with limited resources [11–13]. Most epidemiologic researches have been conducted with individuals from Europe and North America, who represent only a fraction of the global population [11,12]. In developing countries, consultation rates, data collection methods, and population-based registries for inherited disorders vary considerably by urbanization grade and ambient environment [11–13].
To overcome these limitations I analyzed the global carrier rates of rare inherited disorders using geographical population exomes. The global map of the carrier rates showed strong pop-ulation-specificity and this prediction represented equivalent accuracy that may be achievable with clinical practice. This is an initial global overview of the carrier rate of genetic disorders using population exome sequences.
Results
Strategy for epidemiological research on Mendelian disorders using
population exome sequences
As an initial study toward determining the genetic epidemiology of inherited disorders, genetic pipelines from 1000 Genomes (1000G) [14,15] and National Heart, Lung, and Blood Institute (NHLBI) projects [16,17] were collected for variations with the potential to affect protein integrity (Fig 1). The dataset included the exome and its surrounding intronic sequences for 1,092 individuals (525 males, 567 females) of 14 ethnic origins and 6,503 individuals (2,443 males and 4,060 females) of two ethnic origins. Population demographics are summarized in
S1 Table. Caucasians comprised 34.7% and 66.1% of subjects from the 1000G and NHLBI
groups, respectively. Asian and Hispanic populations, which were represented only in the 1000G, constituted 26.2% and 16.6% of the group, respectively. A total of 65.9% were female. Many samples were from within the United States; a minority were from China, Japan, Colom-bia, Mexico, Puerto Rico, Finland, England, Spain, Germany, Italia, Nigeria and Kenya. These populations under the study are likely depleted for individuals with rare genetic disorders, but when the prevalence rates are so close to 0 (<0.25%) under Hardy-Weinberg equilibrium the carrier rate is usually approximated as follows:
p2
þ2pq0:5¼p2
þpqpq ð1Þ
wherepandqindicates allele frequencies andp+q= 1 (p<0.05;q>0.95).
Disease panels used in this initial study were as follows: Sickle cell anemia (SCA; OMIM #603903); Primary immunodeficiency (Mucocutaneous fungal infection) (#613108); Pituitary hormone deficiency, combined 2 (CPHD2; #262600); Canavan disease (#271900); Pustular pso-riasis (No description in OMIM); Rod-cone dystrophy (RCD; #615780); Primary autosomal recessive microcephaly 1 (MCPH1; #251200); Seckel syndrome 5 (SCKL5; #613823); Pontocere-bellar hypoplasia type 1B (PCH1B; #614678); Miller syndrome (#263750); Facial dysmorphism, lens dislocation, anterior-segment abnormalities, and spontaneous filtering blebs (FDLAB, or Traboulsi syndrome; #601552); Carpenter syndrome 1 (CRPT1; #201000); Glucocorticoid deficiency 4 (GCCD4; #614736); Childhood-onset dilated cardiomyopathy (#615916); Usher syndrome type 1J (USH1J; #614869); Aicardi-Goutières syndrome 6 (AGS6; #615010); 3-methyl-glutaconic aciduria with deafness, encephalopathy, and Leigh-like syndrome (MEGDEL
Population Exome-Based Epidemiology
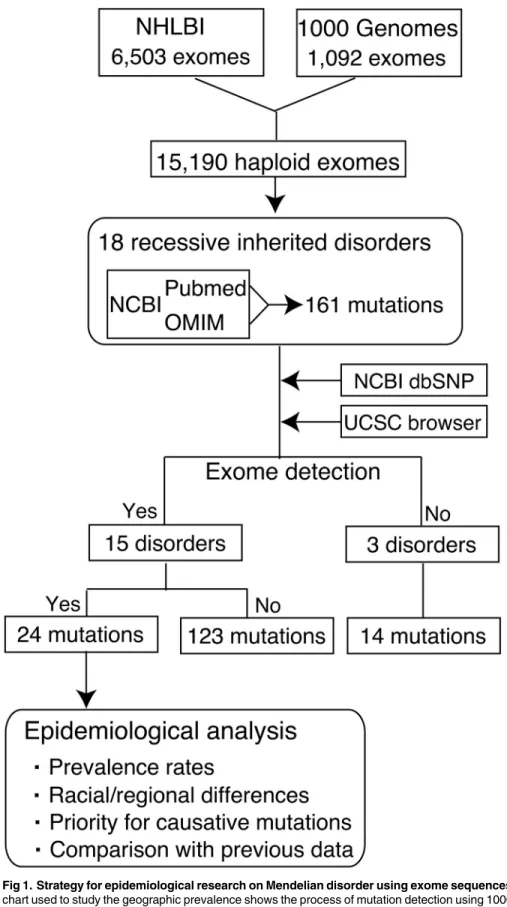
Fig 1. Strategy for epidemiological research on Mendelian disorder using exome sequences.A flow chart used to study the geographic prevalence shows the process of mutation detection using 1000G and NHLBI datasets. A total of 15,190 haploid exomes were screened for 161 causative mutations linked to 18 genetic disorders. Several platforms (NCBI dbSNP and UCSC Browser) were used to access the validity of mutations and examine previous information on gene annotations and alleles.
doi:10.1371/journal.pone.0155552.g001
Population Exome-Based Epidemiology
syndrome; #614739); and Severe dermatitis, multiple allergies and metabolic wasting syndrome (SAM syndrome; #615508) (S2 Table). The list of mutations was manually collated from all liter-ature sources published over a wide period (from 1957 to 2014) (SeeS2 Table). In addition, sev-eral gene/disease annotation systems, including NCBI Entrez and OMIM, were used to identify disease-causing mutations (Fig 1). I identified a total of 161 mutations associated with 18 reces-sive diseases (S2 Table), of which 24 mutations were detected in both or either of the two exome datasets (Table 1). 15 genetic diseases were detected in a total of 7,595 individuals while three dis-orders, childhood-onset dilated cardiomyopathy, USH1J, and SAM syndrome, were not (Fig 1). Causative alleles were classified by mutation type, carrier rate, racial group, and clinical impact
(Fig 1andTable 1).
Disease carrier states of Mendelian disorders
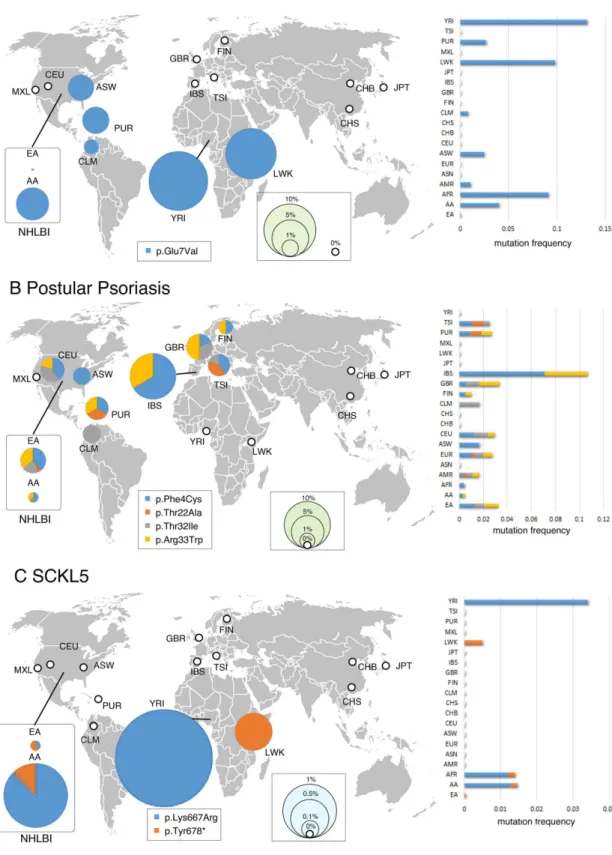
As expected, among 15 genetic diseases detected, the most common was SCA, with a frequency of 1 in 66.6 (1.50%) (Table 1). In contrast, MCPH1 was the rarest disorder, with a frequency of 1 in 14,160 (0.0071%). In addition, carrier prediction unexpectedly revealed high carrier rates (1 in 254.0) forCEP152mutations for SCKL5. Carrier statistics are fully reported inTable 1.
Carrier rate variability by race and ethnicity
Carrier frequencies for disease-causing mutations varied significantly by racial and ethnic groups although the sample size is not so large in Hispanics and Asians [7,9,10].Fig 2shows the global map of carrier distribution of eight causative mutations for three Mendelian disor-ders. For example, an average of 0.11% of individuals were carriers for Miller syndrome, but the frequency ranged from 0.18% of European individuals to 0% of Africans, Asians, and His-panics (Fig 2C). For ethnic groups such as European, this higher frequency was unreported before and thus suggest that the European population is right target for screening for Miller syndrome. Among 15,190 haploid exomes, causative alleles for seven disorders (SCA, SCKL5, Primary immunodeficiency, Canavan disease, Pustular psoriasis, CRPT1 and AGS6) were more or less prevalent in both African and European populations (Fig 2andTable 1). In con-trast, mutations for the other eight disorders (CPHD2, RCD, MCPH1, PCH1B, Miller syn-drome, FDLAB, GCCD4 and MEGDEL syndrome) were observed only in Europeans while they were not detected in other populations. There were no carriers for any of the 18 inherited disorders among the dataset from Asian populations.
Estimated carrier rates correspond to those seen in clinical practice
SCA is an inherited blood-related disorder that affects hemoglobin and is characterized pri-marily by chronic anemia and periodic pain episodes [18,19]. A mutation in theHBBgene, commonly called Hemoglobin S (HbS), causes SCA [18,19]. SCA is common among persons whose ancestors descended from tropical regions, particularly Sub-Saharan Africa, South America, Saudi Arabia, India, and Mediterranean countries (e.g. Italy, Greece, and Turkey) [18,19]. The CDC has reported that in the United States, SCA affects approximately 90,000–
100,000 persons, most of whom have ancestors of African descent [20]. The disease occurs in about 1 in every 500 African-American births and 1 in every 36,000 [20] (or 1,000–1,400 [21]; the incidence rate is controversial) Hispanic-American births. However, highly accurate epide-miological studies based on clinical practice are still rare.
Table 2shows, for 14 + 2 ethnic groups in the dataset, my estimates and literature estimates
for carrier frequency for SCA. Predicted carrier rates were not statistically different from clini-cal geographic prevalence [20–22] and Bayesian geostatistical map of HbS allele [23] (Table 2). There were no notable outliers, but I observed significantly higher carrier frequencies than
Population Exome-Based Epidemiology
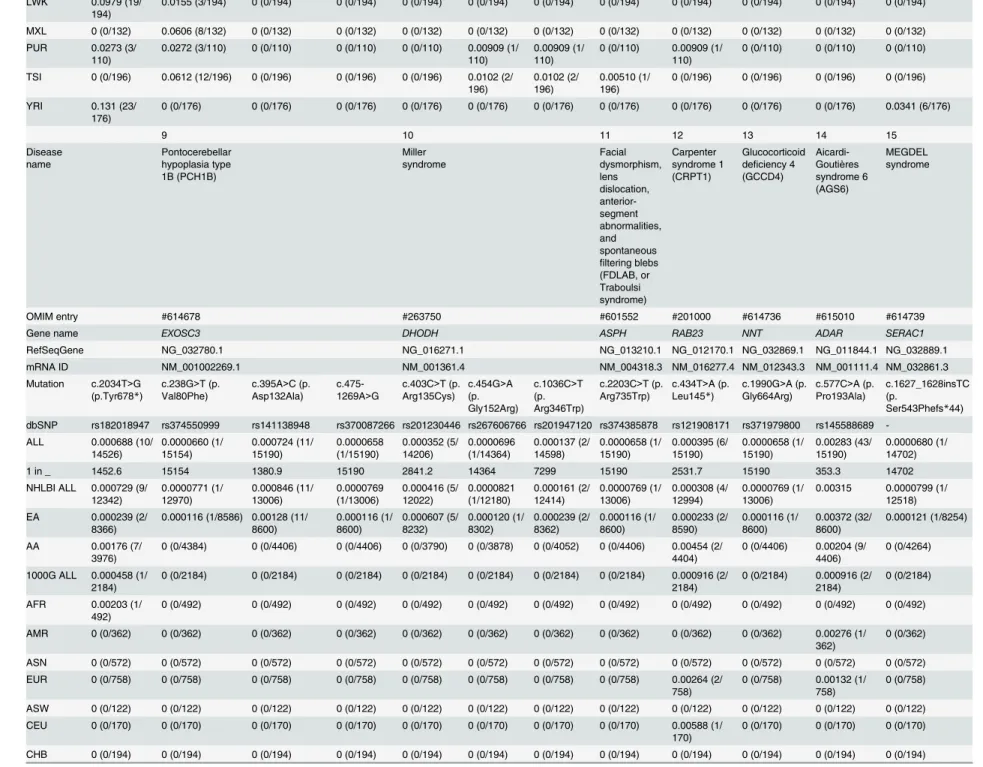
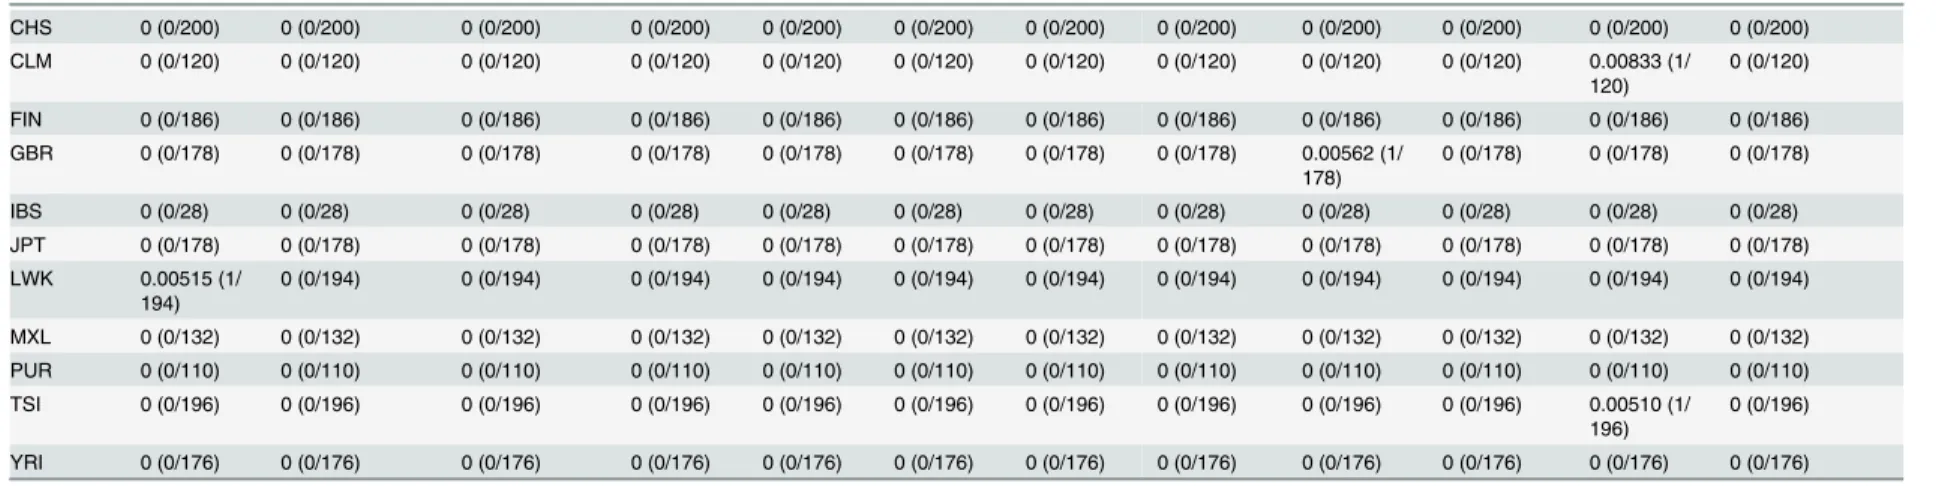
Table 1. Estimated carrier rates of 15 Mendelian disorders by race, ethnicity, and country. The information about the mutation and carrier rate is shown in this figure. Pustular psoriasis caused by is yet described in OMIM. The abbreviations are as follows: AA, African Americans; EA, European Americans; ASW, American’s of African Ancestry in SW; CEU, Utah Residents (CEPH) with Northern and Western European ancestry; CHB, Han Chinese in Beijing; CHS, Southern Han Chinese; CLM, Colombian from Medellin; FIN, Finnish in Fin-land; GBR, British in EngFin-land; IBS, Iberian population in Spain; JPT, Japanese in Tokyo; LWK, Luhya in Webuye; MXL, Mexican ancestry from Los Angeles; PUR, Puerto Rico from Puerto Rica; TSI, Toscani in Italia; YRI, Yoruba in Ibadan.
1 2 3 4 5 6 7 8
Disease name
Sickle cell anemia (SCA)
Primary immunodeficiency (Mucocutaneous fungal infection)
Pituitary hormone deficiency, combined 2 (CPHD2) Canavan disease Pustular psoriasis Rod-cone dystrophy (RCD) Primary autosomal recessive microcephaly 1 (MCPH1)
Seckel syndrome 5 (SCKL5)
OMIM entry #603903 #613108 #262600 #271900 No description #615780 #251200 #613823
Gene name HBB CLEC7A PROP1 ASPA AP1S3 PLK1S1 MCPH1 CEP152
RefSeqGene NG_000007.3 NG_016291.1 NG_015889.1 NG_008399.1 NG_034017.1 NG_033122.1 NG_016619.1 NG_027518.1
mRNA ID NM_000518.4 NM_197947.2 NM_006261.4 NM_000049.2 NM_001039569.1 NM_018474.4 NM_024596.3 NM_001194998.1
Mutation c.20A>T (p. Glu7Val)
c.714T>G (p. Tyr238*)
c.301_302delAG (p.
Leu102Cysfs*8)
c.854A>C (p. Glu285Ala)
c.914C>A (p. Ala305Glu)
c.11T>G (p. Phe4Cys)
c.64A>G (p. Thr22Ala)
c.95C>T (p. Thr32Ile)
c.97C>T (p. Arg33Trp)
c.226C>T (p. Arg76*)
c.74C>G (p. Ser25*)
c.2000A>G (p. Lys667Arg)
dbSNP rs77121243 rs16910526 rs193922688 rs28940279 rs28940574 rs116107386 rs149183052 rs78536455 rs138292988 rs202210819 rs121434305 rs200879436
ALL 0.0150 (228/ 15182) 0.0572 (869/ 15190) 0.000612 (9/ 14702) 0.000197 (3/ 15190) 0.000132 (2/ 15190) 0.00889 (126/14180) 0.00113 (16/ 14098) 0.00459 (65/ 14166) 0.00776 (109/ 14054) 0.000357 (5/ 14024) 0.000071 (1/ 14160) 0.0039 (56/14226)
1 in _ 66.6 17.5 1633.6 5063.3 7595 112.5 881.1 217.9 128.9 2804.8 14160 254
NHLBI ALL 0.0138 (179/ 12998) 0.0611 (795/ 13006) 0.000719 (9/ 12518) 0.000231 (3/ 13006) 0.000154 (2/ 13006) 0.00959 (115/11996) 0.00109 (13/ 11914) 0.00484 (58/ 11982) 0.00859 (102/ 11870) 0.000422 (5/ 11840) 0.0000835 (1/ 11976) 0.00415 (50/ 12042)
EA 0.000233 (2/
8596)
0.0790 (679/8600) 0.00109 (9/8254) 0.000233 (2/ 8600) 0.000233 (2/ 8600) 0.0128 (105/ 8232) 0.00134 (11/ 8188) 0.00688 (57/ 8280) 0.0116 (95/ 8174) 0.000611 (5/ 8180) 0.000122 (1/ 8222) 0.000122 (1/8230)
AA 0.0402 (177/
4402)
0.0263 (116/4406) 0 (0/4264) 0.000227 (1/ 4406)
0 (0/4406) 0.00266 (10/ 3764) 0.000537 (2/ 3726) 0.000270 (1/ 3702) 0.00189 (7/ 3696)
0 (0/3660) 0 (0/3754) 0.0129 (49/3812)
1000G ALL 0.0224 (49/ 2184)
0.0339 (74/2184) 0 (0/2184) 0 (0/2184) 0 (0/2184) 0.00504 (11/ 2184) 0.00137 (3/ 2184) 0.00321 (7/ 2184) 0.00321 (7/ 2184)
0 (0/2184) 0 (0/2184) 0.00275 (6/2184)
AFR 0.0915 (45/ 492)
0.0142 (7/492) 0 (0/492) 0 (0/492) 0 (0/492) 0.00407 (2/ 492)
0 (0/492) 0 (0/492) 0 (0/492) 0 (0/492) 0 (0/492) 0.0122 (6/492)
AMR 0.0110 (4/
362)
0.0442 (16/362) 0 (0/362) 0 (0/362) 0 (0/362) 0.00276 (1/ 362) 0.00276 (1/ 362) 0.00552 (2/ 362) 0.00588 (1/ 362)
0 (0/362) 0 (0/362) 0 (0/362)
ASN 0 (0/572) 0 (0/572) 0 (0/572) 0 (0/572) 0 (0/572) 0 (0/572) 0 (0/572) 0 (0/572) 0 (0/572) 0 (0/572) 0 (0/572) 0 (0/572) EUR 0 (0/758) 0.0673 (51/758) 0 (0/758) 0 (0/758) 0 (0/758) 0.0106 (8/
758) 0.00264 (2/ 758) 0.00660 (5/ 758) 0.00792 (6/ 758)
0 (0/758) 0 (0/758) 0 (0/758)
ASW 0.0246 (3/
122)
0.0328 (4/122) 0 (0/122) 0 (0/122) 0 (0/122) 0.0164 (2/ 122)
0 (0/122) 0 (0/122) 0 (0/122) 0 (0/122) 0 (0/122) 0 (0/122)
CEU 0 (0/170) 0.0824 (14/170) 0 (0/170) 0 (0/170) 0 (0/170) 0.0118 (2/ 170)
0 (0/170) 0.0118 (2/170) 0.00588 (1/ 170)
0 (0/170) 0 (0/170) 0 (0/170)
CHB 0 (0/194) 0 (0/194) 0 (0/194) 0 (0/194) 0 (0/194) 0 (0/194) 0 (0/194) 0 (0/194) 0 (0/194) 0 (0/194) 0 (0/194) 0 (0/194)
CHS 0 (0/200) 0 (0/200) 0 (0/200) 0 (0/200) 0 (0/200) 0 (0/200) 0 (0/200) 0 (0/200) 0 (0/200) 0 (0/200) 0 (0/200) 0 (0/200) CLM 0.00833 (1/
120)
0.0417 (5/120) 0 (0/120) 0 (0/120) 0 (0/120) 0 (0/120) 0 (0/120) 0.0167 (2/120) 0 (0/120) 0 (0/120) 0 (0/120) 0 (0/120)
FIN 0 (0/186) 0.0538 (10/186) 0 (0/186) 0 (0/186) 0 (0/186) 0.00538 (1/ 186)
0 (0/186) 0 (0/186) 0.00538 (1/ 186)
0 (0/186) 0 (0/186) 0 (0/186)
GBR 0 (0/178) 0.0787 (14/178) 0 (0/178) 0 (0/178) 0 (0/178) 0.00562 (1/ 178)
0 (0/178) 0.0112 (2/178) 0.0169 (3/ 178)
0 (0/178) 0 (0/178) 0 (0/178)
IBS 0 (0/28) 0.0357 (1/28) 0 (0/28) 0 (0/28) 0 (0/28) 0.071 (2/28) 0 (0/28) 0 (0/28) 0.0357 (1/28) 0 (0/28) 0 (0/28) 0 (0/28) JPT 0 (0/178) 0 (0/178) 0 (0/178) 0 (0/178) 0 (0/178) 0 (0/178) 0 (0/178) 0 (0/178) 0 (0/178) 0 (0/178) 0 (0/178) 0 (0/178)
(Continued)
Table 1. (Continued)
LWK 0.0979 (19/ 194)
0.0155 (3/194) 0 (0/194) 0 (0/194) 0 (0/194) 0 (0/194) 0 (0/194) 0 (0/194) 0 (0/194) 0 (0/194) 0 (0/194) 0 (0/194)
MXL 0 (0/132) 0.0606 (8/132) 0 (0/132) 0 (0/132) 0 (0/132) 0 (0/132) 0 (0/132) 0 (0/132) 0 (0/132) 0 (0/132) 0 (0/132) 0 (0/132)
PUR 0.0273 (3/
110)
0.0272 (3/110) 0 (0/110) 0 (0/110) 0 (0/110) 0.00909 (1/ 110)
0.00909 (1/ 110)
0 (0/110) 0.00909 (1/ 110)
0 (0/110) 0 (0/110) 0 (0/110)
TSI 0 (0/196) 0.0612 (12/196) 0 (0/196) 0 (0/196) 0 (0/196) 0.0102 (2/ 196)
0.0102 (2/ 196)
0.00510 (1/ 196)
0 (0/196) 0 (0/196) 0 (0/196) 0 (0/196)
YRI 0.131 (23/
176)
0 (0/176) 0 (0/176) 0 (0/176) 0 (0/176) 0 (0/176) 0 (0/176) 0 (0/176) 0 (0/176) 0 (0/176) 0 (0/176) 0.0341 (6/176)
9 10 11 12 13 14 15
Disease name Pontocerebellar hypoplasia type 1B (PCH1B) Miller syndrome Facial dysmorphism, lens dislocation, anterior-segment abnormalities, and spontaneous
filtering blebs (FDLAB, or Traboulsi syndrome) Carpenter syndrome 1 (CRPT1) Glucocorticoid deficiency 4 (GCCD4)
Aicardi-Goutières syndrome 6 (AGS6)
MEGDEL syndrome
OMIM entry #614678 #263750 #601552 #201000 #614736 #615010 #614739
Gene name EXOSC3 DHODH ASPH RAB23 NNT ADAR SERAC1
RefSeqGene NG_032780.1 NG_016271.1 NG_013210.1 NG_012170.1 NG_032869.1 NG_011844.1 NG_032889.1
mRNA ID NM_001002269.1 NM_001361.4 NM_004318.3 NM_016277.4 NM_012343.3 NM_001111.4 NM_032861.3
Mutation c.2034T>G (p.Tyr678*)
c.238G>T (p. Val80Phe)
c.395A>C (p. Asp132Ala)
c.475-1269A>G
c.403C>T (p. Arg135Cys)
c.454G>A (p. Gly152Arg)
c.1036C>T (p. Arg346Trp)
c.2203C>T (p. Arg735Trp)
c.434T>A (p. Leu145*)
c.1990G>A (p. Gly664Arg)
c.577C>A (p. Pro193Ala)
c.1627_1628insTC (p.
Ser543Phefs*44)
dbSNP rs182018947 rs374550999 rs141138948 rs370087266 rs201230446 rs267606766 rs201947120 rs374385878 rs121908171 rs371979800 rs145588689
-ALL 0.000688 (10/ 14526) 0.0000660 (1/ 15154) 0.000724 (11/ 15190) 0.0000658 (1/15190) 0.000352 (5/ 14206) 0.0000696 (1/14364) 0.000137 (2/ 14598) 0.0000658 (1/ 15190) 0.000395 (6/ 15190) 0.0000658 (1/ 15190) 0.00283 (43/ 15190) 0.0000680 (1/ 14702)
1 in _ 1452.6 15154 1380.9 15190 2841.2 14364 7299 15190 2531.7 15190 353.3 14702
NHLBI ALL 0.000729 (9/ 12342) 0.0000771 (1/ 12970) 0.000846 (11/ 13006) 0.0000769 (1/13006) 0.000416 (5/ 12022) 0.0000821 (1/12180) 0.000161 (2/ 12414) 0.0000769 (1/ 13006) 0.000308 (4/ 12994) 0.0000769 (1/ 13006)
0.00315 0.0000799 (1/ 12518)
EA 0.000239 (2/
8366)
0.000116 (1/8586) 0.00128 (11/ 8600) 0.000116 (1/ 8600) 0.000607 (5/ 8232) 0.000120 (1/ 8302) 0.000239 (2/ 8362) 0.000116 (1/ 8600) 0.000233 (2/ 8590) 0.000116 (1/ 8600) 0.00372 (32/ 8600) 0.000121 (1/8254)
AA 0.00176 (7/
3976)
0 (0/4384) 0 (0/4406) 0 (0/4406) 0 (0/3790) 0 (0/3878) 0 (0/4052) 0 (0/4406) 0.00454 (2/ 4404)
0 (0/4406) 0.00204 (9/ 4406)
0 (0/4264)
1000G ALL 0.000458 (1/ 2184)
0 (0/2184) 0 (0/2184) 0 (0/2184) 0 (0/2184) 0 (0/2184) 0 (0/2184) 0 (0/2184) 0.000916 (2/ 2184)
0 (0/2184) 0.000916 (2/ 2184)
0 (0/2184)
AFR 0.00203 (1/ 492)
0 (0/492) 0 (0/492) 0 (0/492) 0 (0/492) 0 (0/492) 0 (0/492) 0 (0/492) 0 (0/492) 0 (0/492) 0 (0/492) 0 (0/492)
AMR 0 (0/362) 0 (0/362) 0 (0/362) 0 (0/362) 0 (0/362) 0 (0/362) 0 (0/362) 0 (0/362) 0 (0/362) 0 (0/362) 0.00276 (1/ 362)
0 (0/362)
ASN 0 (0/572) 0 (0/572) 0 (0/572) 0 (0/572) 0 (0/572) 0 (0/572) 0 (0/572) 0 (0/572) 0 (0/572) 0 (0/572) 0 (0/572) 0 (0/572)
EUR 0 (0/758) 0 (0/758) 0 (0/758) 0 (0/758) 0 (0/758) 0 (0/758) 0 (0/758) 0 (0/758) 0.00264 (2/ 758)
0 (0/758) 0.00132 (1/ 758)
0 (0/758)
ASW 0 (0/122) 0 (0/122) 0 (0/122) 0 (0/122) 0 (0/122) 0 (0/122) 0 (0/122) 0 (0/122) 0 (0/122) 0 (0/122) 0 (0/122) 0 (0/122)
CEU 0 (0/170) 0 (0/170) 0 (0/170) 0 (0/170) 0 (0/170) 0 (0/170) 0 (0/170) 0 (0/170) 0.00588 (1/ 170)
0 (0/170) 0 (0/170) 0 (0/170)
CHB 0 (0/194) 0 (0/194) 0 (0/194) 0 (0/194) 0 (0/194) 0 (0/194) 0 (0/194) 0 (0/194) 0 (0/194) 0 (0/194) 0 (0/194) 0 (0/194)
(Continued)
Table 1. (Continued)
CHS 0 (0/200) 0 (0/200) 0 (0/200) 0 (0/200) 0 (0/200) 0 (0/200) 0 (0/200) 0 (0/200) 0 (0/200) 0 (0/200) 0 (0/200) 0 (0/200)
CLM 0 (0/120) 0 (0/120) 0 (0/120) 0 (0/120) 0 (0/120) 0 (0/120) 0 (0/120) 0 (0/120) 0 (0/120) 0 (0/120) 0.00833 (1/ 120)
0 (0/120)
FIN 0 (0/186) 0 (0/186) 0 (0/186) 0 (0/186) 0 (0/186) 0 (0/186) 0 (0/186) 0 (0/186) 0 (0/186) 0 (0/186) 0 (0/186) 0 (0/186)
GBR 0 (0/178) 0 (0/178) 0 (0/178) 0 (0/178) 0 (0/178) 0 (0/178) 0 (0/178) 0 (0/178) 0.00562 (1/ 178)
0 (0/178) 0 (0/178) 0 (0/178)
IBS 0 (0/28) 0 (0/28) 0 (0/28) 0 (0/28) 0 (0/28) 0 (0/28) 0 (0/28) 0 (0/28) 0 (0/28) 0 (0/28) 0 (0/28) 0 (0/28)
JPT 0 (0/178) 0 (0/178) 0 (0/178) 0 (0/178) 0 (0/178) 0 (0/178) 0 (0/178) 0 (0/178) 0 (0/178) 0 (0/178) 0 (0/178) 0 (0/178) LWK 0.00515 (1/
194)
0 (0/194) 0 (0/194) 0 (0/194) 0 (0/194) 0 (0/194) 0 (0/194) 0 (0/194) 0 (0/194) 0 (0/194) 0 (0/194) 0 (0/194)
MXL 0 (0/132) 0 (0/132) 0 (0/132) 0 (0/132) 0 (0/132) 0 (0/132) 0 (0/132) 0 (0/132) 0 (0/132) 0 (0/132) 0 (0/132) 0 (0/132) PUR 0 (0/110) 0 (0/110) 0 (0/110) 0 (0/110) 0 (0/110) 0 (0/110) 0 (0/110) 0 (0/110) 0 (0/110) 0 (0/110) 0 (0/110) 0 (0/110)
TSI 0 (0/196) 0 (0/196) 0 (0/196) 0 (0/196) 0 (0/196) 0 (0/196) 0 (0/196) 0 (0/196) 0 (0/196) 0 (0/196) 0.00510 (1/ 196)
0 (0/196)
YRI 0 (0/176) 0 (0/176) 0 (0/176) 0 (0/176) 0 (0/176) 0 (0/176) 0 (0/176) 0 (0/176) 0 (0/176) 0 (0/176) 0 (0/176) 0 (0/176)
doi:10.1371/journal.pone.0155552.t001
Populatio
n
Exome-Ba
sed
Epidemiol
ogy
PLOS
ONE
|DOI:10.137
1/journal.p
one.0155552
May
24,
2016
7/1
Fig 2. Geographical minor allele frequency distribution for the causative mutations of representative three Mendelian disorders.Pie areas are proportional to the minor allele frequency of the causative mutations for three inherited diseases (A: SCA, B: Pustular psoriasis, C: Miller syndrome). 1000G and NHLBI (2 + 14) populations are displayed separately. The thick white circle indicates the absence (0%) of mutations in the population. The right bar chart shows the mutation minor allele frequency in each population. A world map was obtained from Free Editable Worldmap (http://free-editable-worldmap-for-powerpoint.en.softonic.com/) and modified.
doi:10.1371/journal.pone.0155552.g002
Population Exome-Based Epidemiology
expected for SCA in two populations (LWK (1000G, 9.79%) and PUR (1000G, 2.73%)) (P<0.01) (Table 2). It is possible that the collected population was geographically distinct at these loci relative to prior studies. As expected, the HbS allele in African populations (NHLBI, 4.02%; 1000G, 9.15%) was detected at a significantly higher rate than in all European popula-tions (NHLBI, 0.0233%; 1000G, 0%), Hispanics (1000G, 1.10%), and Asians (1000G, 0%) (P<0.01) (Table 2).
The prevalence rates of SCA in Hispanic Americans are controversial (1 in 36,000 [20] or 1 in 1,000–1,400 [21]), but the projected carrier rate here could support both data depending on the ancestral origin (Table 2). Taken together, exome-based estimates corresponded to those in the clinical prevalence survey and represented equivalent accuracy that may be achievable in clinical practice.
Screening priority for genetic testing
Current genetic testing is generally performed according to the ranking of carrier rates of the target mutations. Yet, precise data of targeted panel of genetic testing is not sufficient in clinical practice due to the large number of rare disorders. This tendency is particularly true for recently
Table 2. Comparison of predicted exome-based carrier rates with previous clinical estimates.TheP -value is calculated from Chi-square tests between two carrier estimates.
Allele frequency Ethnic
group
Country This study Previous study (+reference)
P value
NHLBI EA USA 0.000233 (2/
8596)
-
-AA USA 0.0402 (177/
4402)
0.0447–0.0577 (*1) 6.46E-07-0.149
1000G AFR 0.0915 (45/492) 0.0447–0.0577 (*1)
12.7E-05-0.0013 AMR 0.0110 (4/362) 0.00527–0.0316 (*1,2) 0.0206–0.252
ASN 0 (0/572) 0 (*3,4) NA
EUR 0 (0/758) -
-ASW USA 0.0246 (3/122) 0.0447–0.0577 (*1) 0.148–0.401
CEU USA 0 (0/170) -
-CHB China 0 (0/194) 0 (*4) NA
CHS China 0 (0/200) 0 (*4) NA
CLM Colombia 0.00833 (1/120) 0.008 (*4) 0.967
FIN Finland 0 (0/186) 0 (*4) NA
GBR England 0 (0/178) 0.009 (*4) 0.204
IBS Spain 0 (0/28) 0.007 (*4) 0.657
JPT Japan 0 (0/178) 0 (*4) NA
LWK Kenya 0.0979 (19/194) 0.038 (*4) 0.000346
MXL Mexico 0 (0/132) 0.007 (*4) 0.335
PUR Puerto
Rico
0.0273 (3/110) 0.004 (*4) 0.0001
TSI Italy 0 (0/196) 0.005 (*4) 0.321
YRI Nigeria 0.131 (23/176) 0.171 (*4) 0.155
Previously reported carrier rates are derived from four references (*1; National Center for Disease Control (http://www.cdc.gov/ncbddd/sicklecell/data.html),*2; Morton DA.Medical Issues in Social Security Disability2013;*3,Modell B, et al.Bull World Health Organ2008;*4, Piel FB, et al.Lancet2013).
doi:10.1371/journal.pone.0155552.t002
Population Exome-Based Epidemiology
identified causative genes. Here, I demonstrated that the exome-based methods made it possible to identify a small number of high-priority nonsense and missense mutations linked to genetic disorders (Table 1). For example, the data suggests that, among six causative mutations for PCH1B, only one mutation (p.Asp132Ala,) should be high priority forEXOSC3mutation screening in European populations, whereas other mutations are speculated to be quite rare
(Table 1). The ranking of carrier rates of mutations was as follows: p.Asp132Ala (NHLBI EA,
0.128%)>p.Val80Phe (0.0116%) = c.475-1269A>G (0.0116%)>other mutations (0%). In the case of Miller syndrome, for which mutations have been reported in several papers, three muta-tions [p.Arg135Cys (NHLBI EA, 0.0607%), p.Gly152Arg (0.120%), and p.Arg346Try (0.161%)] should be given first priority forDHODHmutation screening in Europeans but not Africans. A different tendency was obtained for SCKL5: two mutations [p.Lys667Arg (NHLBI AA, 1.29%) and p.Tyr678(0.176%)] occupied a central position in African populations (Table 1). These frequent mutations were detected in the 1000G dataset [p.Lys667Arg (1000G AFR, 1.22%) and p.Tyr678(0.203%)]. Taken together, these data will allow the formulation of a suitable muta-tion panel that can be applied to determine the priority of genetic testing in clinical practice.
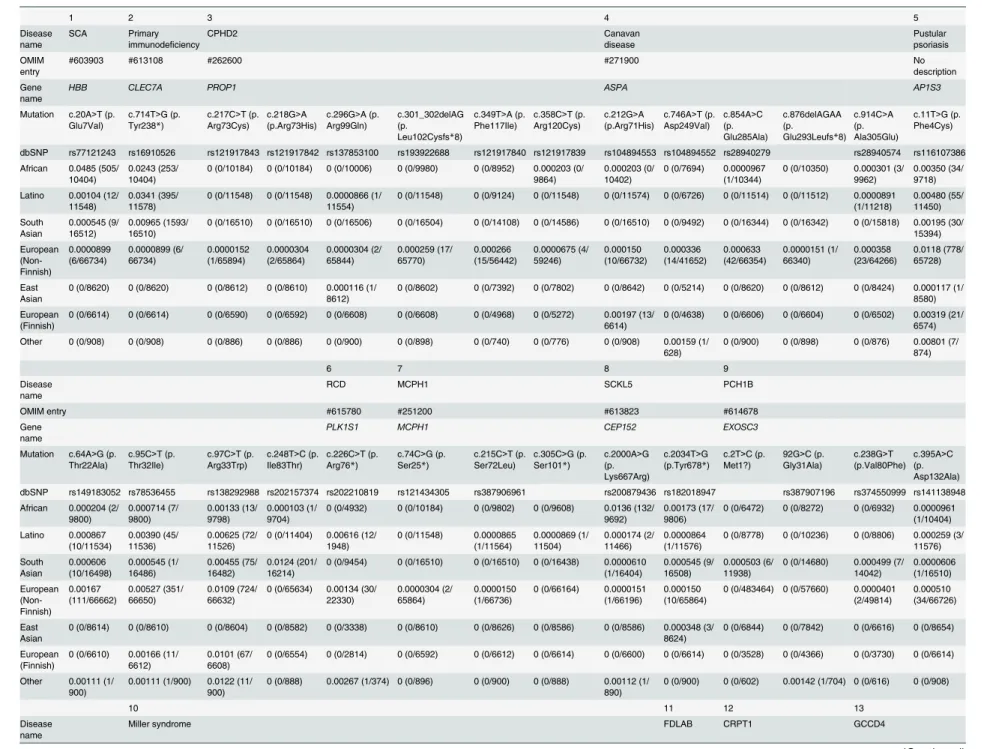
I further searched for undetected mutations using the Exome Aggregation Consortium (ExAC), which summarizes and categorizes exome data of 60,706 unrelated individuals from a variety of large-scale sequencing projects into six races (Table 3). The ExAC dataset detected additional 29 mutations although this data did not provide country-by-country genetic epide-miology of inherited disorders (Table 3). This result suggested that larger sample sizes and/or combinational use of a set of large exome sequencing projects could allow for more accurate prediction of carrier rates.
Consistency of data between two different exome sequencing projects
I next examined the extent of differences in two exome-based carrier rates by comparing carrier rates in African and European ancestries between 1000G and NHLBI datasets. A pair-wise pro-portions test [24] was used, which was appropriate to test the null hypothesis stating that pro-portions in the two estimates were significantly different. This formula is referred to as a z-test because the statistic was as follows:
Z¼ ðp1
^
p2^
Þ=½p^
ð1 p^
Þð1=n1þ1=n2Þ 1=2
ð2Þ
where p^= (p1+ p2)/(n1+ n2) and the indices (1, 2) refer to thefirst and second column of the
table. A pair-wise proportion test between two exome resources showed no significant differ-ences between the two different exome studies (46 cases;P>>0.05), except in two African cases (P<0.05) (S3 Table). Thisfinding raises the possibility that exome-based predictions are divorced from sources of various arbitrary errors (e.g., diagnostic capacity) and may be an objective indicator.
Risk simulation and mutation detection rate of autosomal recessive
disease
Finally simple deterministic formulae were introduced to predict the mutation detection rate of genetic risk using exome studies assuming a single-gene disease with an autosomal recessive inheritance pattern. The formula of the mutation detection rate (D) of Mendelian disorders was as follows:
D¼ ½1 f1 pð1 sÞgN ð3Þ
whereprefers to the mutation carrier rate in each population, andσindicates the error rate of Population Exome-Based Epidemiology
Table 3. Estimated carrier rates of 17 Mendelian disorders using ExAC data.The carrier rates of Mendelian disorders were estimated using ExAC dataset. Child-hood cardiomy-opathy (MIM no description) and Usher syndrome type 1J (USH1J) (#614869) were detected in ExAC but not in 1000G and NHLBI. ExAC populations are largely divided into six races: African, Latino, European (non-Finnish), European (Finnish), South Asian, East Asian, and Other.
1 2 3 4 5
Disease name
SCA Primary immunodeficiency
CPHD2 Canavan disease Pustular psoriasis OMIM entry
#603903 #613108 #262600 #271900 No
description Gene
name
HBB CLEC7A PROP1 ASPA AP1S3
Mutation c.20A>T (p. Glu7Val)
c.714T>G (p. Tyr238*)
c.217C>T (p. Arg73Cys) c.218G>A (p.Arg73His) c.296G>A (p. Arg99Gln) c.301_302delAG (p.
Leu102Cysfs*8)
c.349T>A (p. Phe117Ile) c.358C>T (p. Arg120Cys) c.212G>A (p.Arg71His) c.746A>T (p. Asp249Val) c.854A>C (p. Glu285Ala) c.876delAGAA (p.
Glu293Leufs*8) c.914C>A (p. Ala305Glu)
c.11T>G (p. Phe4Cys)
dbSNP rs77121243 rs16910526 rs121917843 rs121917842 rs137853100 rs193922688 rs121917840 rs121917839 rs104894553 rs104894552 rs28940279 rs28940574 rs116107386 African 0.0485 (505/
10404)
0.0243 (253/ 10404)
0 (0/10184) 0 (0/10184) 0 (0/10006) 0 (0/9980) 0 (0/8952) 0.000203 (0/ 9864)
0.000203 (0/ 10402)
0 (0/7694) 0.0000967 (1/10344)
0 (0/10350) 0.000301 (3/ 9962)
0.00350 (34/ 9718) Latino 0.00104 (12/
11548)
0.0341 (395/ 11578)
0 (0/11548) 0 (0/11548) 0.0000866 (1/ 11554)
0 (0/11548) 0 (0/9124) 0 (0/11548) 0 (0/11574) 0 (0/6726) 0 (0/11514) 0 (0/11512) 0.0000891 (1/11218) 0.00480 (55/ 11450) South Asian 0.000545 (9/ 16512) 0.00965 (1593/ 16510)
0 (0/16510) 0 (0/16510) 0 (0/16506) 0 (0/16504) 0 (0/14108) 0 (0/14586) 0 (0/16510) 0 (0/9492) 0 (0/16344) 0 (0/16342) 0 (0/15818) 0.00195 (30/ 15394) European (Non-Finnish) 0.0000899 (6/66734) 0.0000899 (6/ 66734) 0.0000152 (1/65894) 0.0000304 (2/65864) 0.0000304 (2/ 65844) 0.000259 (17/ 65770) 0.000266 (15/56442) 0.0000675 (4/ 59246) 0.000150 (10/66732) 0.000336 (14/41652) 0.000633 (42/66354) 0.0000151 (1/ 66340) 0.000358 (23/64266) 0.0118 (778/ 65728) East Asian
0 (0/8620) 0 (0/8620) 0 (0/8612) 0 (0/8610) 0.000116 (1/ 8612)
0 (0/8602) 0 (0/7392) 0 (0/7802) 0 (0/8642) 0 (0/5214) 0 (0/8620) 0 (0/8612) 0 (0/8424) 0.000117 (1/ 8580) European
(Finnish)
0 (0/6614) 0 (0/6614) 0 (0/6590) 0 (0/6592) 0 (0/6608) 0 (0/6608) 0 (0/4968) 0 (0/5272) 0.00197 (13/ 6614)
0 (0/4638) 0 (0/6606) 0 (0/6604) 0 (0/6502) 0.00319 (21/ 6574) Other 0 (0/908) 0 (0/908) 0 (0/886) 0 (0/886) 0 (0/900) 0 (0/898) 0 (0/740) 0 (0/776) 0 (0/908) 0.00159 (1/
628)
0 (0/900) 0 (0/898) 0 (0/876) 0.00801 (7/ 874)
6 7 8 9
Disease name
RCD MCPH1 SCKL5 PCH1B
OMIM entry #615780 #251200 #613823 #614678
Gene name
PLK1S1 MCPH1 CEP152 EXOSC3
Mutation c.64A>G (p. Thr22Ala)
c.95C>T (p. Thr32Ile)
c.97C>T (p. Arg33Trp)
c.248T>C (p. Ile83Thr)
c.226C>T (p. Arg76*)
c.74C>G (p. Ser25*)
c.215C>T (p. Ser72Leu)
c.305C>G (p. Ser101*)
c.2000A>G (p. Lys667Arg)
c.2034T>G (p.Tyr678*)
c.2T>C (p. Met1?)
92G>C (p. Gly31Ala)
c.238G>T (p.Val80Phe)
c.395A>C (p. Asp132Ala) dbSNP rs149183052 rs78536455 rs138292988 rs202157374 rs202210819 rs121434305 rs387906961 rs200879436 rs182018947 rs387907196 rs374550999 rs141138948 African 0.000204 (2/
9800) 0.000714 (7/ 9800) 0.00133 (13/ 9798) 0.000103 (1/ 9704)
0 (0/4932) 0 (0/10184) 0 (0/9802) 0 (0/9608) 0.0136 (132/ 9692)
0.00173 (17/ 9806)
0 (0/6472) 0 (0/8272) 0 (0/6932) 0.0000961 (1/10404) Latino 0.000867 (10/11534) 0.00390 (45/ 11536) 0.00625 (72/ 11526)
0 (0/11404) 0.00616 (12/ 1948)
0 (0/11548) 0.0000865 (1/11564) 0.0000869 (1/ 11504) 0.000174 (2/ 11466) 0.0000864 (1/11576)
0 (0/8778) 0 (0/10236) 0 (0/8806) 0.000259 (3/ 11576) South Asian 0.000606 (10/16498) 0.000545 (1/ 16486) 0.00455 (75/ 16482) 0.0124 (201/ 16214)
0 (0/9454) 0 (0/16510) 0 (0/16510) 0 (0/16438) 0.0000610 (1/16404)
0.000545 (9/ 16508)
0.000503 (6/ 11938)
0 (0/14680) 0.000499 (7/ 14042) 0.0000606 (1/16510) European (Non-Finnish) 0.00167 (111/66662) 0.00527 (351/ 66650) 0.0109 (724/ 66632)
0 (0/65634) 0.00134 (30/ 22330)
0.0000304 (2/ 65864)
0.0000150 (1/66736)
0 (0/66164) 0.0000151 (1/66196)
0.000150 (10/65864)
0 (0/483464) 0 (0/57660) 0.0000401 (2/49814)
0.000510 (34/66726)
East Asian
0 (0/8614) 0 (0/8610) 0 (0/8604) 0 (0/8582) 0 (0/3338) 0 (0/8610) 0 (0/8626) 0 (0/8586) 0 (0/8586) 0.000348 (3/ 8624)
0 (0/6844) 0 (0/7842) 0 (0/6616) 0 (0/8654)
European (Finnish)
0 (0/6610) 0.00166 (11/ 6612)
0.0101 (67/ 6608)
0 (0/6554) 0 (0/2814) 0 (0/6592) 0 (0/6612) 0 (0/6614) 0 (0/6600) 0 (0/6614) 0 (0/3528) 0 (0/4366) 0 (0/3730) 0 (0/6614)
Other 0.00111 (1/ 900)
0.00111 (1/900) 0.0122 (11/ 900)
0 (0/888) 0.00267 (1/374) 0 (0/896) 0 (0/900) 0 (0/888) 0.00112 (1/ 890)
0 (0/900) 0 (0/602) 0.00142 (1/704) 0 (0/616) 0 (0/908)
10 11 12 13
Disease name
Miller syndrome FDLAB CRPT1 GCCD4
(Continued)
Table 3. (Continued)
OMIM entry #263750 #601552 #201000 #614736
Gene name
DHODH ASPH RAB23 NNT
Mutation c.475-1269A>G
c.56G>C (p. Gly19Glu)
c.403C>T (p. Arg135Cys)
c.454G>A (p. Gly152Arg)
c.595C>T (p. Arg199Cys)
c.605G>C (p. Gly202Asp)
c.976C>T (p. Arg326*)
c.1036C>T (p. Arg346Trp)
1175A>G (p. Asp392Gly)
c.2203C>T (p. Arg735Trp)
c.83G>A (p. Arg28*)
c.434T>A (p. Leu145*)
c.1990G>A (p. Gly664Arg)
c.3027T>G (p. Asn1009Lys) dbSNP rs370087266 rs267606765 rs201230446 rs267606766 rs267606769 rs267606767 rs201947120 rs374385878 rs376394715 rs121908171 rs371979800 rs370273690 African 0 (0/10106) 0 (0/9800) 0 (0/9744) 0 (0/9800) 0 (0/6920) 0 (0/7102) 0 (0/9624) 0 (0/9780) 0 (0/9808) 0.0000970
(1/10310)
0.0000961 (1/10402)
0.000194 (2/ 10318)
0 (0/10396) 0 (0/11322)
Latino 0 (0/11494) 0.000518 (6/ 11576)
0.000261 (3/ 11516)
0 (0/11574) 0 (0/7566) 0 (0/8048) 0 (0/11576) 0.0000432 (5/ 11574)
0 (0/11570) 0 (0/11412) 0 (0/11570) 0.000177 (2/ 11328)
0 (0/11558) 0 (0/11558)
South Asian
0 (0/16178) 0 (0/16512) 0.0000606 (1/16494)
0 (0/16512) 0 (0/12628) 0.000232 (3/ 12926)
0 (0/16512) 0 (0/16512) 0 (0/16512) 0 (0/16216) 0 (0/16510) 0 (0/16122) 0 (0/16496) 0 (0/16280)
European (Non-Finnish)
0.0000303 (2/65970)
0 (0/66732) 0.000631 (42/66518) 0.000180 (12/66736) 0.0000621 (3/ 48338) 0.0000397 (2/ 50334) 0.0000301 (2/66458)
0 (0/66732) 0.0000450 (3/66722) 0.0000453 (3/66256) 0.0000300 (2/66724) 0.000447 (29/ 64878) 0.0000150 (1/66702) 0.0000152 (1/65808) East Asian
0 (0/8610) 0 (0/8626) 0 (0/8612) 0 (0/8626) 0 (0/6284) 0 (0/6608) 0 (0/8624) 0 (0/8626) 0 (0/8626) 0 (0/8500) 0 (0/8654) 0 (0/8532) 0.000116 (1/ 8654)
0 (0/8594)
European (Finnish)
0 (0/6602) 0 (0/6614) 0 (0/6590) 0 (0/6614) 0 (0/3280) 0 (0/3488) 0 (0/6614) 0 (0/6614) 0 (0/6610) 0 (0/6552) 0 (0/6614) 0.000152 (1/ 6560)
0 (0/6608) 0 (0/6568)
Other 0 (0/888) 0 (0/900) 0 (0/894) 0 (0/898) 0 (0/616) 0 (0/634) 0 (0/900) 0 (0/900) 0 (0/902) 0 (0/898) 0 (0/908) 0 (0/888) 0 (0/906) 0 (0/896)
14 15 16 17
Disease name AGS6 MEGDEL syndrome Childhood-onset dilated cardiomyopathy USH1J OMIM entry
#615010 #614739 no description #614869
Gene name
ADAR SERAC1 RAF1 CIB2
Mutation c.577C>A (p. Pro193Ala)
c.2615T>C (p. Ile872Thr)
c.202C>T (p. Arg68*)
c.442C>T (p. Arg148*)
c.579delA (p. Leu193Profs*9)
c.1171delGACT (p.
Gln390Profs*29)
c.1493G>C (p. Ser498Thr)
c.709G>A (p. Ala237Thr)
c.928A>G (p. Thr310Ala)
c.1923C>T (p. Thr641Met)
c.272T>C (p. Phe91Ser)
dbSNP rs145588689 rs398122897 rs529232938 rs387907236 rs201941476 rs397515411 African 0 (0/10396) 0 (0/10400) 0 (0/10364) 0 (0/10394) 0 (0/10370) 0.000134 (1/
7478)
0 (0/10360) 0 (0/10364) 0 (0/10394) 0 (0/10406) 0 (0/10404)
Latino 0 (0/11578) 0 (0/11564) 0 (0/11568) 0 (0/11578) 0 (0/11560) 0 (0/6722) 0 (0/11560) 0 (0/11346) 0.0000864 (1/11570)
0 (0/11578) 0 (0/11574)
South Asian
0 (0/16512) 0 (0/16510) 0.0000606 (1/16508)
0 (0/16510) 0 (0/16478) 0 (0/12818) 0 (0/16486) 0 (0/16334) 0 (0/16512) 0 (0/16512) 0.000364 (6/16508)
European (Non-Finnish) 0.0000150 (1/66740) 0.0000150 (1/ 66718) 0.0000150 (1/66666) 0.0000150 (1/66722) 0.0000300 (2/ 66674)
0 (0/43262) 0.0000901 (6/66608) 0.0000302 (2/ 66268) 0.0000150 (1/66624) 0.0000150 (1/66738) 0 (0/66726) East Asian
0 (0/8654) 0 (0/8644) 0 (0/8648) 0.000231 (2/ 8652)
0 (0/8648) 0 (0/5592) 0 (0/8638) 0 (0/8568) 0 (0/8654) 0 (0/8654) 0 (0/8654)
European (Finnish)
0 (0/6614) 0 (0/6600) 0 (0/6614) 0 (0/6614) 0 (0/6614) 0 (0/4148) 0 (0/6612) 0 (0/6544) 0 (0/6612) 0 (0/6614) 0 (0/6614)
Other 0 (0/908) 0 (0/906) 0 (0/906) 0 (0/908) 0 (0/908) 0 (0/638) 0 (0/908) 0 (0/898) 0 (0/908) 0 (0/908) 0 (0/906)
exome sequencing.Nrefers to the number of exomes available for epidemiological analysis.
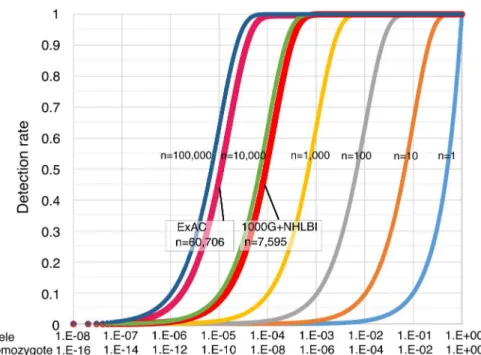
Fig 3shows the simulation curve for the mutation detection rate. This prediction equation is
applicable to general cases of predicting the incidence of inherited disorders. This predictive equation is responsive to parameters that affect carrier rate and data accuracy, and it is inde-pendent of the distribution offitness effects. The epidemiological study was performed using a total of 7,595 samples from NHLBI and 1000G datasets, and a target mutation with carrier rate of 0.001 in this group could be theoretically detected with a probability of 99.95% under the condition ofσ= 0.01. When the ExAC dataset was used under the same conditions, the
proba-bility of undetected rates was 7.70E-25%. Exome sequencing errors now are generally small (σ<0.01) and thus have a small effect on mutation detection rates (S1 Fig).
Discussion
During the past several decades, biomedical research has identified the causative genes for almost>3,000 Mendelian disorders [1–4]. NGS results have provided empirical evidence that the genetic architecture of Mendelian disease is one of many rare causal mutations, although NGS have not yet identified all genetic mutations [2–4]. Despite the accumulation of signifi-cant genetic data, the epidemiology of Mendelian disorders remains unknown. The initial study here demonstrated the structured concept that genetic risk prediction using exome sequences accurately revealed carrier frequencies for rare Mendelian mutations with a small margin of error (Fig 2andTable 2). The estimation algorithm was successfully applied to developing countries, and showed strong regional specificity of causative alleles (Fig 2). This study also set priorities aligning causative mutations with their carrier rates (Table 2). The accumulation of these data will make it possible to perform closely focused diagnostic genetic tests in specific countries and cities and to plan clinical services, assess priorities, and monitor
Fig 3. Risk simulation and mutation detection rate of autosomal recessive disease.The simulation graph depicts the theoretical mutation detection probability of high-penetrance genetic mutations (under the condition ofσ= 0.01) that are associated with inherited disorders. The simulation sample sizes range from 1 to 100,000. The y-axis corresponds to the detection rate of causative mutations.
doi:10.1371/journal.pone.0155552.g003
Population Exome-Based Epidemiology
prevalence trends. I have recently showed that exome-based epidemiology also could have the potential to provide a clue to understand the penetrance of each mutation [25].
A recent exome-based study [26], which focused on common diseases of interest, also suc-cessfully performed the risk prediction of target genetic disorders of newborn-screening, age-related macular degeneration (ARMD) and drug response across the two populations (Ameri-can Afri(Ameri-can and European). Their and my results suggested that NGS data could yield the use-ful information for applying genetic screening of genetic disorders in clinical practice.
Except Asian populations, the other populations have wider range of genetic variations, and the regional specificity is largest in African populations [14,15,27]. Therefore recent analysis [26] about a per-region breakdown of African allele frequency estimates possibly does not reflect the complex genetic structures in African populations. It is rational to analyze country-by-country and ethnicity-by-ethnicity epidemiology by using 1000G (Fig 2).
Data quality and limitations
The simulation studies here suggest that larger sample sizes or combination studies will allow for more accurate prediction of genetic risk (Fig 3). The ExAC data highlighted usefulness of large population size. Yet note that the present ExAC data also contains individuals sequenced as part of various disease-specific studies and does not reflect the complex genetic structures in African populations.
There were also some logistical issues that must be addressed when performing genetic epi-demiological studies. The first limiting factor is consanguineous marriage [28–30], which is irregular from the standpoint of population genetics. This practice largely influences the preva-lence rate for autosomal recessive disorders [28,29]. Most recent studies have used whole-exome sequencing of individuals from consanguineous families to identify rare coding varia-tions in the rare pathogenesis [2–4], and some rare heritable disorders may never occur with outbreeding. Rates of consanguinity (e.g., marriage between cousins) vary greatly between and within countries and regions, but the prevalence is highest in North Africa, the Middle East, and South Asia and among migrant communities in North America, Europe, and Australia [29,30]. At present, about 20% of the world’s population lives in communities with a prefer-ence for consanguineous marriages [29]. Public understanding regarding the genetic risk of consanguinity is still low in these countries [29,30]http://www.nature.com/ejhg/journal/v22/
n4/full/ejhg2013167a.html-bib8The current accepted belief is that the consanguinity
infre-quently cause genetic disease, so it is important to provide evidence-based recommendations for genetic counseling and screening for consanguineous couples and not to provoke unneces-sary alarm. The research here may promote the diffusion of overview on reproductive risks associated with consanguinity when the sample size are further extended. Intriguingly recent research also provides a fascinating view that the genomic inbreeding coefficient of each indi-vidual is an unexpected high to varying degrees even in 1000G data [31].
The second limiting factor is prenatal genetic counseling and testing. SCA, for which the U. S. Preventive Services Task Force (USPSTF) recommends screening [30], is a good example. Recent advances in prenatal genetic diagnosis make it easier than ever to gather more informa-tion on individuals prior to their birth [32,33]. It is, therefore, crucial to consider the potential effect of abortion on the prevalence rates.
The third limiting factor is the mode of inheritance. The initial dataset in this study was origi-nally derived from individuals with no cognitive impairment. Predicting risk has been successful for diseases that follow a simple mode of recessive inheritance, but risk prediction is challenging for autosomal dominant traits in this dataset. To analyze the autosomal dominant disorders, it is necessary to collect general population in specific area independent of their phenotypes.
Population Exome-Based Epidemiology
The fourth limiting factors are the experimental limitations and uncertainties in identifying causative disease mutations. There is often the case where the causative disease-causing muta-tions are determined too easily without analyzing potential effect of mutamuta-tions [34,35] and the population exomes may not have read coverage over all of the causative loci. Some causative mutations may have been previously unreported and would occurde novoin the future as the past has already shown [36–39]. In addition the degree of penetrance of the mutations remain largely unknown, and some reported disease mutations may be in fact not disease causing [40]. Therefore the carrier rates could be underestimated or overestimated. I suppose that discor-dance between carrier and prevalence rates of each mutation could provide a clue to under-stand the penetrance as well as screening priority.
Carrier rate in developing countries
One of the greatest merits of exome-based epidemiology is that we can easily conduct a part of public health surveillance of genetic disorders even in developing countries. According to the World Health Organization (WHO), congenital and inherited disorders increasingly contrib-ute to perinatal morbidity and mortality in developing countries [41]. Despite this fact, many countries in Africa, South Asia, and South America still lack national policies and recommen-dations regarding screening for developmental abnormalities [12]. Genetic epidemiological studies have the potential to provide scientific evidence of genetic risks in most countries and disseminate public health advice. Given the lack of sampling depth in these countries, it seems that the ethnic groups who need the information and counseling the most, have the least sam-pling. The geographical portfolio of exome-based prediction could be expanded to more disor-ders and more countries. Furthermore, on this basis, key infrastructure requirements must be placed in sociopolitical frameworks, and medical resources must be allocated for institutions in both developed and developing countries.
Methods
Analysis of genetic mutations using two representative population
exome projects
Genotyping pipelines from 1000G (Phase 1) (http://www.ncbi.nlm.nih.gov/variation/tools/
1000genomes/) and NHLBI (http://www.nhlbi.nih.gov/) projects were collected in VCF
for-mat. The dataset consisted of a total of 15,190 haploid exomes from high-coverage exome sequence data derived from 14 + 2 ethnic groups. NHLBI data contains individuals sequenced as part of various disease-specific studies and may not partially reflect the precise genetic popu-lation structures while 1000G collected healthy individuals. The validity of a part of the NHLBI dataset was previously assessed by NHLBI using Sanger sequencing [novel singleton variants, 143/145 (99%); novel nonsingleton variants 316/323 (98%)] [17]. The genotype accuracy of 1000G was estimated at 97.4% (20,687/21,235) by comparing with the HapMap genotype calls [15]. The 1000G and NHLBI datasets (VCF files) were filtered on Variant Tools (http://
varianttools.sourceforge.net/Annotation/HomePage) and Microsoft Excel by total read depth,
the number of individuals with coverage at the site, the fraction of mutation reads in each het-erozygote, and the average position of mutation alleles along a read. Eighteen recessively inher-ited diseases were probatively retrieved and selected from literature (published from 1957 to 2014) and derived from NCBI OMIM (http://www.ncbi.nlm.nih.gov/omim) and PubMed
(http://www.ncbi.nlm.nih.gov/pubmed). Causative mutations for inherited disorders were
derived from these datasets based on the corresponding chromosome position (UTR, coding, intron, and splice site). ClinVar and HGMD were supplementarily reviewed to collect the
Population Exome-Based Epidemiology
mutations. Identified mutations were then classified by mutation type, allele frequency, racial groups, and clinical impact. Information on mutation types, positions, reference sequences, and pathogenicity were retrieved from NCBI dbSNP (http://www.nlm.nih.gov/SNP/) and UCSC genome browser (http://genome.ucsc.edu/) to generate exome-based epidemiology. Sta-tistical analysis, including carrier rate (%), was performed with Excel. ExAC Browser (http://
exac.broadinstitute.org/) was additionally searched for the mutation alleles of 18 inherited
dis-orders. A global map of carrier rate distribution was manually constructed for 15 recessive disorders collated from literature sources. A world map was obtained from Free Editable Worldmap (http://free-editable-worldmap-for-powerpoint.en.softonic.com/) and modified.
Pair-wise proportion tests of data consistency between two different
exome resources
To project the performance of risk prediction based on analyses of exome sequence studies, I statistically compared exome-based estimates with the clinical prevalence survey. Evidence of data consistency was based on significant differences in pair-wise comparisons between popu-lations if two estimates differed significantly (two-sample test for equality of proportions with continuity correction). The standard hypothesis test wasH0:π1=π2against the alternative (two-sided)H1:π16¼π2The pair-wise prop test can be used to test the null hypothesis that the
proportions (probabilities of success) in two groups are the same. In a two-way contingency table whereH0:π1=π2, this should yield comparable results to those of the ordinaryχ2test.
Mutation detection simulation of inherited diseases
To perform mutation detection simulation based on population exome sequences, a determin-istic formulae (D¼ ½1 f1 pð1 sÞgN) was calculated to predict the mutation detection
rate of genetic risk using exome studies assuming a single-gene disease with an autosomal recessive inheritance pattern. The variableprefers to the mutation carrier rate in each popula-tion, andσindicates the error rate of exome sequencing.Nrefers to the number of exomes
available for epidemiological analysis. The simulation curve for the mutation detection rate is calculated and drawn using the R 3.13 statistical software (http://www.r-project.org/) together with the RColorBrewer package (http://cran.r-project.org/web/packages/RColorBrewer/index.
html).
Supporting Information
S1 Fig. Risk simulation and mutation detection rate of autosomal recessive disease.The theoretical mutation detection probability of high-penetrance genetic variants is calculated under the three condition (σ= 0; 0.01; 0.1) although the simulation underσ= 0.1 is unlikely sit-uation. The simulation sample sizes range from 1 to 100,000. The y-axis corresponds to the detection rate of causative mutations.
(PDF)
S1 Table. Population disposition (ethnicity and male/female ratio).
(PDF)
S2 Table. Lists of genetic disorders and their causative genes in this study.Target causative mutation lists analyzed in this study and representative reference lists.
(PDF)
S3 Table. Comparison of carrier rates between two different exomes (1000 Genomes and NHLBI).The P-value is calculated from pair-wise proportion tests of allele frequencies in
Population Exome-Based Epidemiology
European and African ancestries between the two different exome resources (1000 Genomes vs NHLBI).
(PDF)
Acknowledgments
The author would like to thank the 1000 Genomes Project, the NHLBI GO Exome Sequencing Project and Exome Aggregator database for the available datasets.
Author Contributions
Conceived and designed the experiments: KF. Performed the experiments: KF. Analyzed the data: KF. Wrote the paper: KF.
References
1. Bamshad MJ, Ng SB, Bigham AW, Tabor HK, Emond MJ, Nickerson DA, et al. Exome sequencing as a tool for Mendelian disease gene discovery. Nat Rev Genet. 2011; 12: 745–755. doi:10.1038/nrg3031
PMID:21946919
2. Ku CS, Naidoo N, Pawitan Y. Revisiting Mendelian disorders through exome sequencing. Hum Genet. 2011; 129: 351–370. doi:10.1007/s00439-011-0964-2PMID:21331778
3. Ku CS, Cooper DN, Polychronakos C, Naidoo N, Wu M, Soong R. Exome sequencing: dual role as a discovery and diagnostic tool. Ann Neurol. 2012; 71: 5–14. doi:10.1002/ana.22647PMID:22275248 4. Kiezun A, Garimella K, Do R, Stitziel NO, Neale BM, McLaren PJ, et al. Exome sequencing and the
genetic basis of complex traits. Nat Genet. 2012; 44: 623–630. doi:10.1038/ng.2303PMID:22641211 5. Docherty S, Iles R. Biomedical Sciences: Essential Laboratory Medicine. 2012. pp. 116–117.
6. Katsanis SH, Katsanis N. Molecular genetic testing and the future of clinical genomics. Nat Rev Genet. 2013; 14: 415–426. doi:10.1038/nrg3493PMID:23681062
7. de la Paz MP, Villaverde-Hueso A, Alonso V, János S, Zurriaga O, Pollán M, et al. Rare diseases epide-miology research. Adv Exp Med Biol. 2010; 686: 17–39. doi:10.1007/978-90-481-9485-8_2PMID:
20824437
8. Scriver CR, Beaudet AL, Sly WS, Valle D. The Metabolic and Molecular Bases of Inherited Disease. 1995.
9. Matise TC, Ambite JL, Buyske S, Carlson CS, Cole SA, Crawford DC, et al. The Next PAGE in under-standing complex traits: design for the analysis of Population Architecture Using Genetics and Epidemi-ology PAGE. Study. Am J Epidemiol. 2011; 174: 849–859. doi:10.1093/aje/kwr160PMID:21836165 10. Lazarin GA, Haque IS, Nazareth S, Iori K, Patterson AS, Jacobson JL, et al. An empirical estimate of
carrier frequencies for 400+ causal Mendelian variants: results from an ethnically diverse clinical sam-ple of 23,453 individuals. Genet Med. 2013; 15: 178–186. doi:10.1038/gim.2012.114PMID:22975760 11. Krickeberg K, Kar A, Chakraborty AK. Handbook of Epidemiology Epidemiology in Developing
Coun-tries. 2005. pp. 1545–1589.
12. Becker F, van El CG, Ibarreta D, Zika E, Hogarth S, Borry P, et al. Genetic testing and common disorders in a public health framework: how to assess relevance and possibilities. Background Document to the ESHG recommendations on genetic testing and common disorders. Eur J Hum Genet. 2011; 19: S6–44.
13. Bornstein MH, Hendricks C. Screening for developmental disabilities in developing countries. Soc Sci Med. 2013; 97: 307–315. doi:10.1016/j.socscimed.2012.09.049PMID:23294875
14. Altshuler D, Durbin RM, Abecasis GR, Bentley DR, Chakravarti A, Clark AG. et al. A map of human genome variation from population-scale sequencing. Nature. 2010; 467: 1061–1073. doi:10.1038/ nature09534PMID:20981092
15. 1000 Genomes Project Consortium. An integrated map of genetic variation from 1,092 human genomes. Nature. 2012; 491: 56–65. doi:10.1038/nature11632PMID:23128226
16. Tennessen JA, Bigham AW, O'Connor TD, Fu W, Kenny EE, Gravel S, et al. Evolution and Functional Impact of Rare Coding Variation from Deep Sequencing of Human Exomes. Science. 2012; 337: 64–
69. doi:10.1126/science.1219240PMID:22604720
17. Fu W, O'Connor TD, Jun G, Kang HM, Abecasis G, Leal SM, et al. Analysis of 6,515 exomes reveals the recent origin of most human protein-coding variants. Nature. 2013; 493: 216–220. doi:10.1038/ nature11690PMID:23201682
Population Exome-Based Epidemiology
18. Ingram VM. Gene mutations in human haemoglobin: the chemical difference between normal and sickle cell haemoglobin. Nature. 1957; 180: 326–328. PMID:13464827
19. Akinsheye I, Alsultan A, Solovieff N, Ngo D, Baldwin CT, Sebastiani P, et al. Fetal hemoglobin in sickle cell anemia. Blood. 2011; 118: 19–27. doi:10.1182/blood-2011-03-325258PMID:21490337 20. National Center for Disease Control Available:http://www.cdc.gov/ncbddd/sicklecell/data.html.
21. Morton DA. Medical Issues in Social Security Disability 1, section 7.0.5. 2013.
22. Modell B, Darlison M. Global epidemiology of haemoglobin disorders and derived service indicators. Bull World Health Organ. 2008; 86: 480–487. PMID:18568278
23. Piel FB, Patil AP, Howes RE, Nyangiri OA, Gething PW, Dewi M, et al. Global epidemiology of sickle haemoglobin in neonates: a contemporary geostatistical model-based map and population estimates. Lancet. 2013; 381: 142–151. doi:10.1016/S0140-6736(12)61229-XPMID:23103089
24. Lee W. Testing the genetic relation between two individuals using a panel of frequency-unknown single nucleotide polymorphisms. Ann Hum Genet. 2003; 67: 618–619. PMID:14641250
25. Fujikura K. Global epidemiology of Familial Mediterranean fever mutations using population exome sequences. Mol Genet Genomic Med. 2015; 3: 272–282. doi:10.1002/mgg3.140PMID:26247045 26. Tabor HK, Auer PL, Jamal SM, Chong JX, Yu JH, Gordon AS, et al. Pathogenic variants for Mendelian
and complex traits in exomes of 6,517 European and African Americans: implications for the return of inci-dental results. Am J Hum Genet. 2014; 95: 183–193. doi:10.1016/j.ajhg.2014.07.006PMID:25087612 27. Gurdasani D, Carstensen T, Tekola-Ayele F, Pagani L, Tachmazidou I, Hatzikotoulas K, et al. The
Afri-can Genome Variation Project shapes medical genetics in Africa. Nature. 2015; 51: 327–332.
28. Mdell B, Darr A. Science and society: genetic counselling and customary consanguineous marriage. Nat Rev Genet. 2002; 3: 225–229. PMID:11972160
29. Kisioglu AN, Ormeci AR, Uskun E, Ozturk M, Ongel K. Effects of a formal training programme on con-sanguineous marriages on high school students’knowledge and attitudes: an interventional study from Turkey. J Biosoc Sci. 2010; 42: 161–176. doi:10.1017/S0021932009990472PMID:19922700 30. Jordan L, Swerdlow P, Coates TD. Systematic review of transition from adolescent to adult care in
patients with sickle cell disease. J Pediatr Hematol Oncol. 2013; 35: 165–169. doi:10.1097/MPH. 0b013e3182847483PMID:23511487
31. Gazal S, Sahbatou M, Babron MC, Génin E, Leutenegger AL. High level of inbreeding in final phase of 1000 Genomes Project. Sci Rep. 2015; 5: 17453. doi:10.1038/srep17453PMID:26625947
32. Stern HJ. Preimplantation Genetic Diagnosis: Prenatal Testing for Embryos Finally Achieving Its Poten-tial. J Clin Med. 2014; 3: 280–309. doi:10.3390/jcm3010280PMID:26237262
33. Tabor HK, Murray JC, Gammill HS, Kitzman JO, Snyder MW, Ventura M, et al. Non-invasive fetal genome sequencing: opportunities and challenges. Am J Med Genet. A. 2012; 158A: 2382–2384. doi:
10.1002/ajmg.a.35545PMID:22887792
34. Siemiatkowska AM, Schuurs-Hoeijmakers JH, Bosch DG, Boonstra FN, Riemslag FC, Ruiter M, et al. Nonpenetrance of the most frequent autosomal recessive leber congenital amaurosis mutation in NMNAT1. JAMA Ophthalmol. 132, 1002–1004 (2014). doi:10.1001/jamaophthalmol.2014.983PMID:
24830548
35. van Rheenen W, Diekstra FP, van den Berg LH, Veldink JH. Are CHCHD10 mutations indeed associ-ated with familial amyotrophic lateral sclerosis? Brain. 2014; 137: e313. doi:10.1093/brain/awu299
PMID:25348631
36. Hunter JM, Ahearn ME, Balak CD, Liang WS, Kurdoglu A, Corneveaux JJ, et al. Novel pathogenic vari-ants and genes for myopathies identified by whole exome sequencing. Mol Genet Genomic Med. 2015; 3: 283–301. doi:10.1002/mgg3.142PMID:26247046
37. Steinberg KM, Yu B, Koboldt DC, Mardis ER, Pamphlett R. Exome sequencing of case-unaffected-parents trios reveals recessive and de novo genetic variants in sporadic ALS. Sci Rep. 2015; 5: 9124. doi:10.1038/srep09124PMID:25773295
38. Casey JP, Støve SI, McGorrian C, Galvin J, Blenski M, Dunne A, et al. NAA10 mutation causing a
novel intellectual disability syndrome with Long QT due to N-terminal acetyltransferase impairment. Sci Rep. 2015; 5: 16022. doi:10.1038/srep16022PMID:26522270
39. Joshi R, Shvartsman M, Morán E, Lois S, Aranda J, Barqué A, et al. Functional consequences of trans-ferrin receptor-2 mutations causing hereditary hemochromatosis type 3. Mol Genet Genomic Med. 2015; 3: 221–232. doi:10.1002/mgg3.136PMID:26029709
40. Lek M, Karczewski K, Minikel E, Samocha K, Banks E, et al. Analysis of protein-coding genetic variation in 60,706 humans. bioRxiv. 2015.
41. WHO. Screening the genes. Available:http://www.who.int/bulletin/volumes/90/8/12-030812/en/. Population Exome-Based Epidemiology