Glioma Association and Balancing Selection
of
ZFPM2
Shui-Ying Tsang1☯, Lingling Mei1☯, Weiqing Wan2, Jun Li3, Yi Li3, Cunyou Zhao1, Xiaofan Ding1, Frank W. Pun1, Xiaoxia Hu4, Jianmin Wang4, Junyi Zhang5, Rongcheng Luo5, Siu-Tim Cheung6, Gilberto K. K. Leung6, Wai-Sang Poon3, Ho-Keung Ng7, Liwei Zhang2*, Hong Xue1*
1Division of Life Science and Applied Genomics Centre, Hong Kong University of Science and Technology, Clear Water Bay, Hong Kong, China,2Department of Neurosurgery, Beijing Tiantan Hospital, Capital Medical University, Beijing, China,3Division of Neurosurgery, Department of Surgery, Prince of Wales Hospital, Chinese University of Hong Kong, Shatin, Hong Kong, China,4Department of Hematology, Institute of Hematology, PLA, Changhai Hospital, Second Military Medical University, Shanghai, China, 5Cancer Center, Nanfang Hospital, Southern Medical University, Guangzhou, China,6Division of Neurosurgery, Department of Surgery, Li Ka Shing Faculty of Medicine, The University of Hong Kong, Queen Mary Hospital, Hong Kong, China,7Department of Anatomical and Cellular Pathology, Prince of Wales Hospital, Chinese University of Hong Kong, Shatin, Hong Kong, China
☯These authors contributed equally to this work. *[email protected](HX);[email protected](LZ)
Abstract
ZFPM2, encoding a zinc finger protein and abundantly expressed in the brain, uterus and
smooth muscles, plays important roles in cardiac and gonadal development. Abnormal expression ofZFPM2in ovarian tumors and neuroblastoma has been reported but hitherto
its genetic association with cancer and effects on gliomas have not been studied. In the present study, the hexamer insertion-deletion polymorphism rs71305152, located within a large haplotype block spanning intron 1 to intron 3 ofZFPM2, was genotyped in Chinese
cohorts of glioma (n = 350), non-glioma cancer (n = 354) and healthy control (n = 463) by direct sequencing and length polymorphism in gel electrophoresis, andZFPM2expression
in glioma tissues (n = 69) of different grades was quantified by real-time RT-PCR. Moreover, potential natural selection pressure acting on the gene was investigated. Disease-associa-tion analysis showed that the overall genotype of rs71305152 was significantly associated with gliomas (P= 0.016), and the heterozygous genotype compared to the combined
homo-zygous genotypes was less frequent in gliomas than in controls (P= 0.005) or non-glioma
cancers (P= 0.020).ZFPM2mRNA expression was negatively correlated with the grades
of gliomas (P= 0.002), with higher expression levels in the low-grade gliomas. In the
astro-cytoma subtype, higherZFPM2expression was also correlated with the rs71305152
het-erozygous genotype (P= 0.028). In addition, summary statistics tests gave highly positive
values, demonstrating that the gene is under the influence of balancing selection. These findings suggest thatZFPM2is a glioma susceptibility gene, its genotype and expression
showing associations with incidence and severity, respectively. Moreover, the balancing selection acting onZFPM2may be related to the important roles it has to play in multiple
organ development or associated disease etiology.
a11111
OPEN ACCESS
Citation:Tsang S-Y, Mei L, Wan W, Li J, Li Y, Zhao C, et al. (2015) Glioma Association and Balancing Selection ofZFPM2. PLoS ONE 10(7): e0133003. doi:10.1371/journal.pone.0133003
Editor:Anita B. Hjelmeland, University of Alabama at Birmingham, UNITED STATES
Received:November 28, 2014
Accepted:June 22, 2015
Published:July 24, 2015
Copyright:© 2015 Tsang et al. This is an open access article distributed under the terms of the
Creative Commons Attribution License, which permits unrestricted use, distribution, and reproduction in any medium, provided the original author and source are credited.
Data Availability Statement:Phased haplotype data was downloaded from HapMap database (Hapmap Phase III, Release #3) using the search keyword "ZFPM2" for each of the 11 populations.
Introduction
The zinc finger protein multitype 2 (ZFPM2) gene, also known as friend of GATA-2 (FOG2), encodes a transcriptional cofactor of members of the GATA-binding family that regulates expression of key genes essential for the development of multiple organs [1]. By interacting with GATA factors, ZFPM2 modulates this regulatory activity, and is known to play important roles in cardiac, gonadal, and pulmonary development [1–4].
Previously,ZFPM2has been found to be involved in the pathogenesis of cancers, e.g. its abnormal gene expression in sex cord-derived ovarian tumors [5] and neuroblastoma [6]. Moreover, the effect ofZFPM2on cell differentiation [7] and apoptosis [8] are suggestive of a tumor suppressor role in cancers. However, there have been no genetic association studies and the significance ofZFPM2in gliomas is unclear. Gliomas, which attack the brain and spine, are the most common and malignant primary tumor in the central nervous system [9–11]. The molecular characteristics of glioma subtypes have been extensively investigated in relation to genetic heterogeneity or aberrant gene expression [12–15]. However, the number of explicit gli-oma susceptibility genes among the ~30,000 human genes [16] is limited based on previous genome-wide or selected gene association studies. So farTERT[17–20],RTEL1[17,19,21], PHLDB1[17,19],EGFR[22,23],ORMDL3[24],CLPTM1L[20],H2AFX[25],VEGFA[26] and GSTP1[18] have been reported as glioma associated genes inHanChinese and other popula-tions. The importance of zinc finger proteins in cancer etiology is well established, and since ZFPM2is abundantly expressed in premature and adult brain, cooperating with GATA factors to regulate neural gene expression and development [1], analysis ofZFPM2in gliomas of dif-ferent grades may shed light on its potential relationship with glioma risk.
In view of the important biological roles played byZFPM2, natural selection likely contrib-utes to its patterns of genetic variations. Balancing selection is proposed as a major mechanism for maintaining phenotypic and genetic variation in natural populations [27], and it has been invoked to explain genetic variation in several human genes, including genes in the immune response [28] as well as in cancer [29].
In the present study, the hexamer insertion-deletion polymorphism rs71305152 was genotyped in glioma and control cohorts, as well as cohorts of non-glioma cancer in order to estimate the con-tribution of rs71305152 to cancer risk, especially for gliomas, and the evolutionary pressure acting onZFPM2was investigated. The indel resides within a large haplotype block so can act as a tagging marker and, relative to single nucleotide markers, it can be more accurately detected. Disease-asso-ciation results showed that rs71305152 was associated with gliomas at the genotype level, suggest-ing thatZFPM2represents a glioma susceptibility gene. Moreover,ZFPM2could be a useful disease severity indicator, as its expression levels were negatively correlated with glioma grades, and summary statistics tests demonstrated that the gene is under the influence of balancing selection.
Methods
Ethics Statement
Written informed consent was obtained from each participant. Subject recruitment and sample collection were approved by the research ethics review boards of Prince of Wales Hospital and Queen Mary Hospital in Hong Kong, and Beijing Tiantan Hospital, Shanghai Changhai Hospi-tal and Guangzhou Nanfang HospiHospi-tal in China.
Study cohorts
The various cohorts in this study were enrolled from Beijing, Shanghai, Guangzhou and Hong Kong. The glioma cohort were unrelated ChineseHanpatients recruited from Prince of Wales Competing Interests:The authors have declared
Hospital and Queen Mary Hospital in Hong Kong, and Beijing Tiantan Hospital. Patients were diagnosed based on surgical pathological records, and classified into four subgroups according to WHO classification [11,30], namely low-grade astrocytomas (A II), high-grade astrocytomas (A III—IV); low-grade oligodendroglial tumors (grade II oligodendrogliomas and oligoastrocy-tomas, O + OA II); high-grade oligodendroglial tumors (anaplastic oligodendrogliomas and anaplastic oligoastrocytomas, AO + AOA III).ZFPM2expression was analyzed in 69 of the gli-oma patients (age, 43.6 ± 15.9 year old; 40 males and 29 females). The control cohort consisted of healthy volunteers recruited by Hong Kong Red Cross, and Beijing volunteers. Leukemia, lymphoma and lung cancer cohorts were unrelated ChineseHanindividuals recruited from Shanghai Changhai Hospital and Guangzhou Nanfang Hospital. The demographic characteri-zations of all the samples are described inS1 Table.
DNA and RNA Samples
Peripheral white blood cells, formalin-fixed paraffin-embedded (FFPE) glioma tissues, and fresh glioma tissues were collected for DNA and/or RNA extraction. Glioma U87 cells (pro-vided by Prince of Wales Hospital) were harvested for RNA extraction. DNA was extracted from 5 ml peripheral blood by the phenol-chloroform method. DNA was extracted from FFPE samples with xylene, PCR buffer and Proteinase K, and mRNA was isolated from ~100 mg samples of frozen glioma tissue or glioma U87 cells with TRIzol solution (Invitrogen).
PCR of fragment containing rs71305152
An insertion-deletion polymorphism locus (rs71305152, TTTTCT/–), previously amplified by the AluScan method [31] and verified by Sanger sequencing from the paired DNA of tumor tis-sue and peripheral white blood cell of an anaplastic oligodendroglioma patient, was employed as genotyping marker.
Nested PCR was used to amplify the gene fragment containing rs71305152. For this purpose two pairs of PCR primers were designed, and their specificities were checked with PerlPrimer software version 1.1.19. The fragment size of the first PCR was 1,114 bp, and was amplified using the forward primer‘5-TAAAGCAGCTGTCAGATCACATCC-3’and reverse primer
‘5-AAGTTATTGTGCAGGAACATGGC-3’. Each 15μl PCR reaction mixture contained 1.5μl
10x long PCR buffer (500 mM Tris-Cl, pH 9.0, 160 mM ammonium sulfate, 25 mM MgCl2, 1.5 mg/ml bovine serum albumin), 4 mM MgCl2, 20μM dNTP mix, 0.1μM forward primer and
reverse primer, 0.5 unitTaqpolymerase and 40–100 ng genome DNA. The PCR amplification was performed at 95°C 5 min, 35 cycles of 95°C 30 s, 69.3°C 30 s, and 72°C 1.5 min, and finally another 5 min at 72°C.
The second PCR reaction was performed with 0.1μM forward primer‘5-GTCGACTTT
GACGGTAATGTCCT-3’and reverse primer‘5-GAGGTAAGAGTATAATCCAGAAGAC-3’
con-tained in 15μl PCR mixture, which also included 1.5μl 10 x long PCR buffer, 4 mM MgCl2,
20μM dNTP mix, 0.5 unitTaqpolymerase and 3μl purified first PCR products. PCR
amplifi-cation was conducted at 95°C 5 min, 35 cycles of 95°C 30 s, 67°C 30 s, and 72°C 1.5 min, and finally another 5 min at 72°C. For each sample, 3μl PCR products were mixed with 2μl 6x
DNA loading dye and loaded on 0.7% ethidium bromide stained agarose gel in 1x Tris-acetate-EDTA (TAE) buffer. Following electrophoresis, the presence of products of 1,009 bp was con-firmed under UV.
Genotyping by gel electrophoresis of PCR products
5-ATTCTCATCCCGTAT -3’to amplify a 44-bp fragment inZFPM2. In each instance, 15μl PCR
reaction was conducted containing 0.1μM of each primer, 1.5μl 10x long PCR buffer, 4 mM
MgCl2, 20μM dNTP mix, 0.5 unitTaqpolymerase and 100 ng DNA. PCR amplification was
carried out at 95°C 5 min, 35 cycles of 95°C 30 s, 51°C 20 s, and 72°C 10 s, and finally another 3 min at 72°C. PCR products (10μl) of each sample were mixed with 2μl 6x DNA loading dye
and loaded on 5% ethidium bromide stained agarose gel in 1x TAE buffer. Following electro-phoresis, the presence of the 44-bp product was confirmed under UV.
Genotyping by direct sequencing of PCR products
The genotypes of rs71305152 for each sample were also identified by direct DNA sequencing. Each 15μl sequencing reaction contained 0.75μl BigDye Terminator v3.1 (Applied Biosystems),
3μl BigDye Terminator v3.1 5xSequencing Buffer (Applied Biosystems), 0.24μM sequencing
primer‘5-GCTGTTAAATGTGTATACTT-3’, and 3μl purified PCR products. Reaction was
per-formed at 96°C 1 min, followed by 25 cycles of 96°C 10 s, 50°C 5 s, 60°C 4 min. The sequencing was carried out using the 3130xlGenetic Analyzer, and the three different genotypes were deter-mined using the BioEdit biological sequence alignment editor software version 7.0.5.
Quantitation of
ZFPM2
expression
ZFPM2expression levels in glioma tissue were measured by real-time quantitative reverse tran-scription PCR (real-time qRT-PCR). Total RNA was firstly reverse transcribed to cDNA through reverse transcription-polymerase chain reaction (RT-PCR) with TaqMan Reverse Transcription Kit (Applied Biosystems). Each 20μl RT-PCR contained 2μl 10x RT buffer, 2μl
10x RT Random Primers, 80 mM 25x dNTP Mix, 1 unit MultiScribe Reverse Transcriptase (Applied Biosystems), 40 unit RNaseOUT Recombinant Ribonuclease Inhibitor (Invitrogen) and 1μg mRNA. RT-PCR was carried out at 25°C 10 min, 37°C 120 min, and finally 85°C 5
min. Real-time qRT-PCR was subsequently performed with two housekeeping genes hypoxan-thine phosphoribosyltransferase 1 (HTRP1) and TATA box binding protein (TBP), which are appropriate for glioma tissue gene expression analysis [32]. TheHTRP1andTBPprimers were as described [32]. TheZFPM2forward primer‘5-ATTCTTTGAAGACAAAGGCTCAG-3’within
exon 5 and reverse primer‘5-GGTACATCCCTTCTGTGAGAG-3’within exon 7 were designed
using the PerlPrimer software version 1.1.19. Each 10μl Real-Time qRT-PCR mixture
con-tained 0.1μM per primer, 4μl SYBRPremix Ex Taq(2x) (TAKARA), 0.2μl ROX Reference
Dye II (50x), and 0.04μg sample RNA cDNA product. The reaction was performed on the 7500
Fast Real-Time PCR System (Applied Biosystem) at 95°C 30 s, 40 cycles of 95°C 3 s, 60°C 30 s, and one cycle of 95°C 15 s, 60°C 1 min, 95°C 15 s. TheZFPM2expression levels were deter-mined from CTvalues, and batch-to-batch experimental variations correction was carried out utilizing mRNA of U87 cells as calibrator. The expression levels were further normalized against the geometric mean of the expression levels of the two housekeeping genes described above.
Statistical analysis
grades, survival status, or genotypes withZFPM2mRNA expression levels in the glioma tissues. Kaplan-Meier non-parametric test [33] and Cox regression in SPSS version 17.0 was used to generate survival curves to evaluate the importance of rs71305152 genotypes to survival time.
Summary statistics
Phased haplotype data for theZFPM2gene (genomic region 106400 kb—106886 kb) on chromo-some 8 was retrieved from Phase III of the HapMap Project and used as input for the program DnaSP [34] to yield the summary statistics Tajima’s D [35], Fu and Li’s Dand Fu and Li
’s F[36]
for each of the 11 populations surveyed in this phase of the HapMap Project. These statistics were further analyzed to determine whether they were significantly different from expected values under a standard neutral model by performing coalescent simulation assuming no recombination.
Results
Genotypic correlation of rs71305152 with gliomas
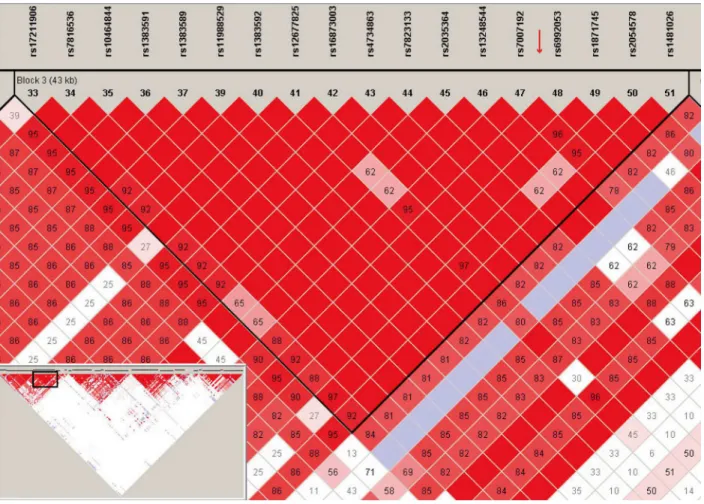
The polymorphism marker rs71305152 resides within a highly-linked haplotype block span-ning over 40 kb inZFPM2(Fig 1), and is located at 18,198 bp downstream of exon 2 and 6,779 bp upstream of exon 3, between a pair of Alu elements (Fig 2A). The three genotypes of rs71305152, namely the double insertion or II (TTTTCT/TTTTCT), heterozygous or ID (TTTTCT/–), and double deletion or DD (–/–) genotypes, can be readily detected through both direct sequencing (Fig 2B) and gel electrophoresis (Fig 2C).
All genotype frequencies within study cohorts did not deviate from Hardy-Weinberg equilib-rium with exception of the glioma cohort (P= 0.0015), according to the Hardy-Weinberg equi-librium test. In addition, there was no statistical difference in genotype frequencies between the control cohorts from two different geographical regions, Hong Kong and Beijing. The allele fre-quency difference was analyzed between different cancer-control cohorts, and neither insertion allele nor deletion allele was found to be associated with any type of cancer (Tables1and2). At the genotype level, the heterozygous genotype frequency was extensively decreased in the glioma cohort compared to the control cohort (P= 0.016) (Table 1). The inclusion of gender as covari-ate did not affect this association. However, although the genotype frequency difference between the glioma cohort and the combined non-glioma cancer cohort was not statistically significant (Table 1), no genotype association was found in the non-glioma cancer types (Table 2).
Correlation of
ZFPM2
expression with glioma grades
TheZFPM2mRNA expression levels of 69 glioma patients were examined using real-time qRT-PCR (Fig 4A), and the range and median levels ofZFPM2total mRNA for the different subtypes and grades of glioma are shown inTable 4. When ANOVA analysis was conducted in the combined-subtype cohort, significant difference was found betweenZFPM2expression lev-els in the different glioma grades (P= 0.012) (Fig 4B). Post-hoc tests revealed that theZFPM2 expression in grade II tumors were significantly higher than that in grade IV tumors
(P= 0.003). Moreover, there was no significant correlation found betweenZFPM2expression with either age or gender (P= 0.406 for age;P= 0.244 for gender). When ANOVA was employed to compare the different grades in the individual glioma subtype, significant differ-ence inZFPM2expression between grades was found for astrocytoma (P= 0.006), but not for oligodendroglial tumors where grade IV tumors are absent (Table 4).
To determine the possible association between genotypes andZFPM2expression levels, the 69 patients were separated into two subgroups for analysis, those with homozygous (both II and DD) genotypes and those with the ID genotype. Significant difference inZFPM2 expres-sion between the two genotype subgroups was observed for astrocytomas (n = 38,P= 0.028) as Fig 1. Linkage disequilibrium (LD) plot generated using Haploview.The plot depicts the haplotype block containing the rs71305152 indel for the HapMap CHB (Han Chinese in Beijing) population. The rs numbers of featured SNPs are given above the plot and the red arrow indicates the location of the rs71305152 indel. The LD plot for the wholeZFPM2gene is given in the inset and the box within the inset indicates the depicted, enlarged region. The
standard Haploview LD color scheme based on D’and LOD (log of the likelihood odds ratio) is used and the value of 100 x D’for each SNP pair is given in its respective tile unless D’= 1.
Fig 2. The hexamer insertion-deletion polymorphism rs71305152 inZFPM2.(A) Schematic diagram showing that rs71305152 is located within intron 2 ofZFPM2, between two neighboring head to tail oriented AluSx and AluSp elements. The distance of rs71305152 to each exon and Alu element is indicated. (B) and (C) show the three genotypes of homozygous insertion (II), heterozygous (ID) and homozygous deletion (DD) identified by direct DNA sequencing and gel electrophoresis, respectively. M denotes 5-bp DNA size marker.
determined using Student’s t-test, with lower expression in the homozygous group, but no dif-ference was found for oligodendroglial tumors (n = 31,P= 0.347) (Fig 4C).
Correlation of
ZFPM2
expression with survival
Upon follow up of 62 patients comprising 54 astrocytomas (including 50 GBMs), and 8 oligo-dendroglial tumors, 11 survived for a median of 91 (range 65–338) weeks, and 51 were deceased with a median survival of 40 (range 2–282) weeks. Based on the log rank test of Kaplan-Meier, there was no significant association between the genotypes and survival time of the 47 deceased GBM patients (P= 0.339) (Fig 5A).
The median survival time was 59 (range 2–98) weeks up to the study end point for 15 patients with expression data (median expression was 15.34; range 0.63–161.51). Cox regres-sion analysis using expresregres-sion level as covariate indicated that expresregres-sion exerted a moderate
‘protective’effect on survival (exp(B) = 0.949;P= 0.077) (Fig 5B).
Natural selection acting on
ZFPM2
To investigate whetherZFPM2is under evolutionary pressure, data for all single nucleotide polymorphisms (SNPs) within the gene were retrieved from the HapMap Project database and Table 1. Allele and overall genotype association of rs71305152 with glioma.
Cohort Subject Allele Genotype
n (M/F Ratiob
) I % (n) D % (n) ORc
95% CId
Pe II % (n) ID % (n) DD % (n) Pf
Glioma 350 (1.54) 33.57 (235) 66.43 (465) 15.14 (53) 36.86 (129) 48.00 (168)
Non-gliomaa
354 (1.51) 35.45 (251) 64.55 (457) 0.920 0.739–1.146 0.458 12.71 (45) 45.48 (161) 41.81 (148) 0.066 Control 463(1.02) 34.77 (322) 65.23 (604) 0.948 0.770–1.166 0.613 11.45 (53) 46.65 (216) 41.90 (194) 0.016
a
Non-glioma cohort includes lung cancer, leukemia and lymphoma cohorts;
b
M/F Ratio is the ratio of successfully genotyped male to female;
c
OR is the odds ratio;
d
95% CI is 95% confidence interval;
eP
values pertain to allele frequency difference between glioma cohort and either non-glioma cancer cohort or control cohort;
fP
values pertain to overall genotype frequency difference between glioma cohort and either non-glioma cancer cohort or control cohort;
Pvalue of less than 0.05 is highlighted.
doi:10.1371/journal.pone.0133003.t001
Table 2. Allele and overall genotype association of rs71305152 with individual non-glioma cancers.
Cohort Subject Allele Genotype
n (M/F Ratioa) I % (n) D % (n) ORb 95% CIc Pd II % (n) ID % (n) DD % (n) Pe
Lung Cancer 109 (2.11) 38.99 (85) 61.01 (133) 1.157 0.838–1.597 0.377 15.60 (17) 46.79 (51) 37.61 (41) 0.629 Leukemia 96 (1.18) 40.10 (77) 59.90 (115) 1.212 0.866–1.696 0.264 15.63 (15) 48.96 (47) 35.42 (34) 0.528 Lymphoma 149 (1.40) 29.87 (89) 70.13 (209) 0.771 0.570–1.043 0.089 8.73 (13) 42.28 (63) 48.99 (73) 0.228 Controlf
281 (0.99) 35.59 (200) 64.41 (362) 12.10 (34) 46.98 (132) 40.93 (115)
a
M/F Ratio is the ratio of successfully genotyped male to female;
b
OR is the odds ratio;
c
95% CI is 95% confidence interval;
dP
values pertain to allele frequency difference between cancer cohort and control cohort;
e
Pvalues pertain to overall genotype frequency difference between cancer cohort and control cohort;
f
Control cohort consisted of healthy individuals from Hong Kong.
used for summary statistics tests, including Tajima’s D, Fu and Li’s Dand Fu and Li
’s F, and
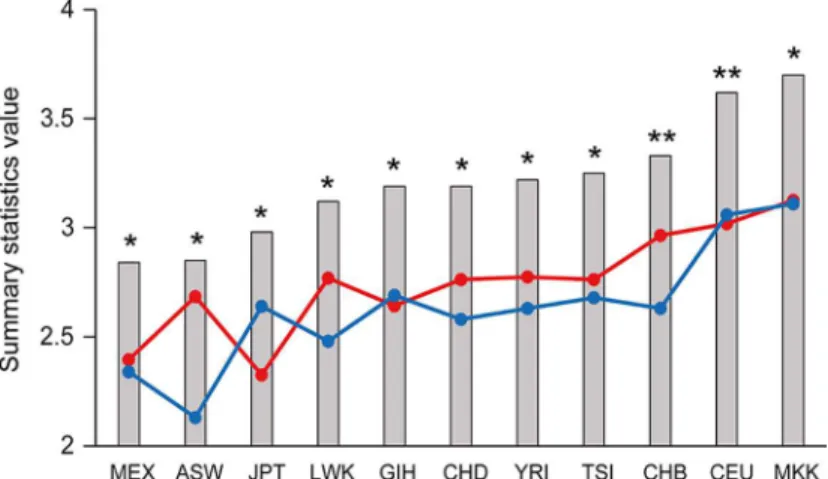
these statistics were analyzed to determine whether they were significantly different from expected values under a standard neutral model by performing coalescent simulation assuming no recombination. The 11 populations sampled in Phase III of the HapMap Project all gave sig-nificantly positive values for the three summary statistics tested (Fig 6;S2 Table). Notably, pop-ulations of African, European and Asian ancestry were randomly ordered relative to the values of the summary statistics, suggesting there was no apparent correlation between the values and the evolutionary age of the populations.
Discussion
Genotyping marker selection
Previous studies have shown that Alu elements in the human genome can be used for mapping complicated disease alleles [37,38]. Thus the selection of rs71305152, close to both AluSp and AluSx withinZFPM2, as a potential glioma susceptibility marker in the present study is consis-tent with the frequent location of poconsis-tential regions with disease-associated alleles in the neigh-borhood of Alu elements. In addition, its location within a large, highly-linked haplotype (Fig 1) makes it a suitable tagging marker representative of that region. Furthermore, the genotypes of the insertion-deletion polymorphism rs71305152 were found to be the same between the paired glioma-blood samples for thirty patients (data not shown), which indicated that rs71305152 is a potentially stable polymorphism locus without any loss of heterozygosity or somatic mutation. Although the two platforms of direct DNA sequencing and gel electrophore-sis were both employed for genotyping in the present study to ensure the accuracy of the deter-mined genotypes, notably the threeZFPM2genotypes were readily differentiated by simple gel electrophoresis alone. These properties render this potential glioma susceptibility marker suit-able for clinical diagnostic purposes.
Table 3. Pearson’s Chi-square tests on pairwise genotype frequency difference between pairs of cohorts for rs71305152.
Test Cohort 1 Cohort 2 ORa 95% CIb Pc
Subject Genotype n Subject Genotype n
1 Glioma II 53 Control II 53 1.155 0.749–1.779 0.515
DD 168 DD 194
2 Glioma II 53 Control II 53 1.675 1.080–2.597 0.021
ID 129 ID 216
3 Glioma DD 168 Control DD 194 1.450 1.074–1.958 0.015
ID 129 ID 216
4 Glioma II 53 Non-glioma Cancer II 45 1.038 0.659–1.635 0.874
DD 168 DD 148
5 Glioma II 53 Non-glioma Cancer II 45 1.470 0.928–2.328 0.100
ID 129 ID 161
6 Glioma DD 168 Non-glioma Cancer DD 148 1.416 1.029–1.949 0.033
ID 129 ID 161
a
OR is odds ratio;
b
95% CI is 95% confidence interval;
cP
values pertain to the frequency difference of any two genotypes between glioma cohort on the one hand, and control cohort or non-glioma cancer cohort on the other;
Pvalues of less than 0.05 are highlighted.
Association between rs71305152 and gliomas
Association analysis showed that rs71305152 was strongly associated with gliomas (P= 0.016). This association was not previously identified in GWAS studies, possibly because the effective sample size of the polymorphism is too small for detection in such genome-wide approaches, and/or the six-nucleotide deletion itself was not included in the probe set in the array platforms employed in the GWAS. Nevertheless, thePvalue of Hardy-Weinberg equilibrium test, which has been validated as furnishing evidence for association [39], was dramatically less than 0.05 in the glioma cohort (P= 0.0015), thereby supportingZFPM2as a glioma susceptibility gene. Compared to the control cohort, both the homozygous insertion genotype (P= 0.021) and the homozygous deletion genotype (P= 0.015) showed a moderate increase in gliomas (Table 3). Such frequency alterations of the two homozygous genotypes of a glioma-associated gene were observed for the first time in the present study, although similar changes in homozygous Fig 3. Association of rs71305152 genotypes with gliomas.In part (A), the heterozygous genotype was significantly decreased in the glioma cohort compared to either the control cohort (P= 0.005), or the
non-glioma cancer cohort (P= 0.020). In part (B), the heterozygous genotype was only significantly decreased in
the male glioma cohort (P= 0.020) but not in the female glioma cohort (P= 0.148) compared to control. Red bars represent the combined homozygous deletion (upper portion) and homozygous insertion (lower portion) genotypes, and green bars represent the heterozygous genotype. The sample size of each genotype group is shown within the bars.
Fig 4. Correlation ofZFPM2expression with glioma grades and rs71305152 genotypes.(A) Gel electrophoresis of real-time qRT-PCR products of
ZFPM2and the two housekeeping genesHPRT1andTBP. M denotes 100-bp DNA size marker. (B) Strong negative correlation between theZFPM2
expression and the three glioma grades (P= 0.006). (C) Correlation ofZFPM2expression with rs71305152 genotypes for astrocytomas (Upper panel; P= 0.028), and oligodendroglial tumors (Lower panel;P= 0.347), respectively. In parts B and C, the horizontal line in each box indicates the median; the upper and lower bounds of the box represent the 75th and 25th percentiles, respectively; the whiskers for each box mark either the values 1.5 times the interquartile range from the upper and lower edge of the box or the maximum and minimum values, whichever is the smaller; and the circles indicate outliers.
doi:10.1371/journal.pone.0133003.g004
Table 4. Correlation ofZFPM2expression level with glioma grades.
Subtype Gradea
n Expression
Range Median Pb
Astrocytomas II 8 3.29–146.50 62.97 0.006
III 5 4.81–102.60 42.17
IV 25 0.23–95.76 11.35
Oligodendroglial Tumorsc
II 17 1.41–176.30 24.18 0.263
III 14 6.92–83.95 21.39
a
Grade represents WHO classification of gliomas on the basis of histological features;
b
Pvalues pertain to correlation betweenZFPM2expression and glioma grades.Pvalue of less than 0.05 is highlighted;
c
Oligodendroglial tumors include the subtypes, oligodendrogliomas and oligoastrocytomas.
Fig 5. Correlation ofZFPM2genotype and expression with survival duration.(A) Survival duration profiles of different genotype groups for GBM. Black line, dashed line and grey dotted line represent homozygous insertion (II) genotype (n = 8, Male/Female = 1.66), heterozygous (ID) genotype (n = 12, Male/ Female = 0.71) and homozygous deletion (DD) genotype (n = 27, Male/Female = 3.50) of rs71350512, respectively. The median survival time of the above three genotypes was 43 (range 11–149) weeks, 33 (range 2–133) weeks, and 39 (range 2–282) weeks, respectively. ThePvalue based on the log rank test of Kaplan-Meier analysis was 0.339. (B) Correlation ofZFPM2expression with survival duration. The Cox regression plot for 15 glioma patients withZFPM2expression level as covariate (exp(B) = 0.949;P= 0.077).
genotypes also have been encountered in other non-cancer disorders [40,41]. Moreover, the decrease in heterozygous genotype frequency in gliomas compared to either controls (P= 0.005), or non-glioma cancers (P= 0.020), suggests a protective role being played by the heterozygous genotype in gliomas and this is a characteristic of loci that are under the influence of balancing selection [27].
Interestingly, inFig 3Bthe association between the heterozygous rs71305152 genotype and glioma was found to be significant only in male patients (P= 0.020), but not in female patients (P= 0.148). Epidemiological studies have shown a higher incidence of gliomas in males than females (male/female = 1.4–1.6) [42,43], and the possible involvement of an estrogen-protec-tive effect has been suggested [44]. The present results suggest that the susceptibility gene ZFPM2could also be a contributing factor to the higher incidence of gliomas observed for males. Further studies with increased sample size would be most valuable in this regard.
As many susceptibility SNPs have been associated with more than one type of cancer [45], the present study also examined the relationships between rs71305152 and lung cancer, leukemia and lymphoma. AlthoughZFPM2plays an essential role in lung development [2], and theZFPM2 -relatedFOGgene is strongly expressed in immature hematopoietic cell lineages [46],Table 2
shows that no association was found between rs71305152 and lung cancer (P= 0.629), leukemia (P= 0.528) or lymphoma (P= 0.228). However, the explicit disassociation between rs71305152 and these cancer types need to be further tested with large sample sizes in the future. In addition, the possible association between this marker and more types of cancer need to be examined, espe-cially for ovary tumor and neuroblastoma, where abnormalZFPM2expression has been reported, in order to determine the extent of specificity of the rs71305152-glioma association.
ZFPM2
expression as a marker for severity and prognosis
Based on ANOVA analysis, the expression levels ofZFPM2were significantly different between the glioma grades (P= 0.012,Fig 4), and the astrocytoma subtype grades (P= 0.006,Table 4), Fig 6. Summary statistics forZFPM2are plotted for the 11 HapMap populations.The Tajima’s D (red circles), Fu and Li’s D*(blue circles) and Fu and Li’s F*(grey columns) values were obtained using HapMap Phase III data. The populations are ordered according to increasing Fu and Li’s F*values. All values significantly deviated from neutrality (P0.01);*and**depicts Tajima’s D values for which coalescent simulation gaveP0.01 andP<0.001, respectively. The HapMap population descriptors are as follows: ASW: African ancestry in Southwest USA, CEU: Utah residents with Northern and Western European ancestry from the CEPH collection, CHB: Han Chinese in Beijing, China, CHD: Chinese in Metropolitan Denver, Colorado, GIH: Gujarati Indians in Houston, Texas, JPT: Japanese in Tokyo, Japan, LWK: Luhya in Webuye, Kenya, MEX: Mexican ancestry in Los Angeles, California, MKK: Maasai in Kinyawa, Kenya, TSI: Tuscan in Italy, YRI: Yoruban in Ibadan, Nigeria.
which included the most severe grade IV GBM patients. These results suggest that disease sever-ity could be prognostically correlated with reduced levels ofZFPM2. The finding of higher ZFPM2expression marginally increasing patient survival (exp(B) = 0.949;P= 0.077,Fig 5B) lends support to such a prognostic correlation. A comparable correlation between higher ZFPM2expression and spontaneous regression also has been reported for neuroblastoma [6].
Significant association was observed between patients’genotypes andZFPM2expression in astrocytomas (P= 0.028) as indicated inFig 4C. However, there was no significant association between genotypes and grades in astrocytomas (data not shown) or survival time of the GBM cases (P= 0.339,Fig 5A), which indicated that the genotypes themselves are not useful prog-nostic markers. Therefore, the genotypes appear to exert their impact on the incidence of glio-mas, possibly involvingZFPM2expression, but not the progression of glioma to severity. Nevertheless, all expression data was obtained from only a small sample set, and further studies with increased sample size are warranted.
Balancing selection
Most human genetic mutations are neutral or deleterious, but some are advantageous and per-sist in the population either to fixation or maintained at high frequencies. The latter variations contribute to advantageous population diversity and are evolutionarily maintained by balanc-ing selection [27]. A classic example is the sickle cell hemoglobin polymorphism where the homozygote individuals are either susceptible to malaria or sickle cell anemia while the hetero-zygotes are protected [47,48]. This heterozygote advantage is one of the underlying factors for balancing selection, and as such, balancing selection can be identified through the presence of a significant excess of heterozygotes or of higher fitness in heterozygotes. In the present study, the heterozygous genotype frequency for the indel rs71305152 inZFPM2was revealed inFig 3
to be significantly decreased in glioma patients compared to controls (P= 0.005), suggesting a potentially protective role played by the heterozygous genotype in gliomas. This is corrobo-rated by the fact that the heterozygous genotype was the major genotype in the control cohort (46.65%), in contrast to its being a minor genotype in the glioma cohort (36.86%) as shown in
Table 1, in accordance with the balancing selection theory where a heterozygote advantage can be observed in the population. The action of balancing selection on the gene was further exam-ined with summary statistics tests, and the observation of highly positive values forZFPM2for the three summary statistics Tajima’s D, Fu and Li’s D
and Fu and Li’s F
indeed indicated an excess of heterozygotes. Although this excess of intermediate-frequency alleles in a population can result from either balancing selection or population bottlenecks, given that these statistics were significantly positive across all the tested populations and not only to specific populations, it is unlikely for demographic effects to be a major factor. Both lines of evidence therefore pro-vide strong epro-vidence for balancing selection acting on theZFPM2gene. Balancing selection is an important evolutionary force and its targets include genes in key functional systems such as the immune system and the reproductive system [28,49,50]. The current finding of balancing selection acting onZFPM2may likewise be associated with its important roles in multiple organ development, including the reproductive organs.
Conclusion
of the polymorphism. In addition, the relative stability of the polymorphism against somatic mutation and ease of its genotyping using gel electrophoresis underlies the potential of rs71305152 as a clinically useful marker. Moreover,ZFPM2expression levels were negatively correlated with glioma grades, suggesting thatZFPM2expression can be a potentially useful indicator of disease severity for gliomas, as well as a significant factor in glioma pathogenesis, in which caseZFPM2could provide a valuable target for glioma therapeutics. Finally, that bal-ancing selection was found to act onZFPM2highlights its evolutionary importance and further investigation is merited to understand how its fundamental functions contribute to its myriad involvement in organ development and disease phenotypes.
Supporting Information
S1 Fig. Genotype frequency distributions in different glioma subtypes (P= 0.973).A II and A III—IV represent low grade (II), and high grades (III—IV) astrocytomas. O + OA II repre-sents grade II oligodendroglial tumors (oligodendrogliomas and anaplastic oligoastrocytomas). AO + AOA III represents grade III oligodendroglial tumors (anaplastic oligodendrogliomas and anaplastic oligoastrocytomas). Dark grey bars, light grey bars and white bars represent fre-quency of homozygous insertion (II), heterozygous (ID) and homozygous deletion (DD) geno-types, respectively. The sample size of each genotype is shown on each bar.
(PDF)
S1 Table. Demographic characterization of the enrolled cohorts.
(PDF)
S2 Table. Summary statistics values forZFPM2in the 11 HapMap populations.The values for the summary statistics Tajima’s D, Fu and Li’s Dand Fu and LI
’s Fare given for the 11
HapMap populations. NominalPvalues determined from 104coalescent simulations with no recombination are shown in the column next to each statistic.
(PDF)
Acknowledgments
The study was supported by grants to H. Xue from the University Grants Council of Hong Kong SAR (VPRDO09/10.SC08, VPRDO14SC01, DG14SC02, SRFI11SC06 and
SRFI11SC06PG) and a grant to L. Zhang from 863 Program, Ministry of Science and Technol-ogy, China (2012AA02A201). We are grateful to thank Professor J. Tze-Fei Wong for helpful discussion and critical review of the manuscript, and Ms. Peggy Lee for technical support.
Author Contributions
Conceived and designed the experiments: HX. Performed the experiments: LM FWP CZ. Ana-lyzed the data: SYT LM XD. Wrote the paper: SYT LM HX. Provided patient diagnosis and sample collection: WW JL YL XH JW JZ RL STC GKKL WSP HKN LZ.
References
1. Lu JR, McKinsey TA, Xu H, Wang DZ, Richardson JA, Olson EN. FOG-2, a heart- and brain-enriched cofactor for GATA transcription factors. Mol Cell Biol. 1999; 19: 4495–4502. PMID:10330188 2. Ackerman KG, Herron BJ, Vargas SO, Huang H, Tevosian SG, Kochilas L, et al. Fog2 is required for
normal diaphragm and lung development in mice and humans. PLoS Genet. 2005; 1: 58–65. PMID: 16103912
4. Garnatz AS, Gao Z, Broman M, Martens S, Earley JU, Svensson EC. FOG-2 mediated recruitment of the NuRD complex regulates cardiomyocyte proliferation during heart development. Dev Biol. 2014; 395: 50–61. doi:10.1016/j.ydbio.2014.08.030PMID:25196150
5. Laitinen MP, Anttonen M, Ketola I, Wilson DB, Ritvos O, Butzow R, et al. Transcription factors GATA-4 and GATA-6 and a GATA family cofactor, FOG-2, are expressed in human ovary and sex cord-derived ovarian tumors. J Clin Endocrinol Metab. 2000; 85: 3476–3483. PMID:10999851
6. Hoene V, Fischer M, Ivanova A, Wallach T, Berthold F, Dame C. GATA factors in human neuroblas-toma: distinctive expression patterns in clinical subtypes. Br J Cancer. 2009; 101: 1481–1489. doi:10. 1038/sj.bjc.6605276PMID:19707195
7. Manuylov NL, Smagulova FO, Tevosian SG. Fog2 excision in mice leads to premature mammary gland involution and reduced Esr1 gene expression. Oncogene. 2007; 26: 5204–5213. PMID:17310981 8. Hyun S, Lee JH, Jin H, Nam J, Namkoong B, Lee G, et al. Conserved MicroRNA miR-8/miR-200 and its
target USH/FOG2 control growth by regulating PI3K. Cell. 2009; 139: 1096–1108. doi:10.1016/j.cell. 2009.11.020PMID:20005803
9. Ohgaki H, Kleihues P. Epidemiology and etiology of gliomas. Acta Neuropathol. 2005; 109: 93–108. PMID:15685439
10. Schwartzbaum JA, Fisher JL, Aldape KD, Wrensch M. Epidemiology and molecular pathology of gli-oma. Nat Clin Pract Neurol. 2006; 2: 494–503. PMID:16932614
11. Wen PY, Kesari S. Malignant gliomas in adults. N Engl J Med. 2008; 359: 492–507. doi:10.1056/ NEJMra0708126PMID:18669428
12. Chen Z, Liu P, Li C, Luo Y, Chen I, Liang W, et al. Deregulated expression of the clock genes in glio-mas. Technol Cancer Res Treat. 2013; 12: 91–97. doi:10.7785/tcrt.2012.500250PMID:22905804 13. Liu W, Lv G, Li Y, Li L, Wang B. Downregulation of CDKN2A and suppression of cyclin D1 gene
expres-sions in malignant gliomas. J Exp Clin Cancer Res. 2011; 30: 76. doi:10.1186/1756-9966-30-76PMID: 21843312
14. Network CGAR. Comprehensive genomic characterization defines human glioblastoma genes and core pathways. Nature. 2008; 455: 1061–1068. doi:10.1038/nature07385PMID:18772890 15. Sipos L, Szegedi Z, Fedorcsak I, Afra D, Szende B. Apoptosis and p53 expression in human gliomas.
Pathol Oncol Res. 1998; 4: 267–270. PMID:9887356
16. Lander ES, Linton LM, Birren B, Nusbaum C, Zody MC, Baldwin J, et al. Initial sequencing and analysis of the human genome. Nature. 2001; 409: 860–921. PMID:11237011
17. Chen H, Chen Y, Zhao Y, Fan W, Zhou K, Liu Y, et al. Association of sequence variants on chromo-somes 20, 11, and 5 (20q13.33, 11q23.3, and 5p15.33) with glioma susceptibility in a Chinese popula-tion. Am J Epidemiol. 2011; 173: 915–922. doi:10.1093/aje/kwq457PMID:21350045
18. Li G, Jin TB, Wei XB, He SM, Liang HJ, Yang HX, et al. Selected polymorphisms of GSTP1 and TERT were associated with glioma risk in Han Chinese. Cancer Epidemiol. 2012; 36: 525–527. doi:10.1016/j. canep.2012.06.008PMID:22795327
19. Shete S, Hosking FJ, Robertson LB, Dobbins SE, Sanson M, Malmer B, et al. Genome-wide associa-tion study identifies five susceptibility loci for glioma. Nat Genet. 2009; 41: 899–904. doi:10.1038/ng. 407PMID:19578367
20. Zhao Y, Chen G, Song X, Chen H, Mao Y, Lu D. Fine-mapping of a region of chromosome 5p15.33 (TERT-CLPTM1L) suggests a novel locus in TERT and a CLPTM1L haplotype are associated with gli-oma susceptibility in a Chinese population. Int J Cancer. 2012; 131: 1569–1576. doi:10.1002/ijc.27417 PMID:22213090
21. Song X, Zhou K, Zhao Y, Huai C, Yu H, Chen Y, et al. Fine mapping analysis of a region of 20q13.33 identified five independent susceptibility loci for glioma in a Chinese Han population. Carcinogenesis. 2012; 33: 1065–1071. doi:10.1093/carcin/bgs117PMID:22387365
22. Andersson U, Schwartzbaum J, Wiklund F, Sjostrom S, Liu Y, Tsavachidis S, et al. A comprehensive study of the association between the EGFR and ERBB2 genes and glioma risk. Acta Oncol. 2010; 49: 767–775. doi:10.3109/0284186X.2010.480980PMID:20446891
23. Hou WG, Ai WB, Bai XG, Dong HL, Li Z, Zhang YQ, et al. Genetic variation in the EGFR gene and the risk of glioma in a Chinese Han population. PLoS One. 2012; 7: e37531. doi:10.1371/journal.pone. 0037531PMID:22662167
24. Dobbins SE, Hosking FJ, Shete S, Armstrong G, Swerdlow A, Liu Y, et al. Allergy and glioma risk: test of association by genotype. Int J Cancer. 2011; 128: 1736–1740. doi:10.1002/ijc.25483PMID: 20503266
26. Li R, Zhao Y, Fan W, Chen H, Chen Y, Liu Y, et al. Possible association between polymorphisms of human vascular endothelial growth factor A gene and susceptibility to glioma in a Chinese population. Int J Cancer. 2011; 128: 166–175. doi:10.1002/ijc.25306PMID:20209496
27. Key FM, Teixeira JC, de Filippo C, Andres AM. Advantageous diversity maintained by balancing selec-tion in humans. Curr Opin Genet Dev. 2014; 29C: 45–51.
28. Andres AM, Hubisz MJ, Indap A, Torgerson DG, Degenhardt JD, Boyko AR, et al. Targets of balancing selection in the human genome. Mol Biol Evol. 2009; 26: 2755–2764. doi:10.1093/molbev/msp190 PMID:19713326
29. Sun C, Huo D, Southard C, Nemesure B, Hennis A, Cristina Leske M, et al. A signature of balancing selection in the region upstream to the human UGT2B4 gene and implications for breast cancer risk. Hum Genet. 2011; 130: 767–775. doi:10.1007/s00439-011-1025-6PMID:21660508
30. Louis DN, Ohgaki H, Wiestler OD, Cavenee WK, Burger PC, Jouvet A, et al. The 2007 WHO classifica-tion of tumours of the central nervous system. Acta Neuropathol. 2007; 114: 97–109. PMID:17618441 31. Mei L, Ding X, Tsang SY, Pun FW, Ng SK, Yang J, et al. AluScan: a method for genome-wide scanning
of sequence and structure variations in the human genome. BMC Genomics. 2011; 12: 564. doi:10. 1186/1471-2164-12-564PMID:22087792
32. Valente V, Teixeira SA, Neder L, Okamoto OK, Oba-Shinjo SM, Marie SK, et al. Selection of suitable housekeeping genes for expression analysis in glioblastoma using quantitative RT-PCR. BMC Mol Biol. 2009; 10: 17. doi:10.1186/1471-2199-10-17PMID:19257903
33. Fazeny-Dorner B, Wenzel C, Veitl M, Piribauer M, Rossler K, Dieckmann K, et al. Survival and prognos-tic factors of patients with unresectable glioblastoma multiforme. Anprognos-ticancer Drugs. 2003; 14: 305–312. PMID:12679735
34. Librado P, Rozas J. DnaSP v5: a software for comprehensive analysis of DNA polymorphism data. Bio-informatics. 2009; 25: 1451–1452. doi:10.1093/bioinformatics/btp187PMID:19346325
35. Tajima F. Statistical method for testing the neutral mutation hypothesis by DNA polymorphism. Genet-ics. 1989; 123: 585–595. PMID:2513255
36. Fu YX, Li WH. Statistical tests of neutrality of mutations. Genetics. 1993; 133: 693–709. PMID:8454210 37. Ng SK, Lo WS, Pun FW, Zhao C, Yu Z, Chen J, et al. A recombination hotspot in a
schizophrenia-asso-ciated region of GABRB2. PLoS One. 2010; 5: e9547. doi:10.1371/journal.pone.0009547PMID: 20221451
38. Ng SK, Xue H. Alu-associated enhancement of single nucleotide polymorphisms in the human genome. Gene. 2006; 368: 110–116. PMID:16380220
39. Wang J, Shete S. A test for genetic association that incorporates information about deviation from Hardy-Weinberg proportions in cases. Am J Hum Genet. 2008; 83: 53–63. doi:10.1016/j.ajhg.2008.06. 010PMID:18589394
40. Koika V, Georgopoulos NA, Piouka A, Roupas ND, Karela A, Armeni AK, et al. Increased frequency of the DI genotype of the angiotensin-I converting enzyme and association of the II genotype with insulin resistance in polycystic ovary syndrome. Eur J Endocrinol. 2012; 166: 695–702. doi: 10.1530/EJE-11-0894PMID:22223701
41. Schulz S, Hierse L, Altermann W, Klapproth J, Zimmermann U, Reichert Y, et al. The del/del genotype of the nuclear factor-kappaB -94ATTG polymorphism and its relation to aggressive periodontitis. J Peri-odontal Res. 2010; 45: 396–403. doi:10.1111/j.1600-0765.2009.01251.xPMID:20337891
42. Chakrabarti I, Cockburn M, Cozen W, Wang YP, Preston-Martin S. A population-based description of glioblastoma multiforme in Los Angeles County, 1974–1999. Cancer. 2005; 104: 2798–2806. PMID: 16288487
43. Dubrow R, Darefsky AS. Demographic variation in incidence of adult glioma by subtype, United States, 1992–2007. BMC Cancer. 2011; 11: 325. doi:10.1186/1471-2407-11-325PMID:21801393
44. Kabat GC, Etgen AM, Rohan TE. Do steroid hormones play a role in the etiology of glioma? Cancer Epi-demiol Biomarkers Prev. 2010; 19: 2421–2427. doi:10.1158/1055-9965.EPI-10-0658PMID:20841389 45. Sun T, Gao Y, Tan W, Ma S, Shi Y, Yao J, et al. A six-nucleotide insertion-deletion polymorphism in the
CASP8 promoter is associated with susceptibility to multiple cancers. Nat Genet. 2007; 39: 605–613. PMID:17450141
46. Tsang AP, Fujiwara Y, Hom DB, Orkin SH. Failure of megakaryopoiesis and arrested erythropoiesis in mice lacking the GATA-1 transcriptional cofactor FOG. Genes Dev. 1998; 12: 1176–1188. PMID: 9553047
47. Hedrick PW. Genetics of populations. Massachusetts: Jones and Bartlett Publishers; 2005.
49. Ferrer-Admetlla A, Bosch E, Sikora M, Marques-Bonet T, Ramirez-Soriano A, Muntasell A, et al. Bal-ancing selection is the main force shaping the evolution of innate immunity genes. J Immunol. 2008; 181: 1315–1322. PMID:18606686