Summary
Production of biomass for energy, food or biomaterials requires certain agricultural practices. Th e increasing nitrogen loading due to inorganic fertilizers used in conventional agriculture is one of the major global environmental challenges. Th is research was conducted in central part of Croatia near Park of nature Lonjsko polje, on experimental fi eld which was established 17 years ago in order to determine infl uence of mineral nitrogen fertilization on nitrate leaching. Th e soil type of trial site is drained distric Stagnosols and four diff erent nitrogen fertilization levels are taken into consideration: 1. N0+P+K, 2. N100+P+K, 3. N200+P+K, 4. N300+P+K (kg N ha-1). Water samples were taken in periods with lysimeters discharge. Soil
sampling (0-0.25 m) was carried out four times in the investigated period from June 2007 to June 2008 during the vegetation of maize and winter wheat. Research results indicate that the soil NO3-N content signifi cantly varied (27.3 kg ha–1 to 338.2
kg ha –1) depending on the treatment and sampling time. Compare to the winter
sampling time (November 2007 and February 2008) signifi cantly higher content of soil NO3-N was determined in the summer sampling (June 2007 and June 2008).
Regarding to the water samples, results revealed that the total nitrate-nitrogen losses were in the range from 5.97 kg NO3-N ha-1 to 112.3 kg NO
3-N ha-1. Lysimeter
discharge varied in dependence on precipitation and crop type. Total amounts of precipitation during the investigation were 652.5 mm and 34.6 % of them were recorded in lysimeters. Average NO3-N concentration in lysimeter water varied from 2.4 mg L-1 (0 kg N ha-1) up to 54.5 mg L-1 (300 kg N ha-1).
Key words
soil; water; nitrogen fertilization; nitrate leaching; maize; winter wheat
Nitrate-Nitrogen Content in Soil and
Lysimeter Water under Diff erent
Nitrogen Fertilization Levels in Crop
Production
Aleksandra JURIŠIĆ
1 ( )Željka ZGORELEC
1Ivana ŠESTAK
1Milan MESIĆ
1Višnja MIKOČ
21 Faculty of Agriculture University of Zagreb, Department of General Agronomy,
Svetošimunska cesta 25, 10000 Zagreb, Croatia e-mail: [email protected]
2 Petrokemija d.d., Aleja Vukovar 4, 44320 Kutina, Croatia
Introduction
Biomass is defi ned as mass of live or dead organic matter. Above-ground biomass implies all living biomass above the soil including stem, stump, branches, bark, seeds and foliage (FAO, 2009). In the case of conventional agriculture high levels of bi-omass production need to be balanced against the potentially damaging impacts of some crop management techniques. Key criteria to assess the environmental sustainability of agricultur-al systems are the performance regarding soil quagricultur-ality (organic matter content, water retention capacity), water use (overuse of water bodies, water quality), biodiversity, nitrate leaching, pes-ticide and herbicide load (Muller, 2006). In terms of biomass production for food it is evident that the increasing human pop-ulation (due to its need for food) increased cereal grain produc-tion from 877 Tg in 1962 to 2494 Tg in 2009 (FAOSTAT, 2011). Brown (1999) emphasizes that in 35-y period (1965-1999) 40% of the large annual increase in crop production is attributed to the increase in use of nitrogen (N) fertilizers. According to FAOSTAT database in 40-y period N fertilizer consumption in-creased for 140.4 Tg.
Excessive uses of N fertilizers leads to environmental pollu-tion. Regarding the air pollution, the nitrous oxides (N2Os) aff ect global climate change and its contribution from nitrogen and carbon management systems are of great signifi cance. Mesić et al. (2006) calculated that agricultural soil management activi-ties such as fertilizer application and other cropping practices were the largest source of Croatian N2O emissions, accounting
for 70 percent of the total emission. Romanovskaya et al. (2001) reported that 30% of N2O emissions in Russia are related to the
consumption of N fertilizers. Khalil et al. (2001) concluded that N2O fl uxes varied with the forms and amount of applied N
ferti-lizer. In terms of water contamination, the “Nitrates Directive” (Council Directive 91/676/EC) is intended to reduce water con-tamination caused by nitrates from agricultural sources. Based on that directive throughout Europe new environmental lows are being implemented to limit N fertilization on arable land. According to some authors from Croatia average nitrate-nitrogen (NO3-N) concentrations in drainage and lysimeters waters were in the range from to 1.9 mg L-1 up to 319.0 mg L-1 due to diff erent
nitrogen fertilization levels, amount of precipitation and time of fertilizer application [15.0-25.8 mg L-1 (Mesic et al. 2012);
17.5-319.0 mg L-1 (Zovko et al. 2008); 1.9-231.3 mg L-1 (Bensa et al.
2008); 16.7-25.9 mg L-1 (Čoga et al. 2003)]. Th us, more and more
attention has been given to the study on accumulation of soil nitrate-nitrogen in farmland ecosystems (Bai et al. 2011;Lu et al. 2008; Zgorelec et al. 2007; Yin et al. 2007; Oikeh et al. 2003). One way to avoid N surplus is to apply precise management strategies. Spatial analysis of NO3-N content and site-specifi c
crop management based upon spatial variation of NO3-N content can maximize crop production and minimized environmental impacts of N fertilization (Abu and Malgwi, 2011). Jurisic et al. (2013) determined that the long term N fertilization eff ected on the variability of NO3-N content within a square meter (CVs were from 31.3% to 58.9%). Th ey reported that contour N maps may provide useful information for variable-rate nitrogen manage-ment, better understanding nitrogen uptake by plant and plant nutrition in general. Also, their results indicate that grid sample
is more accurate and representative than random sampling for accurate nitrogen fertilizer recommendations.
Objectives of this study are to: (1) determine load of NO3-N
content in soil and NO3-N concentrations in lysimeters water regarding the diff erent nitrogen fertilization levels; (2) quanti-fy the eff ect of nitrogen application rates on NO3-N losses via lysimeter outfl ow.
Material and methods
Research was conducted on experimental fi eld within hydro-ameliorated cropland located in Western Pannonian subregion of Croatia (45°33´N, 16°31´E) near Park of nature Lonjsko polje. Th e soil type of trial site is drained distric Stagnosol. Terrain is fl at with average altitude 97.2 m. Th e experiment had 10 treatments with diff erent nitrogen fertilization levels, whence quantities of phosphorus (P) and potassium (K) were constant for all treat-ments (120 kg P ha-1 and 180 kg K ha-1). Only four treatments
were taken into consideration in this investigation: 1. N0+P+K, 2. N100+P+K, 3. N200+P+K, 4. N300+P+K (kg N ha-1). Parcel
di-mension is conditioned by distance between drain pipes. Each treatment area includes two drain pipes. Dimension of each trial treatment is 30 x 130 m including blank space, and 26 x 26 m for replication parcel. Fertilization and seeding practice is im-plemented on total area of each treatment.
During the vegetation of maize and winter wheat soil sam-pling was carried out four times:
15 June 2007 – maize vegetation (V3 growth stage); 06 November 2007 – out of vegetation; 22 February 2008 – winter wheat vegetation (24 according the Zodaks scale – tillering); 26 June 2008 – winter wheat vegetation (90 according the Zodaks scale – ripening). Samples were taken in four (4) replication from surface soil layer (0-0.25 m). On each treatment one zero-tension pan lysimeter is installed at the depth of 80 cm. Water samples were taken on a daily basis in periods with lysimeters discharge (eight times in investigated period: 07 October 2007, 31 October 2007, 22 November 2007; 02 December 2007; 08 December 2007, 10 January 2008, 23 March 2008 and 08 June 2008).
NO3-N content in wet soil samples was extracted in ultra pure water in 1:10 (w/v) ratio according to ÖNORM L 1092 norm. Aft er the extraction, samples were centrifuged, fi ltrated (disposable syringe fi lter; Chromafi l Xtra PET; pore size 0.45 μm; fi lter size 25mm; N free) and NO3-N content is detected by suppressed conductivity on Doinex ICS-1000 system with an analytical column [Ion Pac AS 17 (4x250 mm), Dionex]. Results were calculated upon soil dry matter and expressed in kg NO3-N ha-1 as product of nitrate concentration, soil layer density (1.54
tm-3) and layer height (0-0.25 m). NO
3-N content in lysimeters
water was determined by ion chromatography method (HRN EN ISO 10304-1:1998).
Results and discussion
Th e investigation area has a temperate continental climate, with 10.7°C annual mean temperature. Th e annual average rain-fall for 25-y period is 865 mm (Table 1). Compared to average period (1965-1990) investigation period was drier (about 161 mm less of precipitation) and warmer (for 2.0 °C).
Regarding the water samples, from June 2007 to June 2008 eight (8) discharge events were recorded. In table 2 listed precipi-tations for each sampling date are sum of daily amounts which were recorded between two discharged periods. Between 31 May and 07 October (fi rst discharge in this investigation) total daily amounts were 272.8 mm (Table 2). Th e lowest
precipita-0 20 40 60 80 100 120 140 160
Jun Jul Aug Sep Oct Nov Dec Jan Feb Mar Apr May Jun
2007 2008 Pr e c ip it a ti o n , m m
2007-2008 Average 1965-1990
-5 0 5 10 15 20 25 30
Jun Jul Aug Sep Oct Nov Dec Jan Feb Mar Apr May Jun
2007 2008 Te m pe ra tu re , o C
2007-2008 Average 1965-1990
ab a a a a b b b b b b c c b b a 0 50 100 150 200 250 300 350
N 0 N 100 N 200 N 300
LSD=14.64 LSD=39.14 LSD=20.73 LSD=72.26
kg NO
3
- -N ha
1 Jun 2007 Nov 2007 Feb 2008 Jun 2008
c b
c
c bc b c
b b b b b a a a a 0 50 100 150 200 250 300 350
Jun 2007 Nov 2007 Feb 2008 Jun 2008
LSD=69.14 LSD=40.64 LSD=9.11 LSD=36.41
kg NO
3
- -N ha
1 N 0 N 100 N 200 N 300
Table 1. Total precipitations and mean temperatures in sampling years
Average 1965-1990 2007 2008
Sum, mm 865 749 659
T, ºC 10.7 12.8 12.6
Monthly precipitation and air temperature values, along with 25-y average values for investigation period from June 2007 to June 2008 are shown more detailed in Figures 1 and 2.
Precipitations were in the range from 1.8 mm in February 2008 to 140.8 mm in September 2007. Th e coldest month during the investigation was December 2007 (0.4 °C) and the warmest was July 2007 (23.4 °C).
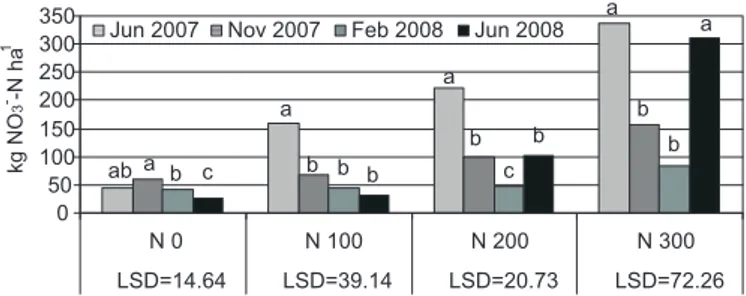
Figure 3 overviews a comparison of mean values of NO3- N
content in soil samples between nitrogen treatments for sam-pling dates. Bars signed by diff erent letters in same samsam-pling date were signifi cant at P<0.05 according Fisher’s LSD test. Fertilization levels signifi cantly increased NO3-N content. Th e
highest signifi cant diff erences were obtained between treatment without nitrogen fertilization and treatment with 300 kg N ha-1.
NO3-N content varied between 27.3 kg ha-1 and 338.2 kg ha-1
depending on the treatment and sampling time. Similar fi nd-ings were reported in studies around the world: America (Nance and Karlen, 2007), Europe (Kristensen and Th orup Kristensen, 2007; Németh and Kádár, 1999), Asia (Guo et al. 2001) and Africa (Ikerra et al. 1999).
Net nitrogen mineralization is governed by rainfall, soil moisture, and temperature (Maithani et al. 1998). In order to determine infl uence of sampling season obtained data were com-pared across the sampling dates for each treatment (Figure 4). Bars marked by same latter are not signifi cantly diff erent accord-ing Fisher’s LSD test. It is evident that on all three fertilization treatments (100, 200, 300 kg N ha-1) the highest signifi cant
dif-ferences were recorded in June 2007 when mean monthly tem-perature was 22.5 °C. Th ese fi ndings can partly by explain by the fact that temperature has a marked eff ect on ammonifi cation and nitrifi cation. According to Beck (1983) nitrifi cation attains its optimum at 26 °C. Also, excessive soil moisture inhibits the nitrifi cation process (Sabay, 1969). In June 2007 total monthly precipitations were 28.2 mm (Figure 1) which also attributed to the signifi cantly highest nitrate-nitrogen content in June 2007. On treatment with 300 kg N ha-1 signifi cantly lower content of
nitrate-nitrogen was observed in November 2007 and February 2008 compared to the nitrate-nitrogen content in summer 2007 and 2008. Fang et al. (2006) explained that nitrogen leaching and its accumulation in deeper soil layers during the rainfall season resulted with signifi cantly lower NO3-N content in top soil layer (0-0.20 m).
Figure 1. Monthly precipitation (mm), Meteorological Station Sisak
Figure 2. Monthly mean air temperatures, Meteorological Station Sisak
Figure 3. Mean nitrate-nitrogen content in soil samples per treatments for sampling dates
tions (2.9) were registered in period from 08 December and 10 January. Diff erences are noticeable in the quantity of lysimeters discharge between treatments (95.0 L in treatment with 300 kg N ha-1 to 140 L in treatment with 100 kg N ha-1) probably
be-cause the experimental trail was hydro ameliorated. Šimunić et al. (2011) reported that nitrate leaching is more pronounced in hydroameliorated fi elds, especially in drained soils because the soil infi ltration and fi ltration capabilities are changed. It is possible that among the investigation area (4 ha) infi ltration is diff erent which infl uenced on quantity of lysimeters discharge between treatments. Th ese fi ndings were not aff ected by plant density. According to Mesić et al. (2009) signifi cant diff erences (P<0.05) were not observed between winter wheat density on treatment with 100 kg N ha-1 (409 plants m-2) and treatment
with 300 kg N ha-1 (405 plants m-2).
To protect human health, world and national health organ-izations have established drinking water standards, limiting NO3-N concentration to a maximum of 10 mg NO3-N L-1 or 50
mg NO3- L-1 (WHO, 1998), the same as current EC regulations
specify (EU Nitrate Directive 91/676/ EEC). Nitrate-nitrogen concentrations in lysimeters water under fertilization exceed-ed the concentrations of 10 mg NO3-N L-1 (Figure 5). Average
NO3-N values from 07 October to 08 June in nitrogen treatments
varied from 19.8 mg L-1 to 54.4 mg L-1. Th e lowest
concentra-tion (7.12 mg L-1) was determinate in treatment with 100 kg N
ha-1 (08 June 2008) and the highest (73.0 mg L-1) in treatment
with 300 kg N ha-1 (31 October 2007). NO
3-N concentrations in
control treatment (0 kg N ha-1) were not above maximum
con-taminant levels (10 mg NO3-N L-1; WHO, 1998) and they were
in range from 1.20 mg L-1 to 5.43 mg L-1. Th ese results are in
accord with Arnsson and Bergström (2001). Th ey reported that the rapid increase in NO3-N concentrations in lysimeters water was strongly infl uenced by N applications and soil type (diff er-ences were detected between clay and sandy soils). Šimunić et al. (2011) also recorded exceeded NO3-N concentrations (> 10
mg NO3-N L-1) in drainage water (10 mg NO
3-N L-1 to 35 mg
NO3-N L-1) due to diff erent drainpipe spacing, climate
condi-tion and sampling time.
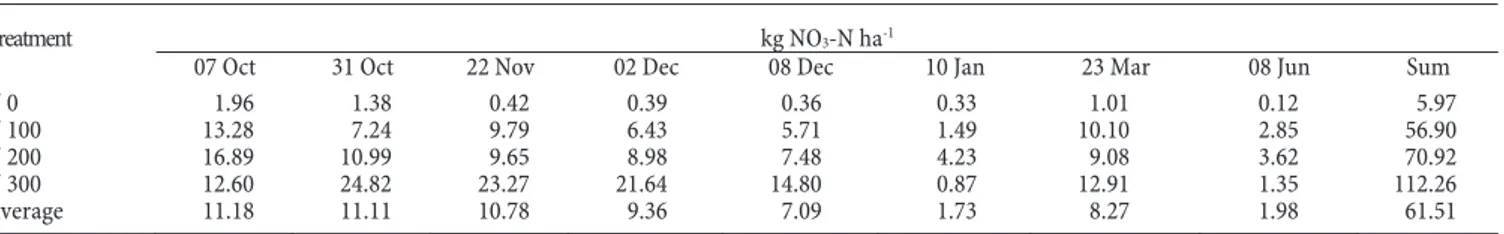
NO3-N losses through leaching during the investigation
period are shown in Table 3. NO3-N losses through leaching increased with increasing N inputs and sum of loses varied from 5.97 kg ha-1 (0 kg N ha-1) to 112.3 kg ha-1 (300 kg N ha-1)
(Table 3). Results indicate that in period from 7 October 2007 to 10 January 2008 sum of average nitrogen losses was 51.3 kg ha-1. During that period maize harvesting was at the beginning
of October (05 Oct 2007), basic fertilization for winter wheat, seeding of winter wheat in November (11-13 Nov 2007) and up to 10 January 2007 winter wheat was in tillering growth stage. Table 2. Precipitations (mm) and quantities of lysimeters discharge (L) during investigation
Table 3. Losses of NO3--N with lysimeters water per treatments and sampling period
07 Oct 31 Oct 22 Nov 02 Dec 08 Dec 10 Jan 23 Mar 08 Jun Sum
Precipitations, mm 272.8 69.9 48.5 26.5 24.3 2.9 62.9 144.7 652.5
Treatment Lysimeters discharge (L) Sum
N 0 18.0 14.0 18.0 15.0 15.0 7.0 18.0 17.0 122.0
N 100 17.0 18.0 21.0 18.0 17.0 6.0 23.0 20.0 140.0
N 200 15.0 16.0 17.0 15.0 16.0 7.0 15.0 8.0 109.0
N 300 7.0 17.0 19.0 17.0 15.0 1.0 12.0 7.0 95.0
Average 14.3 16.3 18.8 16.3 15.8 5.3 17.0 13.0 116.5
Treatment kg NO3-N ha-1
07 Oct 31 Oct 22 Nov 02 Dec 08 Dec 10 Jan 23 Mar 08 Jun Sum
N 0 1.96 1.38 0.42 0.39 0.36 0.33 1.01 0.12 5.97
N 100 13.28 7.24 9.79 6.43 5.71 1.49 10.10 2.85 56.90
N 200 16.89 10.99 9.65 8.98 7.48 4.23 9.08 3.62 70.92
N 300 12.60 24.82 23.27 21.64 14.80 0.87 12.91 1.35 112.26
Average 11.18 11.11 10.78 9.36 7.09 1.73 8.27 1.98 61.51
Figure 5. Nitrate-nitrogen concentrations in lysimeter outflow per treatments and sampling dates
0 10 20 30 40 50 60 70 80
07 Oct 31 Oct 22 Nov 02 Dec 08 Dec 10 Jan 23 Mar 08 Jun
2007 2008
mg NO
3
--N L
-1
N 0 N 100 N 200 N 300
In period from 23 March to 08 June 2008 (second and third N topdressing in 09 April 2008) when winter wheat was in steam extension and ripening growth stage sum of average nitrogen losses was 10.3 kg ha-1 (Table 3). It is evident that winter wheat
cor-relation with applied nitrogen fertilization doses and varied from 6.3 kg ha-1 to 28.4 kg ha-1. Mesić et al. (2007) also conclude that
sustainable mineral fertilizer rate for maize ranges between 150 and 200 kg ha-1 of mineral nitrogen. Additional amounts of
ni-trogen can cause increase in yield and in grain nini-trogen content, but with stronger adverse eff ects on water quality. Zgorelec et al. (2007) reported signifi cantly higher losses of NO3-N in
peri-ods of crop absence then in crop presence. In maize vegetation periods nitrogen losses range was 1.81 to 16.02 kg ha-1, while in
crop absence from 8.46 to 57.65 kg ha-1 depending on N
applica-tion rates, amount of precipitaapplica-tions and outlet from drainpipe.
Conclusions
Research results indicate that the soil NO3--N content
sig-nifi cantly varied (27.3 kg ha-1 to 338.2 kg ha-1) depending on the
treatment and sampling time. Th is NO3-N loads permanently retained within the system and regarding the nitrate-nitrogen content in the soil-water system it is necessary to investigate nitrate-nitrogen transfer from soil to groundwater. Th is study shows that high rates of N fertilizer in the production of maize and winter wheat have resulted in excessive NO3-N leaching, with concentrations in lysimeter water frequently exceeding the maxi-mum allowable level of 10 mg/L of nitrate nitrogen for drinking water. NO3-N losses through lysimeter outfl ow were infl uenced by quantity and time of fertilizers applications, but also by cli-mate conditions, crops grown and their development stages.
References
Abu S.T., Malgwi W.B. (2011). Spatial variability of soil physico-chenical properties in Kadawa irrigation project in Sudan savanna agroecology of Nigeria. International Journal of Agricultural Research 6/10: 714-735
Arnsson P.G, Bergström L.F. (2001). Nitrate leaching from lysim-eter-grown short-rotation willow coppice in relation to N-application, irrigation and soil type. Biomass and Bioenergy 21:155-164
Bai J., Wang Q., Deng W., Gao H., Tao W., Xiao R. (2011). Spatial and seasonal distribution of nitrogen in marsh soils of a typi-cal fl oodplain wetland in Northeast China. Environmental Monitoring and Assessment DOI 10.1007/s10661-011-2037-3 Beck T. (1983). Mineralization of soil nitrogen in laboratory
incuba-tion experiments. Pfl anzenernaehr Bodenkd 146: 243-252 Bensa A., Vidaček Ž., Bogunović M., Vrhovec D. (2008). Nitrogen
Leaching in Crop Production. In: Proc of 43rd Croatian and 3rd International symposium on agriculture Agroecology and Ecological Agriculture, Opatija, Croatia, pp 20-21
Brown L.R. (1999). Feeding nine billion. In: State of the World 1999 (LR Brown, C Flavin, H French, eds), A World Watch Institute Report on Progress Toward a Sustainable Society, W. Norton & Company, NY, 115–132
Čoga L., Ćustić M., Pecina M., Vršek I. (2003). Infl uence of Drain Spacing upon the Quantity of Nitrogen Leached. Agriculturae Conspectus Scientifi cus 68/1: 1-8
European Union (EU) (1991) Council Directive 91/676/EEC of 12 December 1991 concerning the protection of waters against pol-lution caused by nitrates from agricultural sources. Offi cial Journal L 375, P.0001-0008
Fang Q., Yu O., Wang E., Chen Y., Zhang G., Wang J., Li L. (2006). Soil nitrate accumulation, leaching and crop nitrogen use as infl uenced by fertilization and irrigation in an intensive wheat-maize double cropping system in the North China Plain. Plant Soil 284: 335–350
Food and Agriculture Organization of the United
Nations,FAOSTAT Database Collection, Rome: FAO (2011). http://faostat.fao.org/site/575/default.aspx#ancor
Food and Agriculture Organization of the United Nations (GTOS - Global Terrestrial Observing System) (2009). Assessment of the status of the development of the standards for the Terrestrial Essential Climate Variables – Biomass. 67
Guo L.P., Zhang F.S., Wang X.R., Mao D.R., Chen X.P. (2001). Eff ect of long-term fertilization on soil nitrate distribution. Journal of Environmental Sciences (China) 13/1: 58-63
HRN EN ISO 10304-1:1998 - HRN EN ISO 10304-1:1998, Water quality-Determination of dissolved fl uoride, chloride, nitrate, orthophosphate, bromide, nitrate and sulphate ions, using liq-uid chromatography of ions – Part 1: Method for water with low contamination
Ikerra S.T., Maghembe J.A., Smithson P.C., Buresh R.J. (1999). Soil nitrogen dynamics and relationships with maize yields in a glir-icidia–maize intercrop in Malawi. Plant and Soil 211: 155–164 Jurisic A., Mesic M., Sestak I., Zgorelec Z. (2013). Horizontal and vertical nitrate-nitrogen distribution under diff erent nitrogen fertilization levels. Crop production 62: 29-32
Khalil M.I., Rosenani A.B., Van Cleemput O., Fauziah C.I., Shamshuddin J. (2001). Nitrogen management in a maize-groundnut crop rotation of humid tropics: eff ect on N2O
emis-sion. In Optimizing Nitrogen Management in Food and Energy Production and Environmental Protection: Proceedings of the 2nd International Nitrogen Conference on Science and Policy. Th e Sciwntifi cWorld 1(S2): 320-327
Kristensen H.L., Th orup-Kristensen K. (2007). Eff ects of vertical distribution of soil inorganic nitrogen on root growth and sub-sequent nitrogen uptake by fi eld vegetable crops. Soil Use and Management. 23: 338–347
Lu C.Y., Zhang Q.Z., Zhao M.Q., Shi Y., Chen X. (2008).
Accumulation and profi le distribution of soil mineralized nitro-gen in fallow season. Communication in Soil Science & Plant Analysis 39/5-6: 707-714
Maithani K., Arunachalam A., Tripathi R.S., Pandey H.N. (1998). Nitrogen mineralization as infl uenced by climate, soil and veg-etation in a subtropical humid forest in northeast India. Forest Ecology and Management 109: 91–101
Mesić M., Fijan Parlov S., Bašić F., Kisić I., Turšić I., Zgorelec Ž., Sajko K., Vuković I. (2006). Agricultural emissions of greenhouse gases in Croatia. In: Viney PA (ed) Workshop Proceedings Workshop on Agricultural Air Quality: State of the Science Washington, USA, pp 910-913
Mesić M., Bašić F., Kisić I., Butorac A., Gašpar I. (2007). Infl uence of mineral nitrogen fertilization on corn grain yield and nitro-gen leaching. Cereal Research Communications 35/2: 773-776 Mesić M., Bašić F., Kisić I., Zgorelec Z. Vuković I., Sajko K, Jurišić
A. (2009). Izvješće o radu u 2008. godini. Gnojidba dušikom prihvatljiva za okoliš. Agronomski fakultet Sveučilišta u Zagrebu, pp 64
Mesić M., Zgorelec Z., Šestak I., Jurišić A., Kisić I. (2012). Loss of nitrogen with draiage water in a long term fi eld experiment. Növénytermelés 61/1: 479-482
Muller A. (2006). Sustainable Agriculture and the Production of Biomass for Energy Use. Working Papers in Economics 216: 1-26
Nance C.D., Gibson L.R., Karlen D.L. (2007). Soil Profile Nitrate Response to Nitrogen Fertilization of Winter Tritical. Soil Science Society of America Journal 71/4: 1343–1351
Oikeh S.O., Carsky R.J., Kling J.G., Chudeb V.O., Horst W.J. (2003). Diff erential N uptake by maize cultivars and soil nitrate dynamics under N fertilization in West Africa. Agriculture, Ecosystems and Environment 100: 181–191
Romanovskava A.A., Gytarsky M.L., Karaban R.T., Konyushkov D.E., Nazarov I.M. (2001). Th e dynamics of nitrous oxide emission from the use of mineral fertilizers in Russia. In: Proceedings of the 2nd International Nitrogen Conference on Science and Policy, Optimizing Nitrogen Management in Food and Energy Production and Environmental Protection, Potomac, Myrland, USA. pp 336-342
Sabey B.R. (1969). Infl uence of moisture tension of nitrate accumu-lation in soils. Soil Science Society of America Proceedings 33: 263-266
SAS Institute (2004) SAS/STAT® 9.1 User’s Guide. SAS Institute Inc., Cary, NC
Šimunić I., Mesić M., Sraka M., Likso T., Čoga L. (2011). Infl uence of drainage on nitrate leaching and maize yield. Cereal research communications 39/2: 273-282
Zgorelec Z., Mesić M., Bašić F., Kisić I., Butorac A., Gašpar I. (2007). Utjecaj gnojidbe i biljnog pokrova na gubitak dušika vodom iz tla. In: Gereš D (ed.) Proceedings of Croatian water and European Union - chalenges and possibilities, Opatija, Croatia, pp 671-678
Zovko M., Sraka M., Bile S., Kaluđerović I., Žnidarčić D. (2008). Nitrate and Ammonium Leaching in Open Field Tomato Cultivation under Diff erent N Rates and Mulch Managements. In: Proc of 43rd Croatian and 3rd International symposium on agriculture Agroecology and Ecological Agriculture, Opatija, Croatia, pp 22-23
Yin F, Fu B, Mao R. (2007). Eff ects of Nitrogen Fertilizer Application Rates on Nitrate Nitrogen Distribution in Saline Soil in the Hai River Basin, China. Journal of Soils and Sediments 7/3: 136-142
World Health Organization (1998). Guidelines for drinking-water quality. Health criteria and other supporting information. Nitrate and nitrite. WHO, Geneva, Switzerland, 2nd Edn. Addendum to Volume 2, 63–80
ÖNORM L 1092 (1993). Bestimmung wasserlöslicher Stoff e, Wien