CONSERVATION TILLAGE, OPTIMAL WATER AND ORGANIC NUTRIENT SUPPLY ENHANCE SOIL MICROBIAL ACTIVITIES DURING WHEAT (TRITICUM AESTIVUM L.) CULTIVATION
Pankaj Sharma1, 2, Geeta Singh2, Rana P.Singh*¹
1
Department of Environmental Science, Babasaheb Bhimrao Ambedkar University, Rae Bareily Road, Lucknow-226025, India; 2
Division of Microbiology, Indian Agricultural Research Institute, Pusa Road, New Delhi-110012, India.
Submitted: March 26, 2010; Returned to authors for corrections: April 16, 2010; Approved: November 04, 2010.
ABSTRACT
The field experiments were conducted on sandy loam soil at New Delhi, during 2007 and 2008 to investigate
the effect of conservation tillage, irrigation regimes (sub-optimal, optimal and supra-optimal water regimes),
and integrated nutrient management (INM) practices on soil biological parameters in wheat cultivation. The
conservation tillage soils has shown significant (p<0.05) increase in soil respiration (81.1%), soil microbial
biomass carbon (SMBC) (104%) and soil dehydrogenase (DH) (59.2%) compared to the conventional tillage
soil. Optimum water supply (3-irrigations) enhanced soil respiration over sub-optimum and supra-optimum
irrigations by 13.32% and 79% respectively. Soil dehydrogenase (DH) activity in optimum water regime has
also increased by 23.33% and 8.18% respectively over the other two irrigation regimes. Similarly, SMBC
has also increased by 12.14% and 27.17% respectively in soil with optimum water supply compared to that
of sub-optimum and supra-optimum water regime fields. The maximum increase in soil microbial activities
is found when sole organic source (50% Farm Yard Manure+25% biofertilizer+25% Green Manure) has
been used in combination with the conservation tillage and the optimum water supply. Study demonstrated
that microbial activity could be regulated by tillage, water and nitrogen management in the soil in a
sustainable manner.
Key words: Conservation Tillage, Integrated Nutrient Management (INM), Soil Respiration, Soil Microbial Biomass Carbon (SMBC), Dehydrogenase Activity (DH).
INTRODUCTION
India contributes approximately 12% (77.63 mt) of the
global wheat (Triticum aestivum L.) production (12). It is an input intensive crop, grown on 13% of the cropped area in the
Indo-Gangetic plains (IGP). Wheat is cultivated as a
component of rice-wheat cropping system (RWCS) in IGP.
The majority of Indian soils are low in N and therefore loading
of urea (46% N) is practiced. Integrated nutrient management
practices and resource conservation technologies are used to
enhance crop productivity in sustainable agriculture (19). This
has become more important in the wake of global climate
change which demands more judicious use of available
resources. Thus, the major target in the regime of global
climate change is water and energy conservation (26).
Tillage affects the physical, chemical, and biological
properties of the soil (34). A proper tillage can alleviate
soil-related constraints whereas an improper tillage leads to a
deterioration in soil structure. The latter further accelerated
erosion, depletion of soil organic matter (SOM) and soil
fertility as well as the disruption of the nutrient cycle (15, 25).
The conservation and addition of SOM are crucial for
biological, chemical and physical soil functionality and nutrient
cycling particularly of N. The N-cycling largely depends on the
microbial activities in the soil (9). The conservation tillage
improves soil organic carbon (SOC) concentration, water
storage and reduces soil erosion, and subsequently enhances
soil quality and resilience (21). It also increases SMBC (18),
activities of several soil enzymes (20, 23) as well as the soil
respiration (40).
Microbial activities affect nutrient cycling and the
availability of inorganic nutrients. The improved nutrient
cycling leads to soil fertility and subsequently enhance plant
growth and the crop yield (4). Soil enzymes and microbial
biomass have been considered as the major indicators of soil
quality due to their relationship to soil fertility, ease of
measurement, and high sensitivity to changes originated by the
management and environmental factors (7). Experiments have
revealed a positive correlation between soil management
systems and agriculturally beneficial microorganisms (17).
Many factors affect the sustainability of wheat production
under the RWCS. Some important factors are SOM content,
indigenous nutrient supply (14), the micronutrient, ground
water, percolation (1) etc. In order to overcome these
limitations and to sustain crop productivity and soil fertility, a
system (multicomponent) approach involving INM practices,
i.e. water conservation strategies, conservation tillage and
application of organic nutrients may yield good substitute of
conventional green revolution practices for wheat cropping.
Erenstein et al. (8), and Sahrawat et al. (31), have reported
higher or almost equal yield for rice-wheat cropping system
under conservation tillage as compared to conventional tillage.
Though, an integrated approach for tillage, water and nutrient
management for wheat crop has not been reported.
Therefore, experiments were undertaken to study the
combined effect of integrated nitrogen application, water
regimes, and tillage practices on soil (micro) biological indices
during wheat cultivation.
MATERIALS AND METHODS
Experimental Location: The field experiments were conducted at the research farm of Indian Agriculture Research
Institute, New Delhi, during the winter (Rabi) season of 2007
and 2008. The latitude of New Delhi is 28º38 N and longitude
is 77º12 E and its height above mean sea level is 216 m.
Physical and Chemical Analysis of Soil: The top soil (0-15 cm) was sandy clay-loam which was followed by a loamy
lower layer (15-90 cm) with field capacity 19-20% (w w-1) and
permanent wilting point 7-11% (w w-1). It had pH 7.7, organic
C (0.68) (16), 159-163 kg ha-1 alkaline permanganate
hydrolysable N (37), 14 kg ha-1 0.5 m NaHCO3 extractable P
(27) and 296 kg ha-1 1N NH4OAc exchangeable K (16)
determined by the procedures described by Prasad et al. (29).
Experimental Design: The experiments were laid out in split-plot design. Two main plots were divided for two tillage
treatments (i.e. conservation and conventional), which were
further divided in sub-plots for three different irrigation
treatments (i.e. sub-optimum, optimum and supra-optimum).
The sub-plots were further divided in sub-sub plots for
different nutrient treatments as mentioned in Table 1. The
treatments comprised of two tillage (i.e. Zero/conservation
tillage and conventional tillage) were maintained in all the
plots. Water management consisting of three water regimes; 2-
irrigations (sub-optimal), 3- irrigation (optimal) and 5-
at a gap of 20 days). The eight nitrogen sources applied to the
wheat plots are as in Table 1.
The three replicates (i.e. n=3) were maintained for each
nutrient treatment. The recommended dose of N in this region
for wheat is 120 kg ha-1 (34). The wheat cultivar (cv.) ‘HD
2876’ seeds were sown during the last week of October 2007
and 2008 at the spacing of 20×15 cm. A uniform dose of 33 kg
ha-1 P was made available through single superphosphate and
37 kg ha-1 of K made available through muriate of potash. Both
single superphosphate and muriate of potash applied to the
plots before sowing. The chemical N fertilizer (urea), was
applied in three split doses, i.e. half as basal dose; and the
remaining two doses in two equal parts as top dressing at
tillering and panicle initiation stages of wheat in the amount
mentioned in Table 1. The quantity of well decomposed FYM
containing 0.5 percent N (i.e. 0.05 Kg N Kg-1 of FYM) on
dry-weight basis was calculated by Kjeldahl’s method and
incorporated in the soil as a green manure (GM) before sowing.
Similarly, Sesbania aculeate was applied at 10.5 t ha-1 before seeding of wheat. The 25% of urea as biofertilizer
(Azospirillium brasilense) CDJA; received from Dr. J. Dobereiner, Brazil). The Azospirillium brasilense strain fixes
25-30% (of RDN) N ha-1. The coating of seeds with
biofertilizer has been achieved by dipping the seeds in aqueous
suspension culture of the biofertilizer. The inoculums density
was 108 cells ml-1 (41). A measured quantity of water through a
7.62 cm Parshall Flume was applied at the rate of 40 mm in
each irrigation, as per treatment. During the crop period, a total
rainfall of 112.0 and 111.8 mm were received during the 2007
and 2008, respectively. While relative humidity was 71 and
68.2 respectively and mean temperature was 18.24˚C and
18.46˚C.
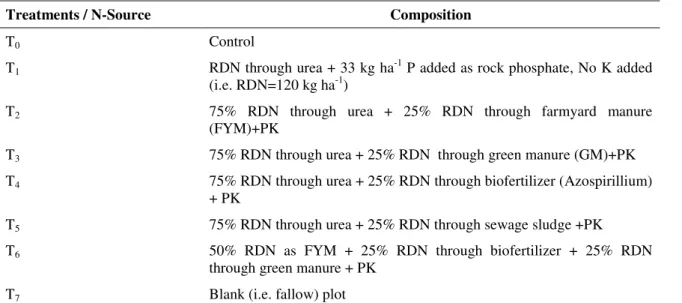
Table 1. Details of various nutrient combination used under integrated nutrient management practices.
Treatments / N-Source Composition
T0 Control
T1 RDN through urea + 33 kg ha-1 P added as rock phosphate, No K added
(i.e. RDN=120 kg ha-1)
T2 75% RDN through urea + 25% RDN through farmyard manure
(FYM)+PK
T3 75% RDN through urea + 25% RDN through green manure (GM)+PK
T4 75% RDN through urea + 25% RDN through biofertilizer (Azospirillium)
+ PK
T5 75% RDN through urea + 25% RDN through sewage sludge +PK
T6 50% RDN as FYM + 25% RDN through biofertilizer + 25% RDN
through green manure + PK
T7 Blank (i.e. fallow) plot
*Here T represents and respective numerals i.e. 1, 2 ….7 represents respective no. of treatments; N, represents Nitrogen, P, Phosphorus and K, Potassium
Estimation of Soil Respiration, Dehydrogenase and Soil Microbial Biomass Carbon (SMBC): Soil samples were collected from a depth of 0-15 cm immediately after the
harvest of wheat crop. Six sub-samples per treatment were
composited. The field moist samples were sieved to 2 mm and
biomass carbon content in the soil. The microbial biomass
carbon was estimated following chloroform fumigation
extraction method (39). The soil respiration was measured by
the method prescribed by Stotzky (36). The soil dehydrogenase
enzyme (DH) activity was estimated by the method given by
using Casida et al. (3).
Chemicals and Equipments used: All chemicals used were Sigma Chemicals, India situated in Badlapur district of
Thane, Mumbai. All equipments used were of Borosil
Company. Borosil is certified by ISO 9001. Manufacturing unit
of Borosil is situated in Worli, Mumbai – India.
Statistical Analysis: All the data recorded were analysed by using the standard procedure of statistical analysis for
split-plot design (11). Analysis of variance (ANOVA) was used to
determine the effect of each treatment, when the F-ratio was
significant; a multiple mean comparison was performed using
C.D. (Critical Difference) (0.05 probability level) values. The
data has been analysed by statistical package MSTAT.
RESULTS
Soil Respiration
The data presented in Table 2 indicate that a significant
soil respiration (81.1%) is determined in zero-tillage plots, over
the conventional tillage plots. Zero tillage condition has
brought about significant soil respiration compared to
conventional tillage. Among the integrated nitrogen
management treatments, the highest rate of soil respiration was
recorded in treatments where the N requirement has been made
available through a sole organic source (of N) (i.e. T6) (i.e.
32.72 mg CO2 (100 g) -1
soil) followed by the treatment T5 (i.e.
32.22 mg CO2 (100 g)-1 soil. These values showed significant
(p<0.05) soil respiration as compared to the control plots. For a
given nutrient management practice, the three different water
regimes significantly affected the soil respiration activity. Soil
receiving sole organic source during 3-irrigation recorded
10.3% and 23.7% higher soil respiration compared to 2-
irrigation and 5- irrigation respectively (Table 3). The use of
urea as a sole N-source brought about a decrease of 38.87%
and 32.28% in soil respiration under 2- irrigation and 5-
irrigation respectively, compared to 3- irrigation. The
substitution of sewage sludge for 25% RDN showed
statistically identical value of soil respiration under 2-
irrigation and the 5- irrigation but significantly higher soil
respiration in plots with 3- irrigation.
The most important parameter influencing the soil
respiration has been tillage regime, however, the treatment
where the sole organic source has been used as N-source along
with optimum irrigation provide better results as compared to
other nutrient treatments and irrigation regimes respectively.
Soil Dehydrogenase Activity (DH)
The zero tillage (conservation tillage) soil has brought
about significant soil dehydrogenase activity i.e.59.2%
compared to the conventional tillage soil in the wheat fields of
IGP (Table 2). The frequency of irrigation has also affected
soil dehydrogenase activity. The maximum soil dehydrogenase
activity (1.85 µg TPF g-1 soil h-1) has been observed in
3-irrigation plots, followed by 5- 3-irrigation (1.71 µg TPF g-1 soil
h-1) and 2- irrigation (1.50 µg TPF g-1 soil h-1) plots (Table 4).
Among the nutrient treatment sole organic source is found to
be most effective. It brought about 12.5% increases in
dehydrogenase activity compared to control. The next higher
value has been observed with T5 treatment (Table 2). Other
plots having RDN in various forms also had higher soil
dehydrogenase activity compared to control plots. The
conservation tillage plots with 3-irrigations have brought about
significantly higher soil dehydrogenase activity over the
conventional tillage plots in all the studies (Table 4). The
maximum soil DH has been, however, observed in the plots
applied with conservation tillage, 3- irrigation and sole N
supply through the organic sources i.e. FYM + biofertilizer +
GM which were closely followed when 75% N was urea and
Integrated nutrient treatments, where the RDN has been
substituted with sole organic source under zero tillage
registered 74.9% increase in DH activity compared to
conventional tillage system. While treatments where at least
25% of RDN has been substituted with FYM or biofertilizer
under zero tillage system registered 106.3% and 87.6%
increase respectively, compared to conventional tillage system
(Table 4). The 2- irrigation and 5- irrigation has been slightly
less favorable for enzyme activity as it resulted in a decrease of
DH activity by 23.3% and 8.2%, respectively, compared to 3-
irrigation. In contrast, the treatments where urea has been used
as sole N-source (T1) or where 75% urea+25% FYM (T2) is
applied, DH activity is found to be lower in case of 3-
irrigation as compared to 2- irrigation and 5- irrigation.
Similar, results have been obtained under remaining organic
treatments where 3- irrigations brought about better DH
activities than 2- irrigation and 5- irrigations.
The most important parameter influencing the soil DH
activity has been tillage regime. However, the treatment where
the sole organic source has been used as N-source along with
3- irrigation provide better results as compared to other nutrient
treatments and irrigation regimes respectively. Here some
variations are obtained for 2- irrigation and 5- irrigation
regimes, where 75% urea+25% FYM treatment yielded slightly
better results than sole organic N-source.
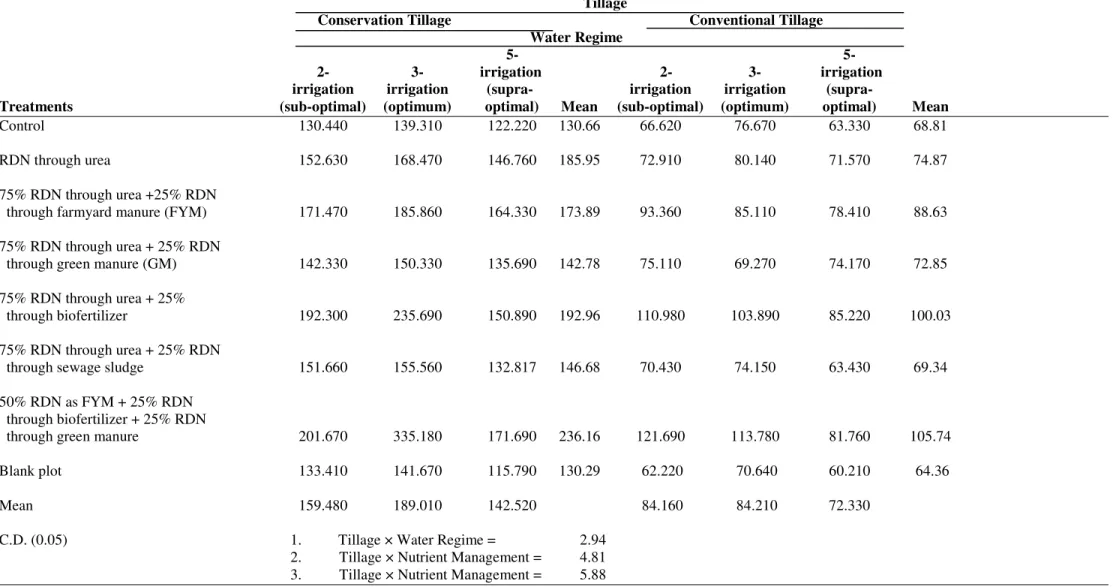
Soil Microbial Biomass Carbon
The zero tillage soil supported higher (104%) soil
microbial biomass carbon (SMBC) than the conventional
tillage soil (Table 2). The soils subjected to the 3- irrigation has
shown the 12.14% and 27.17% higher SMBC than the 2-
irrigation and 5- irrigation treatments, respectively. Significant
variations in SMBC were recorded among different INM
treatments as highest SMBC recorded in treatment T6 followed
by T5 and then T2. Application of RDN as organic sources has
resulted in an increase of SMBC by 71.3% and 48.12%
compared to control and RDN (as urea), respectively.
However, Treatment T3 & T4 have produced little effect in
improving SMBC under zero tillage wheat soils. This may be
due to the low redox conditions existing under zero tillage
soils. The partial or complete substitution of the RDN by
organic sources favored SMBC significantly in zero tillage
soils compared to conventional tillage soil. The magnitude of
increase recorded under conventional tillage soil with sole
organic source (123.34%), sewage sludge (111.54%), FYM
(103.07%), GM (95.99%), and biofertilizer (92.9%) compared
to the corresponding conventional tillage treatments (Table 5).
For a given N management treatment, the irrigation
treatments played a significant role in determining SMBC
status. The sole organic source substitution has shown the
highest (333.18 mg C g-1 soil) (Table 5) SMBC at 3- irrigation.
The 3- irrigation as a whole has shown highest SMBC values
under all treatments applied followed by 2- irrigation and then
5- irrigation. Thus among the three different water regimes 3-
irrigation supported significantly higher SMBC than 2-
irrigation and 5- irrigation. The magnitude of decrease has been
10.37% and 14.79% for RDN through urea, 8.39% and 13.1%
for RDN as FYM, 5.6% and 10.78% for RDN as GM, 22.56%
and 56.19% for RDN as biofertilizer, 12.14% and 27.17% for
sole organic N source, 2.57% and 17.12% for sewage- sludge
and 6.19% and 22.35% for blank plot for 2- irrigation and 5-
irrigation, respectively compared to 3- irrigation.
The most important parameter influencing the SMBC
activity is tillage regime. However, the treatment where the
sole organic source has been used as N-source along with
optimum irrigation provide better results as compared to other
Table 2. Effects of tillage, water regimes and integrated N management practices on soil biological properties in wheat cultivated under the contrasting agronomic practices.
Treatments Soil respiration
(mg CO2 (100g) -1
soil per h-1)
Soil dehydrogenase activity (µg TPF g-1 soil
per h-1)
Microbial biomass carbon
(µg g-1soil) Tillage (T)
Conservation tillage 36.60 2.07 163.67
Conventional tillage 20.21 1.30 80.23
C.D. (0.05) 0.85 0.09 1.69
Water management (WM)
2-irrigation (Sub-optimal) 27.32 1.50 121.82
3-irrigation (Optimum) 30.96 1.85 136.61
5-irrigation (Supra-optimum) 26.95 1.71 107.42
C.D. (0.05) 1.04 0.11 2.08
Tillage × WM (T ×WM) * * *
INM
1. Control 25.52 1.175 99.76
2. RDN through urea 30.96 1.955 115.41
3. 75% RDN through urea + 25% RDN through farmyard manure (FYM)
30.62 1.96 129.76
4. 75% RDN through urea + 25% RDN through green manure (GM)
25.86 1.33 107.82
5. 75% RDN through urea + 25%through Biofertilizer
32.22 2.10 146.49
6. 75% RDN through urea + 25%RDN through sewage sludge
25.19 1.31 108.01
7. 50% RDN as FYM + 25%RDN through biofertilizer + 25%RDN through green manure
32.72 2.144 170.95
8. Blank plot 24.21 1.191 97.32
CD (0.05)
T × INM * * *
WM × INM * * *
T ×WM × INM * * *
Table 3. Interaction of tillage, water regimes and integrated nutrient nitrogen management on soil respiration (mg CO2 (100g) -1
soil per 24 h-1) in wheat cultivated under contrasting
agronomic practices.
Tillage
Conservation Tillage Conventional Tillage
Water Regime
2- 3- 5-irrigation 2- 3- 5-irrigation
irrigation irrigation (supra- irrigation irrigation (supra-
Treatments (sub-optimal) (optimum) optimal) Mean (sub-optimal) (optimum) optimal) Mean
Control 33.220 34.760 30.300 32.76 18.410 19.210 17.220 18.28
RDN through urea 34.047 47.280 35.740 39.02 20.327 22.270 26.110 22.90
75% RDN through urea +25% RDN
through farmyard manure (FYM) 40.700 42.020 36.120 39.61 22.340 24.140 18.380 21.62
75% RDN through urea + 25% RDN
through green manure (GM) 31.580 34.100 31.860 32.51 19.240 21.110 17.260 19.20
75% RDN through urea + 25%
through biofertilizer 35.227 47.080 40.760 41.02 20.680 26.840 22.700 23.41
75% RDN through urea + 25% RDN
through sewage sludge 31.260 33.380 31.900 32.18 17.080 22.040 15.440 18.19
50% RDN as FYM + 25% RDN through biofertilizer + 25% RDN
through green manure 43.900 48.430 39.160 43.83 24.700 21.123 19.020 21.61
Blank Plot 28.687 34.540 32.620 31.95 15.710 17.100 16.560 16.46
Mean 34.83 40.19 34.80 19.81 21.73 19.09
C.D. (0.05) 1. Tillage × Water Regime = 0.073
2. Tillage × Nutrient Management = 0.120
3. Tillage × Nutrient Management = 0.140
Table 4. Interaction of tillage, water regimes and integrated nutrient nitrogen management on soil dehydrogenase activity (µg g-1 soil per h-1) in wheat cultivated under contrasting agronomic practices.
Tillage
Conservation Tillage Conventional Tillage
Water Regime
5- 5-
2- 3- irrigation 2- 3- irrigation
irrigation irrigation (supra- irrigation irrigation (supra-
Treatments (sub-optimal) (optimum) optimal) Mean (sub-optimal) (optimum) optimal) Mean
Control 1.230 1.320 1.240 1.26 1.023 1.133 1.143 1.090
RDN through urea 2.660 2.363 2.563 2.53 1.233 1.343 1.570 1.380
75% RDN through urea +25% RDN
through farmyard manure (FYM) 2.770 2.467 2.690 2.64 1.350 1.123 1.370 1.280
75% RDN through urea + 25% RDN
through green manure (GM) 1.280 1.643 1.120 1.35 1.113 1.113 1.703 1.310
75% RDN through urea + 25%
through biofertilizer 2.317 3.423 2.470 2.74 1.110 1.313 1.963 1.460
75% RDN through urea + 25% RDN
through sewage sludge 1.393 1.547 1.470 1.47 1.003 1.210 1.223 1.150
50% RDN as FYM + 25% RDN through biofertilizer + 25% RDN
through green manure 2.350 3.460 2.377 2.729 1.137 1.660 1.870 1.560
Blank plot 1.030 1.330 1.347 1.240 0.963 1.240 1.243 1.195
Mean 1.880 2.430 1.910 1.120 1.270 1.510
C.D. (0.05) 1. Tillage × Water Regime = 0.16
2. Tillage × Nutrient Management = 0.26
3. Tillage × Nutrient Management = 0.32
Table 5. Interaction of tillage, water regimes and integrated nutrient nitrogen management on soil microbial biomass carbon (SMBC) (µg g-1 soil per 24 h-1) in wheat cultivated under contrasting agronomic practices.
Tillage
Conservation Tillage Conventional Tillage
Water Regime
5- 5- 2- 3- irrigation 2- 3- irrigation irrigation irrigation (supra- irrigation irrigation (supra-
Treatments (sub-optimal) (optimum) optimal) Mean (sub-optimal) (optimum) optimal) Mean
Control 130.440 139.310 122.220 130.66 66.620 76.670 63.330 68.81
RDN through urea 152.630 168.470 146.760 185.95 72.910 80.140 71.570 74.87
75% RDN through urea +25% RDN
through farmyard manure (FYM) 171.470 185.860 164.330 173.89 93.360 85.110 78.410 88.63
75% RDN through urea + 25% RDN
through green manure (GM) 142.330 150.330 135.690 142.78 75.110 69.270 74.170 72.85
75% RDN through urea + 25%
through biofertilizer 192.300 235.690 150.890 192.96 110.980 103.890 85.220 100.03
75% RDN through urea + 25% RDN
through sewage sludge 151.660 155.560 132.817 146.68 70.430 74.150 63.430 69.34
50% RDN as FYM + 25% RDN through biofertilizer + 25% RDN
through green manure 201.670 335.180 171.690 236.16 121.690 113.780 81.760 105.74
Blank plot 133.410 141.670 115.790 130.29 62.220 70.640 60.210 64.36
Mean 159.480 189.010 142.520 84.160 84.210 72.330
C.D. (0.05) 1. Tillage × Water Regime = 2.94
2. Tillage × Nutrient Management = 4.81
3. Tillage × Nutrient Management = 5.88
DISCUSSION
The data presented in table 2 to 5 indicate that the
conservation tillage (i.e. zero/no-tillage) increases soil
microbial activity in terms of soil respiration, soil DH and
SMBC. The soil microbial activities have shown a positive
synergistic effect of conservation tillage with 3- irrigation (at
the gap of 20 days) for the wheat cultivation. Various nutrient
treatments (i.e. inorganic form as well as organic form) also
affect the soil microbial properties in tillage and irrigation
treatments (34).
Higher soil microbial activities are indicative of enhanced
soil fertility. It has been reported in many crop fields in various
agro-climatic conditions during the conservation tillage (38).
Masto et.al., 2006 (23) and Sahrawat et.al., 2010 (31) have
reported that the increased microbial activity. The increased
microbial activity enhance crop productivity and yield as well
as better soil fertility in different agro-climatic conditions
under conservation tillage system in wheat field.\
Daughtry et al. (5), reported increased biodegradation of
biomass under conservation tillage in wheat fields. Martinez et
al. (22) reported improved long-term soil microbial community
and enzymatic activity responses to an integrated cropping and
livestock system. However, no report is available to our data
base which has reported high microbial activity in wheat fields
in IGP under tillage management, various water regimes and
different INM practices which include various organic
supplements.
The excessive water, on the other hand can harm soil
microbes and plant growth. It produces anaerobic conditions in
rhizosphere and produces conditions like hypoxia (a condition
of oxygen deficiency). The hypoxic condition inhibits
reproductive growth of plants and thus delays harvest time.
This condition reduces yield of plant to almost zero (13).
Wheat suffers badly, if excessive amount of water is available
to the plant rhizosphere (30). Therefore, it is essential to
optimize water requirements for higher microbial activity,
which may further lead to the improved soil fertility and the
crop productivity.
The Irrigation regimes have also significantly affected
microbial activities of rhizosphere (34). Our results indicate
that 3-irrigations (each after 20 days) is sufficient to maintain
higher soil microbial activity. But an increase in frequency of
irrigation causes reduction in soil microbial activity. Thus, a
double loss of crop yield and water (under excessive irrigation)
occurs. Simultaneously, reduced irrigation (i.e. 2-irrigations)
also causes a slight drop in values of soil microbiological
parameters (Table 2 to 5).
Davis et al. (6), have reported that soil microbial
communities play an important role in agroecosystem
functioning on a large scale and they also contribute to global
element cycling. The rhizosphere of plants contributes
significantly to biogeochemical cycles (circulation of elements
like C, N, P, S etc.) in biosphere. Biogeochemical cycles are
important for maintaining ecological balance and nutrient
availability (24). It has been observed that no-tillage practices
increases availability of soil enzymes like acid phosphatase,
amylase, cellulase etc. Thus, no-tillage practices help in
circulation of minerals which enhances total carbon (C) and N
availability to plants (2). Our results also support that increased
microbial activity and thus improved nutrient availability help
in circulation of minerals (table 4 and 5).
Indian soil of IGP region which is used for extensive
agricultural practices are deficient in N. Therefore, the plants
especially cereals like wheat are highly responsive to the
exogenously supplied fertilizers (28). The excessive
N-loading in extensive agricultural practices enhances the input
cost of agriculture on one hand and causes nutrient losses in the
form of leaching, run-off and volatilization (33, 35). It has been
considered opinion that inorganic N-fertilizers should be
replaced by organic forms e.g., FYM, GMs and biofertilizers
etc. by maintaining the crop productivity as much as possible.
This approach is considered as INM (31).
substitution of inorganic sources with organic sources, (where
25-50% recommended dose of urea has been replaced by
organic manures like FYM, biofertilizer (Azospirillium) and
green manures) maintain highest soil respiration, soil DH and
SMBC (Table 2 to 5) during wheat cultivation. Similar results
have been reported by Hossain M.A., 2009 (14) and singh
et.al., 2008 (34) in various cereals. However, studies are very
rare in which the soil microbial activities under different
N-nutrition including wheat have been correlated to water
regimes and tillage practices, especially in IGP region.
CONCLUSIONS
The studies presented in this paper suggest that higher soil
fertility in terms of soil microbial activity can be maintained in
IGP having pre-dominantly the rice-wheat cropping system by
using zero tillage as conservation tillage practice, optimal
irrigation i.e. 3-irrigation at interval of 20 days. Further, either
sole organic (FYM: Biofertilizer: GM (2:1:1)) or a combination
of organic and inorganic N-applications in ratio of 1:1 can be
used with above stated tillage and irrigation practices to save
energy, water, cost of cultivation and to maintain high
productivity of crops in an ecologically balanced manner.
REFERENCES
1. Arora, V.K.; Gajri, P.R.; Uppal, H.S. (2006). Pudding, irrigation, and transplanting time effects on productivity of rice-wheat system on a sandy loam soil of Punjab, India. Soil Till Res. 85:212-220.
2. Balota, E.L.; Kanashiro, M.; Filho, A.C.; Andrade, D.S.; Dick, R.P. (2004). Soil enzyme activities under long-term tillage and crop rotation systems in subtropical Agro-Ecosystems. Braz. J. Microbiol. 35:300-306. 3. Casida, L.E.Jr.; Klein, D.A.; Santoro, T. (1964). Soil dehydrogenase
activity. SoilSci. 98:371-376
4. Crecchio, C.; Curci, M.; Antonella, P.; Ricciuti, P.; Tursi, N.; Ruggiero, P. (2007). Soil microbial dynamics and genetic diversity in soil under mono culture wheat grown in different long term management systems. Soil Biol Biochem. 39:1391-1400.
5. Daughtry, C.S.; Serbin, G.; Reeves III, J.B.; Doraiswamy, P.C.; Hunt Jr., R. (2010). Spectral reflectance of wheat residue during decomposition
and remotely sensed estimates of residue cover. Remote Sens. 2:416-431. 6. Davis, S.C.; Parton, W.J.; Dohleman, F.G.; Smith, C.M. (2010). Comparative biogeochemical cycles of bioenergy crops reveal Nitrogen-fixation and low greenhouse gas emission in a Miscanthus x giganteus agro-ecosystems. Ecosystem. 13:144-156.
7. Diosma, G.; Aulicino, M.; Chidichimo, H.; Balatti, P.A. (2006). Effect of tillage and N fertilization on microbial physiological profile of soil cultivated with wheat. Soil Till Res. 91:236-243.
8. Erenstein, O.; Farooq, U.; Malik, R.K.; Sharif, M. (2008). On-farm impacts of zero-tillage wheat in South-Asia’s rice-wheat systems. Field Crops Res.105(3): 240-252.
9. Fornara, D.A.; Tilman, D. (2009). Ecological mechanisms associated with the positive diversity-productivity relationship in and N-limited grassland. Ecology:vol. 90, No. 2, pp. 408-418.
10. Gill, M.S.; Shukla, A.K.; Singh, M.P.; Tomar, O.K.; Kumar, R.; Majumdar, K.; Tiwari, K.N. (2009). Evaluation of nutrient management options for yield, economics and nutrient use efficiency. Better Crops-India/2009:12-15.
11. Gomez K.A.; Gomez A.A. (1985). Statistical procedures for agricultural research. New York: John Wiley and Sons.
12. Government of India, New Delhi. (2009). Economic Survey 2008-2009. Agriculture. Economic Division. Government of India. New Delhi: Ministry of Finance.p. 154-173.
13. Guo, S.; Tang, Y.; Gao, F.; Ai, W.; Qin, L. (2008). Effects of low pressure and hypoxia on growth and development of wheat. Acta Astronautica. 63(7-10):1081-1085.
14. Hossain, M.A. (2009). Nutrient and residue management for improving productivity and N use efficiency of rice-wheat-mungbean systems in Bangladesh. The Proceedings of the International Plant Nutrition Colloquium XVI
15. Jacinthe, P.A.; Lal, R. (2009). Tillage Effects on Carbon Sequestration and Microbial Biomass in Reclaimed Farmland Soils of Southwestern Indiana. Soil Sci Soc. Am. J. 73:605-613.
16. Jackson, M.L. (1973). Soil chemical analysis. New Delhi: Practice Hall of India Pvt. Ltd.
17. Kaschuk, G.; Hungria, M.; Santos, J.C.P.; Berton-Junior, J.F. (2006). Differences in common bean rhizobial associated with soil tillage management in Southern Brazil. Soil TillRes. 87:205-217.
18. Liu, E.K.; Zhao, B.Q.; Mei, X.R.; So, H.B.; Li, J.; Li, X.Y. (2009). Effects of no-tillage management on soil biochemical characteristics in northern China. The Jour. Agri. Sci. Published online by Cambridge university press (20/11/2009). doi 10.1017/S0021859609990463. 19. Liu, X.; Liu, J.; Xing, B.; Herbert, S.J.; Meng, K.H.; Xiaozeng, H.;
20. Lupwayi, N.Z.; Hanson, K.G.; Harker, K.N.; Clayton, G.W.; Blackshaw, R.E.; O’Donovan J.T.; Johnson, E.N.; Gan, Y.; Irvine, R.B.; Monreal, M.A. (2007). Soil microbial biomass, functional diversity and enzyme activity in glyphosate-resistant wheat-canola rotations under low-disturbance direct seeding and conventional tillage Soil Biol Biochem. 39:1418-1427.
21. Madejon, E.; Moreno, F.; Murillo, J.M.; Pelegrin, F. (2007). Soil biochemical response to long-term conservation tillage under semi-arid. Mediterranean conditions. Soil Till Res. 94:346-352.
22. Martinez, V.A.; Bell, C.W.; Morris, B.E.L.; Zak, J.; Allen, V.G. (2010). Long-term soil microbial community and enzymatic activity responses to an integrated cropping-livestock system in a semi-arid region. Agric. Ecosyst. Env. (2010), doi:10.1016/j.agee.2010.02.008.
23. Masto, R.E.; Chhonkar, P.K.; Singh, D.; Patra, A.K. (2006). Changes in soil biological and biochemical characteristics in a long-term field trial on a subtropical inceptisol. Soil Biol Biochem. 38:1577-1582.
24. McGroddy, M.E.; Daufresne, T.; Hedin, L.O. (2004). Scaling of C:N:P stoichiometry in forests worldwide: Implications of terrestrial red-field type ratios. Ecology. 85(9):2390-2401.
25. Mohanty, M.; Painuli, D.K.; Misra, A.K.; Ghosh, P.K. (2007). Soil quality effects of tillage and residue under rice-wheat cropping on a vertisol in India. Soil TillRes. 92:243-250.
26. Nhemachena, C.; Hasran, R. (2007): Micro Level Analysis to Climate Change in Southern Africa, IFPRI. Discussion Paper No.714 (Washington, DC: International Food Policy Research Institute). 27. Olsen, C.R.; Cole, C.V.; Wantanable F.S.; Dean L.A. (1954). Estimation
of available P in soil by extraction with sodium bicarbonate. USDA Circ. No. 939. Washington. p.19.
28. Pal, D.K.; Bhattachary, T.; Srivastava, P.; Chandran, P.; Ray, S.K. (2009). Soils of the Indo-Gangetic plains:their historical perspective and management. Curr. Sci. 96:1193-1202.
29. Prasad, R.; Shivay, Y.S.; Kumar, D.; Sharma, S.N. (2006). Learning by doing in soil fertility (A practical manual for soil fertility). New Delhi: division of agronomy, Indian Agricultural Research Institute. p. 68. 30. Prasad, R.; Nagarajan, S. (2004): Rice-Wheat Cropping system-Food
security and sustainability. Curr. Sci. (87):1334-35.
31. Sahrawat, Y.S.; Singh, B.; Malik, R.K.; Ladha, J.K.; Gathala, M.; Jat, M.L. (2010). Evaluation of alternative tillage and crop establishment methods in a rice-wheat rotation in North-Western IGP. Field Crops Res. 116(3):260-267.
32. Simon, T.; Javurek, M.; Mikanova, O.; Vach, M. (2009). The influence of tillage systems on soil organic matter and soil organic matter and soil hydrophobicity. Soil Till. Res. 105:44-48.
33. Singh, B.; Singh, Y. (2008). Reactive nitrogen in Indian Agriculture: Inputs, use efficiency and leakages. Curr. Sci. 94:1382-1393.
34. Singh, G.; Kumar, D. (2008); Influence of tillage, water regimes and integrated nitrogen management practices on soil quality indices in rice (Oryza sativa L.) in the Indo-Gangetic plains; Archives of Agronomy and Soil Science 00:1-12.
35. Singh, R.P.; Dahiya, S.; Jaiwal, P.K. (2006). Slow release fertilizers for sustained nitrogen supply and high plant productivity. In: Nitrogen Nutrition in Plant Productivity (Eds. Singh RP, Shankar N and Jaiwal PK), Stadium Press, LLC, houston, USA, pp:329-349.
36. Stotzky, G. (1965). Microbial respiration. In: Blank CA, editor. Method of soil analysis. Part 2. Madison (WI): American Society of Agronomy Inc.
37. Subbiah, B.V.; Asija, G.L. (1956). A rapid procedure for estimation of available nitrogen in soils. Curr Sci. 5:656-659.
38. Valarini, P.J.; Alvarez, M.C.D.; Gasco, J.M.; Guerrero, F.; Tokeshi, H. (2002). Integrated evaluation of soil quality after the incorporation of organic matter and microorganisms. Braz. J. Microbiol. 33(2): doi: 10.1590/51517-83822002000100007.
39. Vance, F.; Brookes, P.; Jenkinson, D. (1987). Microbial biomass measurements in forest soil: the use of the chloroform fumigation incubation method in strongly acid soils. Soil Biol Biochem. 19:697-702. 40. Zhang, X.P.; Fang, H.J.; Yang, X. (2005). No-till and hand hoeing
impacts on carbon dioxide emissions from a silt loam in Northeast China. Comm. Soil Sci PlantAnal. 36:1041-1045.
41. Zorita, M.D.; Canigia, M.V.F. (2008): Field performance of a liquid formulation of Azospirillium brasilense on dryland wheat productivity. Eur. J. Soil Biol., 45 (1):3-11.