ORIGINAL ARTICLE
Abstract:
Background: Ageing universally affects individual, family, community and society with reduction in quality of life on chronologic, biological, social, and psychological dimensions. Aim and Objectives: The study was done to assess quality of life in physical, psychological, social and environmental domains among elderly population in relation to socio-demographic character. Material and Methods: A cross-sectional study was conducted among census population of 63 elderly individuals in Chanamana village, a community development block of Potia,
st st
Kishanganj, Bihar from 1 June –31 July 2014. By interview technique the quality of life was assessed using World Health Organization Quality of Life-BREF (WHOQOL-Life-BREF) questionnaire. Mean score was computed and compared by Z -test and one-way ANOVA using SPSS software, version 19.0. Results:
Among the study participants with alike gender distribution, majority (68.25% were in age group of 60-69 years, general caste (69.85%), joint family (84.12%) and residing with their children (82.54%). Of them 47.62 percent were illiterates and 42.86 percent were still earning. The mean score in the distinct four domains had no significant difference in genders and age groups. Yet, residing with children and belonging to joint family were noted to be significantly improving the scores in all the four
Quality of Life in Geriatric Population in a Community Development Block of
Kishanganj, Bihar, India
1 1* 2 3 4
Somenath Ghosh , Gautam Sarker , Krishnadas Bhattacharya , Ranabir Pal , Tushar Kanti Mondal
1Department of Community Medicine, MGM Medical College & LSK Hospital
Kishanganj-2
855107(Bihar) India, Department of Community Medicine, Medical College, Kolkata- 700073 (West
3
Bengal) India, Department of Community Medicine, Andaman and Nicobar Islands Institute of
4
Medical Sciences (ANIIMS), Port Blair -744104 (Andaman & Nicobar) India, Department of Community Medicine, IPGMER, Kolkata-700020 (West Bengal) India.
in physical, psychological and environmental domains among persons who were married and had their own income. Conclusion: The study showed the quality of life within diverse domains among elderly population need to be addressed with certain socio-demographic factors (joint family, marital status, own earning and children accompanying the geriatric population). Key words: Elderly, Quality of Life, WHOQOL-BREF Questionnaire
Introduction:
Global demographic structure is changing with a gradual shift towards a higher proportion of elderly people, from a declining trend in both fertility and mortality, had increased average life expectancy creating a new set of challenges in today's society.
th
response [2]. The chronic and degenerative diseases increase along with longer survival with major reduction in the quality of life due to its chronologic, biological, social, and psychological dimensions [3]. “Quality of Life (QOL)” has been defined by World Health Organization as: “The condition of life resulting from the combination of effects of the complete range of factors such as those determining health, happiness (including comfort in the physical environment and a satisfying occupation), education, social and intellectual attainments, freedom of action, justice and freedom of expression.” [3]. Generally, however, QOL is seen as the product of the interaction of a number of different factors - social, health, economic, and environmental conditions which cumulatively, and often in unknown ways, interact to affect both human and social development at the level of individuals and societies. All the aspects of 'health status', 'lifestyle', 'life satisfaction', 'mental state' and 'well-being' together reflect the multidimensional nature of QOL [2-3]. However, in India, few studies have reported on QOL of geriatric population, and we are yet to find reported studies from rural eastern India. [4-7]. Considering this background, this study was conducted to determine domains with added importance of hidden agenda of socio-demographic profile in relation to QOL of elderly population in one of the backward states in India.
Material and Methods:
An analytical cross sectional study was conducted in Chanamana village, a community development block of Potia, Kishanganj, Bihar for a period of 2 months. Study population were all the people aged 60 or more residing in the study area.
Inclusion criteria:
Those persons aged 60 years or more residing in that area and present on the days of data collection and consented to our study.
Exclusion criteria:
Critically ill, deaf and dumb, unable and refused to provide consent and absent on the days of data collection.
Instrument:
The World Health Organization Quality of Life-BREF (WHOQOL-Life-BREF) [6, 8-9] instrument was administered to assess the QOL. The instrument was translated into Bengali by the faculty members and statistician of the department of Community Medicine at MGM Medical College and LSK Hospital, Kishanganj, Bihar. This schedule was then back-translated into English by another expert not acquainted with the original versions. The back-translated version was subsequently compared with the original for conceptual equivalence of the items. The translated version of this instrument was pre-tested on a subsample of 10 persons in the field practice area of the college concerned to ensure feasibility and acceptability.
Data collection procedure:
Total population of Chanamana village was 1173; among them 86 were in the age group 60 years and above. Of them 71 persons participated in our study. Yet data analysis was possible for 63 people as eight people had provided incomplete response. For age determination voter card, any medical records were used. Study techniques were through house to house survey by interview method and review of old records. Data collection was initiated after Ethical Clearance obtained from Institutional Ethics Committee. Data were collected by house to house survey method. Data was collected twice in a week and 4-5 people were interviewed per day. After initial introduction and rapport building, the socio-demographic data were collected, following which the schedule containing WHOQOL-BREF was administered.
Operational definitions:
Literate- Any person aged seven years or more who can write and understand any one scheduled language.
Nuclear family- The family consisted of husband and wife, with or without unmarried children residing under same roof and sharing the same kitchen.
Joint family - Family of siblings are living together. The family consisted of father, mother plus unmarried sisters and/or brothers or husband, wife and their married children, etc.
Own income- Exclusive earning of the individual geriatric people participated in the study.
Statistical Analysis:
Data were tabulated and analysed using the Statistical Package for Social Sciences (SPSS) version 19. The results were expressed in terms of
mean and SE of mean. Z-test and one-way ANOVA test was applied to compare the mean scores of different variables under the four domains. Further, stepwise linear regression analysis was calculated to find role of socio-economic variables in different QOL domains. Alpha level of five percent was considered significant in all the statistical analysis.
Results:
Among the study participants gender distribution was comparable (52.30% male, 47.70% female). Majority of them belonged to the age group of 60-69 years (68.25%), belonged to general caste (69.85%), residing with their children (82.54%) at own residence, in joint families (84.12%), currently married (68.25% while others were either widow, widower or separated; nearly half (47.62%) were illiterates and had their own income (42.86%).
Mean score of different domain of QOL was maximum in physical domain (12.06) and
minimum in psychological domain (11.19)
(Table 1).
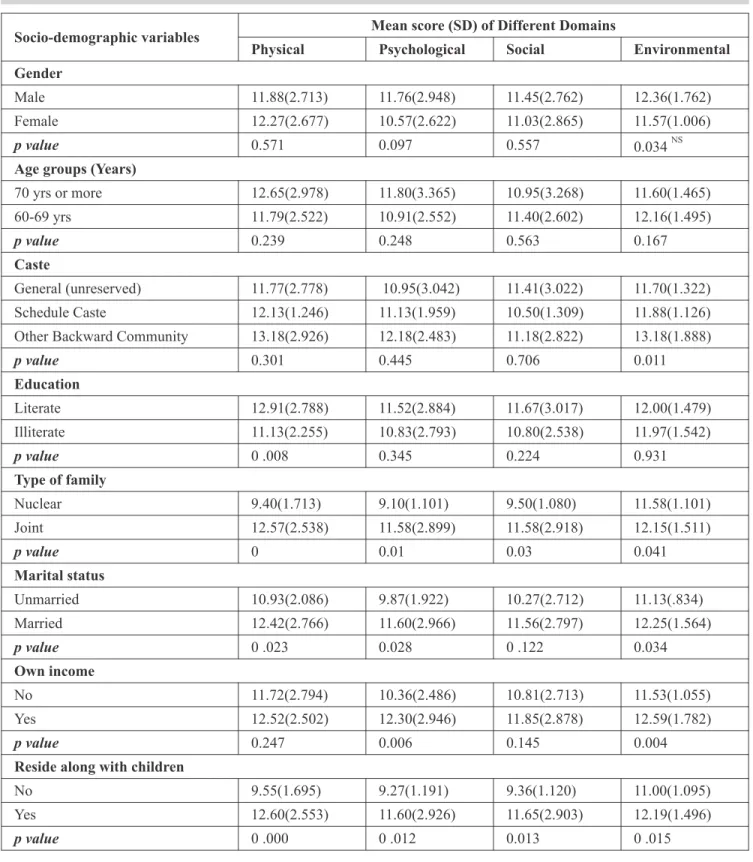
On comparison of mean scores of four domains according to socio-demographic variables, it was observed that age and gender had no significant effect in any QOL domains.
Different castes showed statistical significance in the mean scores in the environmental domain only.
Marital status also differed significantly in the
*
mean scores of physical (p=0.023 ),
psycho-* *
logical (p =0.028 ), and environmental (p=0.034 )
Own income had better QOL mean scores in all of the four domains. Presence of own income differed significantly in the domains of
*
psychological (p=0.006 ) and environmental
*
domain (p=0.004 ).
Those residing with their children had significantly better mean score in all four domains viz. physical
* *
(p=0.000 ), psychological (p=0.012 ), social
*
(p=0.013) and environmental (p=0.015 ).
Type of family (joint, nuclear) also significantly
*
related to all domains viz. physical (p=0.000 ),
*
psychological (p=0.010 ), social (p=0.030) and
*
environmental (p=0.041 ) (Table 2).
From the correlation matrix between different independent variables and physical domain score it was calculated that marital status, own income, and type of family had significant positive co-relation with physical domain score. Presence of own income, residence along with their children and married status had significant positive co-relation with psychological domain score. Regression-coefficient and their significance in stepwise linear regression for psychological domain score it was found that 13.8 percent changes of the domain score is contributed by per capita monthly income only while, per capita monthly income together with own income contributed 22.1 percent to score changes of that domain.
From another correlation matrix it was found that type of family, marital status [p=0.122], per capita monthly income residence along with their children had significant positive co-relation with social domain score. Regression-coefficient and their significance in stepwise linear regression for social domain score it was found that 21.2 percent changes of the domain score was contributed by per capita monthly income only. Similarly, marital status, per capita monthly income, type of family and own income had significant positive co-relation with environmental domain score From stepwise linear regression analysis it was found that 13.8 percent changes of the environmental domain score is contributed by per capita monthly income only and along with marital status altogether contributed by 49.8 percent changes of the environmental domain score.
Domains Mean ± SD
Physical 12.06 ± 2.68
Psychological 11.19 ± 2.83
Social 11.25 ± 2.81
Environmental 11.98 ± 1.49
Socio-demographic variables Mean score (SD) of Different Domains
Physical Psychological Social Environmental Gender
Male 11.88(2.713) 11.76(2.948) 11.45(2.762) 12.36(1.762)
Female 12.27(2.677) 10.57(2.622) 11.03(2.865) 11.57(1.006)
p value 0.571 0.097 0.557 NS
0.034
Age groups (Years)
70 yrs or more 12.65(2.978) 11.80(3.365) 10.95(3.268) 11.60(1.465)
60-69 yrs 11.79(2.522) 10.91(2.552) 11.40(2.602) 12.16(1.495)
p value 0.239 0.248 0.563 0.167
Caste
General (unreserved) 11.77(2.778) 10.95(3.042) 11.41(3.022) 11.70(1.322)
Schedule Caste 12.13(1.246) 11.13(1.959) 10.50(1.309) 11.88(1.126)
Other Backward Community 13.18(2.926) 12.18(2.483) 11.18(2.822) 13.18(1.888)
p value 0.301 0.445 0.706 0.011
Education
Literate 12.91(2.788) 11.52(2.884) 11.67(3.017) 12.00(1.479)
Illiterate 11.13(2.255) 10.83(2.793) 10.80(2.538) 11.97(1.542)
p value 0 .008 0.345 0.224 0.931
Type of family
Nuclear 9.40(1.713) 9.10(1.101) 9.50(1.080) 11.58(1.101)
Joint 12.57(2.538) 11.58(2.899) 11.58(2.918) 12.15(1.511)
p value 0 0.01 0.03 0.041
Marital status
Unmarried 10.93(2.086) 9.87(1.922) 10.27(2.712) 11.13(.834)
Married 12.42(2.766) 11.60(2.966) 11.56(2.797) 12.25(1.564)
p value 0 .023 0.028 0 .122 0.034
Own income
No 11.72(2.794) 10.36(2.486) 10.81(2.713) 11.53(1.055)
Yes 12.52(2.502) 12.30(2.946) 11.85(2.878) 12.59(1.782)
p value 0.247 0.006 0.145 0.004
Reside along with children
No 9.55(1.695) 9.27(1.191) 9.36(1.120) 11.00(1.095)
Yes 12.60(2.553) 11.60(2.926) 11.65(2.903) 12.19(1.496)
p value 0 .000 0 .012 0.013 0 .015
Discussion:
The present study was conducted to find out mean score of different domains of QOL i.e. physical, psychological, social and environmental and its relation with socio-demographic characteristics using the predesigned, pretested WHOQOL-BREF questionnaire structured schedule containing information on the household of the respondent. With alike, gender distribution of the study participants, majority (68.25%) were in age group of 60-69 years, general caste (69.85%), joint family (84.12%) and staying with their kids (82.54%). Of them 47.62 percent were illiterate and 42.86 percent were still earning. The mean score in the distinct four domains had no significant difference
in genders, age groups (60-69, ≥ 70). Yet, residing
with children and belonging to joint family were noted to be significantly in better score in all the four domains. Mean scores were significantly better in physical, psychological and environ-mental domains among persons who were married and had their own income.
Gender:
Gender distribution of our participants was
comparable to the current Indian scenario [1].The
female elderly (59.2%) participants outnumbered males (40.8%) in a reported study conducted by
Sowmiya et al. (2012) [10].
In the present study no significant gender-related differences were found in QOL scores. A study at
Vidyanagar, Karnataka by Lokare et al. (2011)
showed that mean scores of males and females differed significantly in the physical domain, but in other domains there were no significant difference between genders [11]. Similarly, no statistical significance were also found in study by Hameed
et al. (2014) study in physical, psychological and
environmental domain but significant relationship was present in Social domain in gender parameter
[12]. A study by Qadri et al. (2013) also revealed
that different gender had significantly different scores QOL [13]. Keralan researchers concluded that being a female increased the chance of having a poor mental component summary by 2.27 times though a majority of females in their study had lower educational qualifications and were unemployed with no income; their poor mental health status may be due to financial and health seeking dependency on their children or other family members [17].
Age:
The Karnataka study using WHOQOL-BREF questionnaire noted that different age group is significantly associated with physical, psycho-logical and social domains of QOL and marital status with social and environmental domains [7]. However, no statistical significance was found in Shahul study in psychological, environmental and social domain with different age groups, except in
physical domain [12]. A study by Sowmiya et al.
(2012) showed that the mean QOL scores decreased with increasing age [10]. In the present study different age groups had no statistical significance with any domains of QOL. In a study
by Qadri et al. (2013) study different age group
had significantly different scores with of QOL [13].
dependency and consequently resulting in reduced QOL [3, 18, 19].
Family life:
In the present study statistically significant higher mean score relationship was noted in all four domains of QOL among our participants who were residing with their children. A study by Qadri
et al. (2013) also reported statistically significant difference of mean score of QOL of study participants from different types of family [13]. Family relationship and social support was found to be significantly associated with QOL in
Myanmar study [14]Another study conductedby
Gupta et al. (2014) using WHOQOL Old Age
Home - BREF Scale noted that most important reason for elderly people living in public Old Age Home was no care taking person at home (77.1%) and children do not support (17.1%) [15]. A study
by Ghosh et al. (2014) also reported that being
single, and not living with their children significantly reduced QOL in the elderly subjects [16].
Marital Status:
In the present study marital status was significantly associated scores of all four domains. Married elderly too had better mean QOL score in all the domains except psychological domain in
study by Sowmiya et al. (2012) [10]. In study by
Qadri et al. (2013) [13] also concluded that marital
status had significant impact with of QOL in their study.
Education:
In the present study education had influenced only the physical domain scores while study by
Sowmiya et al. (2012) showed that literate elderly
had better mean QOL domain scores than the
illiterates [10]. In the study by Qadri et al. (2013) [13], reported the educational level had statistical significance with QOL. Educational level was found to be significantly associated with QOL in Turkey study also [3]. Education levels that increases self-esteems was found to be significantly associated with QOL in Myanmar
study [14]. A study by Ghosh et al. (2014) also
reported that low education, being single, lacking personal income, and not living with their children significantly reduced QOL in the elderly subjects [16].
Income:
Mean scores were significantly better in physical, psychological and environmental domains among persons who had their own income. A study by
Gupta et al. (2014) study using WHOQOL Old
Age Home - BREF Scale concluded that, that, important reason for elderly people living in public Old Age Home was poverty (20.0%) [15].
A study by Ghosh et al. (2014) also reported that
lacking personal income significantly reduced QOL in the elderly subjects [16].
Generally, literature from India and other developing countries in South-east Asia supported our findings [7, 9-14] with certain differences in certain parameters. This differences may be due to different geographical location, different socio-demographic pattern or may be just as an incidental finding or due to differences in the instruments, sample size and techniques.
There is a need for attention on geriatric health issues by specialized professionals including psychiatrist, psychologists and medical social workers.
Social support and improvement of socio-economic structure can lead to better QOL. These issues should be taken into account in framing different programmes like National Policy of Older Persons (NPOP), National Initiative on Care for Elderly (NICE), Integrated Programme for the Elderly (NGOs), National Programme for Health Care of the Elderly etc. So it is not duty of Govt only but also of every individual, as a part of a society and as citizen of a nation. A holistic approach only can bring smile in the life of elderly geriatric population.
Strength of the study:
In our present study, the WHOQOL-BREF instrument was used which is a valid tool and used by other researchers in many countries with comparable results.
Limitation of the study:
We had several limitations. In our infrastructure, poor eastern India with self-funded project, the parameters like occupation, per capita income, and sources of livelihood, socioeconomic status, religion, morbidity pattern and health care seeking behaviour were not taken into account in the study.
References 1. Population Composition, Chapter 2, Census of India.
[online] [cited on 17.02.2015] Retrieved from: http://www.censusindia.gov.in/vital_statistics/SRS_R eport/9Chap%202%20-%202011.pdf
2. Clark GS, Siebens HC. Geriatric Rehabilitation. In: De Lisa J, Ed. Physical Medicine and Rehabilitation, Lippincott Williams Wilkins Philadelphia; 2005: 1531-60.
3. Yesim A, Dilek D, Cengizhan D, Yüksel B, Ferhan C. Quality of Life and Level of Depressive Symptoms in the Geriatric Population. Turk J Rheumatol 2010; 25 (4): 165-73.
4. Dey AB, Ed. Handbook on health care of the elderly: A manual for physicians in primary and secondary health care facilities. WHO Regional Office for South-East Asia, New Delhi. Ministry of Health & Family Welfare and All India Institute of Medical Sciences, India, 1999 5. Men, ageing and health. WHO, Geneva, 1999. [online]
[cited on 17.02.2015] Retrieved from: http://apps.who. int/iris/bitstream/10665/66941/1/WHO_NMH_NPH_ 01.2.pdf
6. Mental health: New understanding, new hope. World health report. WHO, Geneva, 2001. [online][cited on 12.12.2014] Retrieved from:http://www.who.int/ whr/2001/en/whr01_en.pdf
7. Barua A, Mangesh R, Harsha Kumar HN, Mathew S. A cross-sectional study on quality of life in geriatric population. Indian J Community Med 2007; 32(2):146-7.
8. World Health Organization-Quality of life: WHOQOL-BREF: Australian version. Geneva: WHO; 2000.
9. Nelson CB, Lotfy M. The World Health Organization's WHOQOL-BREF quality of life assessment: Psychometric properties and results of the international field trial. Geneva: WHO (MNH/MHP/99.7); 1999. 10. Sowmiya KR, Nagarani. A study on Quality of Life of
Elderly Population in Mettupalayam, A Rural Area of Tamilnadu. Natl J Res Com Med 2012; 1(3):139-43. 11. Lokare L, Nekar MS, Mahesh V. Quality of Life and
Restricted Activity Days Among the old aged. Int J Biol
Med Res 2011; 2(4): 1162-4.
12. Hameed S, Brahmbhatt KR, Patil DC, Prasanna KS, Jayaram S. Quality of life among the geriatric population in a rural area of Dakshina Kannada, Karnataka, India. Global J Med Public Health 2014; 3(3): 1-5.
13. Qadri SS, Ahluwalia SK, Ganai AM, Bali SPS, Wani FA, Bashir H. An epidemiological study on quality of life among rural elderly population of Northern India.
14. Naing MM, Nanthamongkolchai S, Munsawaengsub C. Quality of Life of the Elderly People in Einme Township Irrawaddy Division, Myanmar. Asia J
Public Health 2010; 1(2): 4-10.
15. Gupta A, Mohan U, Tiwari SC, Singh SK, Singh VK. Quality of Life of Elderly People and assessment of facilities available in Old Age Homes of Lucknow, India. Natl J Community Med 2014; 5(1): 21-4.
16. Ghosh S, Bandyopadhyay S, Bhattacharya S, Misra R, Das S. Quality of life of older people in an urban slum of India. Psychogeriatrics 2014; 14(4): 241– 6.
17. George S, Leelamoni K, Paul N. Determinants of Quality of life of Elderly in A Rural Population Of Kerala, India. Natl J Res Community Med 2016; 5(1): 46-1.
18. Sazlina SG, Zaiton A, Nor Afiah MZ, Hayati KS. Predictors of health related quality of life in older people with non-communicable diseases attending three primary care clinics in Malaysia. J Nutr Health
Aging 2012; 16(5): 498-2.
19. Lima MG, Barros MB, César CL, Goldbaum M, Carandina L, Ciconelli RM. Health related quality of life among the elderly: a population-based study using SF-36 survey. Cad Saude Publica 2009; 25(10): 2159-7.