Original article
Contribution of the physical, social, psychological and environmental domains to overall quality of life of the elderly
Renata Junqueira Pereira* Rosângela Minardi Mitre Cotta** Sylvia do Carmo Castro Franceschini***
Rita de Cássia Lanes Ribeiro**** Rosana Ferreira Sampaio†
Silvia Eloiza Priore*** Paulo Roberto Cecon††
This article is part of the master’s thesis entitled “Quality of life of the elderly – Municipality of Teixeiras – MG,” defended by Renata Junqueira Pereira (Capes scholarship holder) and advised by Professor Dr. Rosângela Minardi Mitre Cotta in the Graduate Program in Nutritional Science, Department of Nutrition and Health, Universidade Federal de Viçosa, MG, Brazil. This study was partially supported by the Ministry of Health (no. 539/2003).
* MSc. in Nutritional Science, Department of Nutrition and Health, Universidade Federal de Viçosa, Viçosa, MG, Brazil.
** PhD in Public Health, University of Valencia, Spain. Associate Professor, Department of Nutrition and Health, Universidade Federal de Viçosa, Viçosa, MG, Brazil.
**** PhD in Epidemiology, Universidade Federal de Minas Gerais, Belo Horizonte, MG, Brazil. Associate Professor, Department of Nutrition and Health, Universidade Federal de Viçosa, Viçosa, MG, Brazil.
† PhD in Public Health, Autonomous University of Barcelona, Spain. Associate Professor, Department of Physical Therapy, Universidade Federal de Minas Gerais, Belo Horizonte, MG, Brazil.
†† PhD in Statistics, Universidade de São Paulo, São Paulo, SP, Brazil. Professor, Department of Informatics, Sector of Statistics, Universidade Federal de Viçosa, Viçosa, MG, Brazil.
INTRODUCTION
In developing countries, an accelerated aging of the population can be seen, with an increment in the elderly population higher than in developed countries.1
Nowadays, in Brazil, the elderly represent around 10% of the general population. The 2000 census reported that, of the 169.5 million Brazilians, 15.5 million are 60 years or more, and
projections point to a growth in this population group to 18 million until 2010 and 25 million until 2025.2,3
The aging process, which in developed countries takes place gradually, followed by
improvements in the health insurance plans, housing conditions, basic sanitation, work and food, in Brazil takes place rapidly and in a context of social inequalities, fragile economy, increasing indices of poverty, with a precarious access to health services and reduced financial resources, without the structural changes that meet the demands of the new emergent age group.4,5
The tendency to the aging of the population is causing deep changes in all sectors of society. According to Cotta et al.,6 the demographic transition has a growing and deep impact on all levels of society, but it is in health that it has the greatest transcendence, due to its repercussion in the several assistance levels as well as due to the demand for new resources and structures.
Therefore, it should be highlighted the scientific and social relevance of investigating the conditions that interfere with the well-being in the senescence and of proposing actions and policies in the health field, aiming to meet the demands of the aging population.7
The evaluation of the health condition is directly associated with the quality of life, influenced by gender, schooling, age, economic condition and presence of disabilities.8
Therefore, evaluating the life and health conditions of the elderly allows the implementation of intervention proposals, both in geriatric programs and in general social policies, with the aim to promote the well-being of the elderly.9,10
The expression “quality of life” has several connotations, which range from a popular concept, widely used nowadays – in relation to feelings and emotions, personal relationships, professional events, media advertisement, politics, health systems, social support activities, among others –, until the scientific perspective, with several meanings in the medical literature.11
With regard to its use in the medical literature, the term “quality of life” has been associated with several meanings, such as health conditions and social functioning. Health-related quality of life and subjective health status are concepts related to the subjective assessment of the patient and to the impact of the health status on the ability to have a full life.12
The group of researchers studying the quality of life at the World Health Organization (WHO), the WHOQOL Group,13 proposes a subjective and multidimensional concept for quality of life, which includes positive and negative elements: “quality of life is the individual’s perception of their position in life in the context of culture and value systems in which they live and in relation to their goals, expectations, standards, and concerns.” It is a wide and complex concept, which
comprehends physical health, psychological status, level of independence, social relationships, personal beliefs and the relationship with the characteristics of the environment.14
In this sense, the quality of life reflects the perception individuals have that their needs are being satisfied, or that they are being deprived of the opportunities of achieving happiness and self-realization, with independence of their physical health status or the social and economic
conditions.14
According to Arnold et al.15 and Suurmeijer et al.,16 Spilker’s model of quality of life includes the overall quality of life and the different domains, as well as different aspects that are part of each domain. The assessment of the overall quality of life, defined as the individual’s general satisfaction with life and the general perception of well-being, is the first level of Spilker’s model. The quality of life domains, separately, represent the second level. The most used ones are the psychological, the social and the physical domains, which satisfactorily reflect the quality of life, although some studies also include other domains, such as productivity, environment, cognition, occupation and financial situation. Finally, the third level of Spilker’s model is comprised of the specific aspects of each domain.
The main purpose of this study is to evaluate the influence of quality of life domains (physical, psychological, social and environmental) in the overall quality of life domain, therefore the first two levels of Spilker’s model will be analyzed, once the literature is consensual with regard to the study of these quality of life levels.15
The objectives of the present study were to analyze whether there was contribution of the physical, social, psychological and environmental domains in the overall quality of life and to investigate to which extent these domains explain the overall quality of life of elderly people resident in the municipality of Teixeiras, Southeastern Brazil.
METHODS
Characteristics of the municipality under investigation
urban area (62.33%) and 4,200 (37.67%) in the rural area, presenting an urbanization rate of 62.33% and mean annual growth rate of 1.23%. With regard to the number of elderly, 1,374 are 60 years or more, which represents 12.32%.2
The main economic activities developed in this municipality are: agriculture (coffee, rice, beans, manioc, corn, pineapples, tomatoes, sugar cane, sweet potatoes), cattle raising (cattle and hog business), silviculture and logging.17
From 1991 to 2000, the access to basic services and consumer goods increased, and the illiteracy level reduced from 28.3% (1991) to 17.4% (2000).17
Also in the period 1991-2000, the Index of Human Development (IHD) of Teixeiras increased 17.11%, going from 0.608 in 1991 to 0.712 in 2000. The dimension that contributed the most to this growth was education, with 42.4%, followed by longevity (30.5%) and income (27%). Over that period, the human development gap (the distance between the IHD of the municipality and the maximum IHD limit, i.e., 1 – IHD) was reduced in 26.5%.17
Subjects
Individuals aged 60 or more, resident in the municipality of Teixeiras were included in the study. We performed a previous record of all individuals aged 60 or more until the predicted date to begin the study, August 2004. This record was made with the aid of community health agents (CHA), who are part of the Family Health Program (FHP) teams of the municipality.
The FHP was created by the Brazilian Ministry of Health, standing out as the starting point of the system that proposes the reorganization of primary care in health promotion actions,
health/disease process is considered in a wider perspective, following the local, community and family realities.18 The year of reference for the FHP implementation in Teixeiras is 1997, and the total coverage of the population was reached in 1999. Nowadays, there are three family health teams, comprised of 18 health microareas.
Each CHA filled in a form providing name, address, birth date, age, gender, conditions of bedridden and/or unconscious and the condition of being a user or not of the FHP from all
individuals aged 60 ≥ years resident in the municipality. This record allowed us to obtain a list of all the elderly living in Teixeiras, since the FHP comprehends 100% of the population of the
municipality. This record was included in the database of the local FHP.
As a result of this survey, it was found that the elderly population of the municipality is represented by a total of 1,478 individuals. Of these, 965 (65.29%) live in the urban area and 513 (34.7%) in the rural area; 775 (52.43%) are female and 703 (47.56%) are male; 964 (65.22%) are users of the FHP and 514 (34.77%) are not; 101 (6.83%) are bedridden, 56 (3.78%) are unconscious and 20 (1.35%) are hospitalized. Based on these data, we proceeded to the sample selection.
Sample selection
The sample of the study was random, stratified by gender, use of the FHP and health microarea.
Given the characteristics of the study, with the aid of the FHP health professionals, the individuals who were bedridden, unconscious, with mental problems and hospitalized were excluded form the study, resulting in 1,301 elderly people.
After the exclusion criteria were applied, 15% of the total recorded individuals were calculated in each health microarea, and the representative number of this percentage was
in the municipality, and thus it could be assured that the individuals from all locations were represented in the study.
After the stratification and determination of the number of individuals from each microarea, we performed a sample randomization. The sample was composed of 211 elderly individuals, which represents 14.28% of the elderly population in the municipality.
Study design
It is a cross-sectional observational study, in which we performed interviews in home visits, from August to December 2004. The direct interviews were performed by a single trained
interviewer. A pilot study in a population with similar characteristics to the population of Teixeiras was performed, but in a different municipality.
Two instruments were used for the data collection. To characterize the sociodemographic aspects (gender, age, marital status, income and schooling), an instrument was specifically created for this study.
To assess the quality of life, we used the instrument proposed by the WHO for adults, the World Health Organization Quality of Life Instrument Bref (WHOQOL-Bref). This instrument has been used to measure the health-related quality of life in sick, healthy and elderly groups of
individuals.19
The WHOQOL-Bref is a reduced version of the World Health Organization Quality of Life Instrument 100 (WHOQOL-100) and is composed of 26 questions: two of them are general
questions about quality of life, and 24 represent each of the 24 aspects that are part of the original instrument, the WHOQOL-100. The data that originated the abridged version were extracted from field tests in 20 centers in 18 countries.20 This study used the Brazilian version of the WHOQOL-Bref, translated and validated by the group of studies on quality of life at WHO in Brazil.
environment in which the individual is inserted. Besides these four domains, the WHOQOL-Bref is also composed of a domain that analyzes the overall quality of life.19,20 Each domain is composed of questions, whose answers have scores ranging from 1 to 5.
The final scores of each domain are calculated by a syntax, which considers the answers for each question that composes the domain, resulting in final scores in a scale from 4 to 20,
comparable to the WHOQOL-100, which may be transformed into a 0-100 scale.
The instrument is self-administered, but in this study we chose the direct interview, due to the reading difficulty, visual problems and illiteracy, which are common in the elderly.
The use of the WHOQOL-Bref in this study is justified by the literature, which shows a good response of the instrument to the quality of life of the elderly,19 and due to the absence of a
validated instrument for elderly people and translated into Portuguese with such comprehending characteristics and easy applicability.
The research protocol was approved by the human research ethics committee at
Universidade Federal de Viçosa, Minas Gerais, Brazil. All individuals who agreed to participate in the study signed a consent term.
Data analysis
The data were analyzed using the Student's t test for comparisons between averages of two groups (female and male). Pearson’s correlation coefficient was calculated between the domains (physical, environmental, social and psychological) and the overall quality of life. Models of multiple linear regression analysis were developed to verify the influence of the sociodemographic variables in the quality of life domains and to analyze the contribution of these domains in the overall quality of life. The stepwise procedure was used, in which statistical inclusion criteria are applied. Significance level was set at 5%.
RESULTS
Sociodemographic characteristics
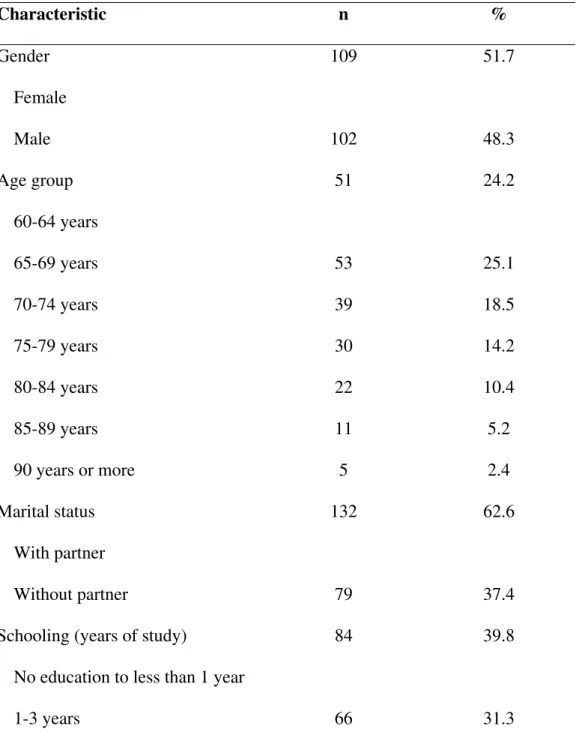
As described in Table 1, out of the 211 elderly people assessed, 109 (51.7%) are female and 102 (48.3%) are male. Mean age ranged from 60 to 93 years, with mean of 71.09 (± 8.09).
Table 1 - Sociodemographic characteristics of the elderly individuals, Teixeiras (MG), 2004
Characteristic n %
Gender 109 51.7
Female
Male 102 48.3
Age group 51 24.2
60-64 years
65-69 years 53 25.1
70-74 years 39 18.5
75-79 years 30 14.2
80-84 years 22 10.4
85-89 years 11 5.2
90 years or more 5 2.4
Marital status 132 62.6
With partner
Without partner 79 37.4
Schooling (years of study) 84 39.8
No education to less than 1 year
4-7 years 53 25.2
8-10 years 2 0.9
11-14 years or more 6 2.8
Monthly income 18 8.5
No income
Up to 1/2 MW 3 1.4
From 1/2 to 1 MW 126 59.7
From 1 to 2 MW 38 18.1
From 2 to 3 MW 14 6.7
From 3 to 5 MW 6 2.8
From 5 to 10 MW 6 2.8
MW = minimum wage; n = 211.
With regard to the marital status, 62.6% live with their partners, and the others without partners. Concerning schooling and income, 71.1% have less than 4 years of formal studies, and 61.1% have a monthly income equal or lower than 1 minimum wage (MW), which corresponds to € 83.33.
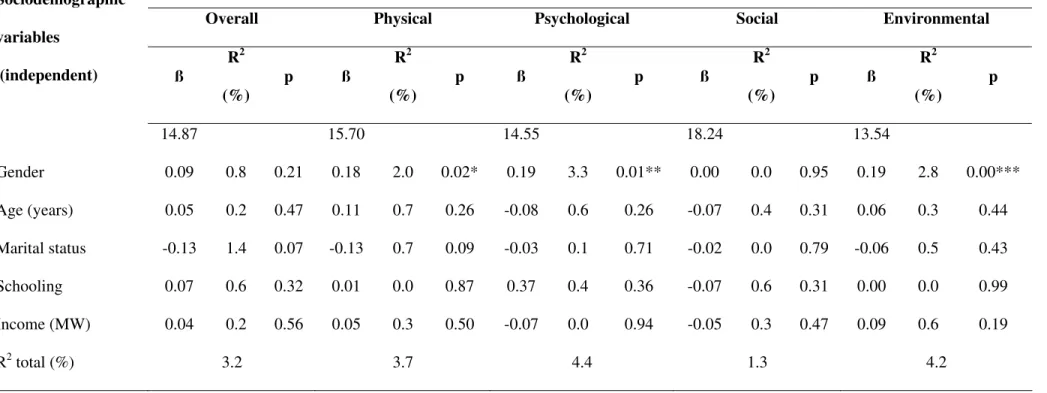
Table 2 - Contribution of the sociodemographic variables in each quality of life domain of the WHOQOL-Bref
Domains (dependent variables)
Overall Physical Psychological Social Environmental
Sociodemographic
variables
(independent) ß
R2
(%)
p ß R2
(%)
p ß R2
(%)
p ß R2
(%)
p ß R2
(%)
p
14.87 15.70 14.55 18.24 13.54
Gender 0.09 0.8 0.21 0.18 2.0 0.02* 0.19 3.3 0.01** 0.00 0.0 0.95 0.19 2.8 0.00***
Age (years) 0.05 0.2 0.47 0.11 0.7 0.26 -0.08 0.6 0.26 -0.07 0.4 0.31 0.06 0.3 0.44
Marital status -0.13 1.4 0.07 -0.13 0.7 0.09 -0.03 0.1 0.71 -0.02 0.0 0.79 -0.06 0.5 0.43
Schooling 0.07 0.6 0.32 0.01 0.0 0.87 0.37 0.4 0.36 -0.07 0.6 0.31 0.00 0.0 0.99
Income (MW) 0.04 0.2 0.56 0.05 0.3 0.50 -0.07 0.0 0.94 -0.05 0.3 0.47 0.09 0.6 0.19
R2 total (%) 3.2 3.7 4.4 1.3 4.2
MW = minimum wage.
For the overall and social domains, none of the sociodemographic variables had a significant interference (p > 0.05). Although we chose to differentiate between the urban and the rural area in the sample selection, there were no significant differences between the urban and rural subjects in the quality of life determinants.
For the physical, psychological and environmental domains, only the variable gender showed a significant contribution, although small. Gender interferes in 2% in the physical domain, 3.3% in the psychological domain and 2.8% in the environmental domain.
Therefore, the Student's t test was performed to compare the score averages of the quality of life domains between the female and male genders (table 3).
Table 3 - Comparison between the mean scores of the quality of life domains between the female and male genders.
Domains
Male (mean ± SD)
Female (mean ± SD)
p
Overall 15.33 ± 2.29 15.04 ± 2.65 0.401 Physical 16.20 ± 2.38 15.51 ± 2.50 0.042* Psychological 16.14 ± 2.21 15.22 ± 2.73 0.008** Environmental 15.20 ± 2.12 14.50 ± 1.98 0.015* Social 17.28 ± 2.15 17.29 ± 2.19 0.959
*Significant at 5% level by the Student's t test. **Significant at 1% level by the Student's t test.
Quality of life domains and the overall domain
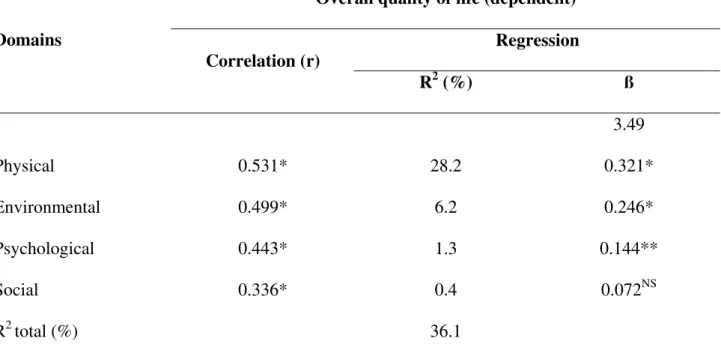
Pearson’s correlation was initially performed between the domains (physical, psychological, social and environmental) and the quality of life overall domain. All domains were correlated positively and significantly with the overall domain, despite the correlations being low (table 4).
Table 4 - Estimate of Pearson’s correlation coefficients and of the linear regression analysis between the domains and the overall quality of life
Overall quality of life (dependent) Regression Domains
Correlation (r)
R2 (%) ß
3.49
Physical 0.531* 28.2 0.321*
Environmental 0.499* 6.2 0.246*
Psychological 0.443* 1.3 0.144**
Social 0.336* 0.4 0.072NS
R2 total (%) 36.1
NS = non-significant at 5% level by the Student's t test. * Significant at 0.1% level by the Student's t test. ** Significant at 5% level by the Student's t test.
We thus proceeded to the multiple linear regression analysis to verify the contribution of each domain in the overall quality of life (dependent variable). The sociodemographic variables were not included in this model, since they did not show significant interference in the quality of life overall domain, when previously analyzed.
non-significant (p > 0.05). The domain that contributed the most to the overall quality of life is the physical (28.2%), followed by the environmental (6.2%) and the psychological (1.3%). The results are summarized in table 4.
DISCUSSION
Sprangers et al.22 showed that factors such as old age, female gender, low schooling level and not having a partner are related to low levels of quality of life. Moreover, other studies also controlled the influence of these sociodemographic variables.15,16
Therefore, in the present study, we chose to analyze the sociodemographic variables gender, age, marital status (with or without partner), schooling and income. Income was included for also being considered a major socioeconomic indicator.
Most of the elderly people studied have a low income and low schooling level. It can be seen that 71.1% have less than 4 years of study and can be considered, according to IBGE,23 as functional illiterates. This percentage is higher than the Brazilian population, which, in 2003, had 57.9% of elderly people with less than 4 years of schooling.23
With regard to the monthly income, 61.1% have monthly income equal or lower than 1 MW. In the Brazilian population, in 2003, 43.8% of the elderly people had an income lower than 1 MW.23 It is a consensus that the productivity and employability decrease with age. From 60 years on, individuals become increasingly more dependent of the income of the other people living in the same house to survive and maintain their life standard. Furthermore, retirement also starts to play a major role in the income of elderly people.24 That is the reason why there is a great percentage of elderly people living with 1 MW, which is the retirement pension more frequently given to the elderly people in Brazil.
life. Sherbourne et al.26 also found that financial problems reduced the well-being of elderly people. Nevertheless, in our study we did not find a significant influence of the income variable in any quality of life domain, which may be attributed to the fact that Teixeiras is a small town, with low cost of living, prevailing the family and subsistence agricultural activities. In addition, the FHP provides free sanitary assistance, including home visits by the health professionals and distribution of medication.
With regard to the quality of life scores, they are a positive scale (the higher the score, the better the quality of life), and there are no cut-off points to determine a specific score by which the quality of life could be assessed as “good” or “bad.”27
However, the results of this study indicate that the elderly people from Teixeiras presented good quality of life scores for all domains of the WHOQOL-Bref, when compared with the
maximum scores for each domain and the averages found for the different quality of life domains in the population studied.
When we analyzed the influence of the sociodemographic variables gender, age, marital status, schooling and income for the different quality of life domains, we observed that they had no influence on the overall quality of life of the elderly people studied; only the variable gender had a significant, although small influence on the physical, psychological and environmental domains, and the mean scores of theses domains were significantly higher among males.
more exposed than men to physical and mental problems, which could explain lower scores in the psychological domain.
Although this study has not demonstrated an influence of age on the quality of life scores, it is important to consider the age and gender differences in studies on the quality of life of the
elderly. According to García et al.,31 old age was associated with worst levels of health-related quality of life. Moreover, several other studies showed the effect of age on quality of life of the elderly.32-34 In our study, one possible explanatory hypothesis to the fact that the influence of age on the quality of life was not observed may be the fact that only 7.6% of the sampled elderly people were 85 years or more, i.e., a small part had older ages; another explanatory hypothesis may be the fact that the elderly people from Teixeiras maintain a regular physical activity, even if associated with the agricultural activities and/or locomotion.
In this sense, it should be highlighted the importance of acknowledging the heterogeneity of the population with regard to age groups and gender, besides the individual variance, when
analyzing the quality of life.
When analyzing the contribution of the different domains to the overall quality of life, we could observe that the contribution of the four domains together was 36.1%, and that the domains differed as to the individual contribution to the overall quality of life: the domain that contributed the most to the overall quality of life was the physical, followed by the environmental and the psychological domains; the social domain had no statistically significant difference. Therefore, the domains explain the overall quality of life with limitations; but changes in one or more domains may imply changes in the overall quality of life.
multidimensional interaction between physical and mental health, independence in the daily life, social integration, family support and economic independence.
In addition, the quality of life in old age has been associated with issues of independence and autonomy, and the dependence of the elderly person is a result of the biological changes (disabilities) and changes in the social demands.36
According to Covinsky et al.37 and Fassino et al.,38 the functional domain plays a major role in the multidimensional concept of quality of life, and it should be measured along with the health status when one wishes to assess the quality of life of the elderly.
The elderly well-being would thus be the result of the balance between several dimensions of functional ability, which does not mean absence of problems in all dimensions, considering that the well-being may be achieved by many, independently of the presence of diseases.39
In this study, the town under investigation has a predominantly agricultural activity, and 34.1% of the elderly assessed live in the rural area. In communities in which the rural and domestic activities prevail, the individuals have more opportunity to keep doing their work activities also in old age, and this continuity of occupational roles promote more life satisfaction.39
Another dimension to be considered must be the physical environment in which the elderly is inserted, once the environmental domain presented the second highest influence on the overall quality of life.
more chances to suffer from depression, and according to O’Shea,41 an adequate house and physical environment have a positive influence on the quality of life of the elderly.
As highlighted by Néri,42 the more active the elderly person, the higher their life satisfaction and, consequently, the better their quality of life. This is particularly important in communities such as the one assessed in this study, in which the work is predominantly agricultural and domestic, and can be done during the entire person’s life.
It should also be highlighted the family insertion of the elderly in multigenerational houses: living with relatives may offer benefits, in the sense of family support for the disabilities and dependence conditions, thus reducing the isolation, but it can also generate intergenerational conflicts, which end up by reducing the self-esteem and deteriorate the emotional status of the elderly, strikingly affecting the quality of life.43
Although the psychological domain had the less significant contribution to the quality of life of the elderly assessed in this study, and the social domain did not show a significant contribution, we have to consider the psychological and social insertion changes by which the elderly individuals go through, in order to minimize the effects of such changes resulting from the age on the quality of life of these subjects.5,7,8,40
According to Pereira,44 the subjective evaluations of the quality of life of the elderly should focus on what happens to the individual in the different aging stages, from physical changes to the social devaluation as a consequence of retirement, considering what is their feeling and
understanding of these situations, their psychological gains and losses, their frustrations and aspirations.
cognitive efficacy, social status, continuity of family and occupational roles, and continuity of informal relationships with friends.
Although the literature confirms the relevance of the social and psychological domains for the quality of life of the elderly, in our study these domains did not prove to be influential on the overall quality of life. This could be a consequence of the fact that the group under investigation may be going through the psychosocial changes of old age in a softer manner. The reason for that is that the loss of functional roles in the domestic and rural work may not take place along with retirement. Moreover, in the municipality studied, the short distance between the locations facilitates the locomotion and the gathering of individuals. As examples, we can cite the contact with the neighborhood, the use of horse carts and bicycles for transportation, even by the elderly people, and the participation in the third age group promoted by the FHP.
It is worth stressing the fact that the contribution of the four domains in the overall quality of life domain was moderate (36.1%) in our study, which could be considered a limiting factor. This may be explained by the fact that simple measures were used. For example, the overall domain was evaluated by only two questions; moreover, only the first two levels of Spilker’s model were measured, which means that the factors that compose each domain (third level) were not
discriminated. Furthermore, other important factors may also be contributing to the overall quality of life domain, which was also demonstrated by other studies found in the literature.15,16
According to Arnold et al.,15 the judgment each individual makes of his overall quality of life must be considered. Theoretically, the individual is expected to combine different aspects of his life and summarizes them in an overall evaluation of his quality of life; the point is whether the individuals really summarize everything, or whether they include only aspects that have recently worried them, or whether they exclude such aspects from the evaluation.
of the facts and events and is closely related to the subjective perception of the events and life conditions. The reduction of the vision, for instance, may not mean the same for two different individuals; the functional loss has a different emotional and social importance for each individual.39
As stressed by Rogerson,45 the interpretation of the overall quality of life evaluation is quite difficult, since similar results may be explained by different factors. For each individual, there is a form to operationalize his evaluation, and the evaluation of the same individual may vary after some time, due to the variation of priorities across life and the circumstances by which life can be
changed.
Therefore, the overall quality of life and the quality of life domains seem to be two different ways to evaluate the quality of life of the elderly. This is particularly important when designing a research, once the measure to be used will depend on the research objectives: to evaluate the quality of life as a whole (overall domain) or only some aspects of the quality of life (physical,
psychological, social and environmental domains).
Therefore, the present study showed that the four domains evaluated do not fully explain the variation of the overall quality of life domain. In this sense, we highlight the need of performing new studies, with the aim to verify that other factors may interfere with the overall quality of life of the elderly. In addition, longitudinal studies would be important to investigate whether the
contribution of the domains to the overall quality of life may be modified across time and/or in relation to the individual’s health status.
ACKNOWLEDGEMENT
REFERENCES
1. Organización Panamericana de la Salud. Las condiciones de salud en las Américas. Washington: OPS; 1994.
2. Instituto Brasileiro de Geografia e Estatística (IBGE). Dados preliminares do censo 2000. Disponível em: http://www.ibge.gov.br. Acessado mar 2006.
3. Garrido R, Menezes PR. O Brasil está envelhecendo: boas e más notícias por uma perspectiva epidemiológica. Rev Bras Psiquiatr. 2002;24(Supp1):3-6.
4. Palloni A, Peláez M. Histórico e natureza do estudo. In: Lebrão ML, Duarte YAO. SABE: saúde, bem-estar e envelhecimento. O Projeto SABE no município de São Paulo: uma abordagem inicial. Brasília: Organização Pan-Americana da Saúde; 2003. p. 13-32. 5. Chaimowicz F. A saúde dos idosos brasileiros às vésperas do século XXI: problemas,
projeções e alternativas. Rev Saude Publica. 1997;31(2):184-200.
6. Cotta RMM, Suarez-Varela MM, Cotta Filho JS, Llopis Gonzalez A, Dias Ricòs JA, Real ER. La hospitalización domiciliaria ante los cambios demográficos y nuevos retos de salud. Rev Panam Salud Publica. 2002;11(4):253-61.
7. Fleck MPA, Chachamovich E, Trentini CM. Projeto WHOQOL-OLD: método e resultados de grupos focais no Brasil. Rev Saude Publica. 2003;37(6):793-9.
8. Lebrão ML, Laurenti R. Condições de saúde. In: Lebrão ML, Duarte YAO. SABE: saúde, bem-estar e envelhecimento. O Projeto SABE no município de São Paulo: uma abordagem inicial. Brasília: Organização Pan-Americana da Saúde; 2003. p. 73-91.
9. Santos SR, Santos IBC, Fernandes MGM, Henriques MERM. Qualidade de vida do idoso na comunidade: aplicação da escala de Flanagan. Rev Latino-Am Enfermagem.
2002;10(6):757-64.
11. Gill T, Feisntein A. A critical appraisal of the quality of quality-of-life measurements. JAMA. 1994;272(8):619-26.
12. Fleck MPA, Leal OF, Louzada S, Xavier M, Chachamovich E, Vieira G, et al.
Desenvolvimento da versão em português do instrumento de avaliação de qualidade de vida da OMS (WHOQOL-100). Rev Bras Psiquiatr. 1999;21(1):19-28.
13. The WHOQOL Group. The development of the World Health Organization Quality of Life Assessment Instrument (the WHOQOL). In: Orley J, Kuyken W. Quality of life assessment: international perspectives. Heidelberg: Springer Verlag; 1994. p. 41-60.
14. Organización Mundial de la Salud. Promoción de la salud. Glosario. Genebra: OMS; 1998. 15. Arnold R, Ranchor AV, Sanderman R, Kempen GI, Ormel J, Suurmeijer TP. The relative
contribution of domains of quality of life to overall quality of life for different chronic diseases. Qual Life Res. 2004;13(5):883-96.
16. Suurmeijer TPBM, Reuvekamp MF, Aldenkamp BP. Social functioning, psychological functioning, and quality of life in epilepsy. Epilepsia. 2001;42(9):1160-8.
17. Programa das Nações Unidas para o Desenvolvimento (PNUD), Instituto de Pesquisa Econômica Aplicada (IPEA) e Fundação João Pinheiro (FJP). Atlas do desenvolvimento humano no Brasil – Índice de desenvolvimento humano municipal. Brasília:
PNUD/IPEA/FJP; 2003. Disponível em: http://www.ipea.gov.br/. Acessado mar 2006. 18. Fernandes AS, Seclen-Palacin J, org. Experiências e desafios da atenção básica e saúde da
família: caso Brasil. Brasília: Organização Pan-Americana da Saúde; 2004. 19. Hwang HF, Liang WM, Chiu YN, Lin MR. Suitability of the WHOQOL-Bref for
community-dwelling older people in Taiwan. Age Ageing. 2003;32(6):593-600.
20. Fleck MPA, Louzada S, Xavier M, Chachamovich E, Vieira G, Santos L, et al. Aplicação da versão em português do instrumento abreviado de avaliação da qualidade de vida
21. Norusis JM/SPSS Inc. SPSS for Windows-based system user’s guide release 9.0. Chicago: SPSS Inc.; 1992.
22. Sprangers MA, de Regt EB, Andries F, van Agt HM, Bijl RV, de Boer JB, et al. Which chronic conditions are associated with better or poorer quality of life? J Clin Epidemiol. 2000;53(9):895-907.
23. Instituto Brasileiro de Geografia e Estatística (IBGE). Síntese de indicadores sociais 2004. Rio de Janeiro: IBGE; 2005.
24. Paes de Barros R, Mendonça R, Santos D. Incidência e natureza da pobreza entre idosos no Brasil. Rio de Janeiro: IPEA; 1999. (Texto para Discussão nº 686.)
25. Jakobsson U, Hallberg IR, Westergren A. Overall and health related quality of life among the oldest old in pain. Qual Life Res. 2004;13(1):125-36.
26. Sherbourne CD, Meredith LS, Rogers W, Ware JE Jr. Social support and stressful life events: age differences in their effects on health related quality of life among chronically ill. Qual Life Res. 1992;1(4):235-46.
27. Lima AFBS. Qualidade de vida em pacientes do sexo masculino dependentes de álcool [dissertação]. Porto Alegre: Universidade Federal do Rio Grande do Sul; 2002.
28. del Pino ACS. Calidad de vida en la atención al mayor. Rev Mult Gerontol. 2003;13(3):188-92.
29. Avis NE, Assmann SF, Kravitz HM, Ganz PA, Ory M. Quality of life in diverse groups of midlife women: assessing the influence of menopause, health status and psychosocial and demographic factors. Qual Life Res. 2004;13(5):933-46.
30. Thome B, Dykes AK, Hallberg IR. Quality of life in old people with and without cancer. Qual Life Res. 2004;13(6):1067-80.
32. Michelson H, Bolund C, Brandberg Y. Multiple chronic health problems are negatively associated with health-related quality of life (HRQoL) irrespective of age. Qual Life Res. 2001;9(10):1093-104.
33. Osborne RH, Hawthorne G, Lew EA, Gray LC. Quality of life assessment in the community-dwelling elderly: validation of the Assessment of Quality of Life (AQOL) instrument and comparison with the SF-36. J Clin Epidemiol. 2003;56(2):138-47. 34. Heinonen H, Aro AR, Aalto AM, Uutela A. Is the evaluation of the global quality of life
determined by emotional status? Qual Life Res. 2004;13(8):1347-56.
35. Ramos LR. Fatores determinantes do envelhecimento saudável em idosos residentes em centro urbano: Projeto Epidoso, São Paulo. Cad Saude Publica. 2003;19(3):793-8. 36. Sousa L, Galante H, Figueiredo D. Qualidade de vida e bem-estar dos idosos: um estudo
exploratório na população portuguesa. Rev Saude Publica. 2003;37(3):364-71.
37. Covinsky KE, Wu AW, Landefeld CS, Connors AF Jr, Phillips RS, Tsevat J, et al. Health status versus quality of life in older patients: does the distinction matter? Am J Med. 1999;106(4):435-40.
38. Fassino S, Leombruni P, Abbate Daga G, Brustolin A, Rovera GG, Fabris F. Quality of life in dependent older adults living at home. Arch Gerontol Geriatr. 2002;35(1):9-20.
39. Xavier FM, Ferraz MP, Marc N, Escosteguy NU, Moriguchi EH. Elderly people’s definition of quality of life. Rev Bras Psiquiatr. 2003;25(1):31-9.
40. Organización Mundial de la Salud. Salud y envejecimiento: un documento para el debate. Versión preliminar. 2001;4:40. (Boletín sobre el Envejecimiento: Perfiles y Tendencias.) 41. O’Shea E. La mejora de la calidad de vida de las personas mayores dependientes. 2003;6:34.
(Boletín sobre el Envejecimiento: Perfiles y Tendencias.)
42. Neri AL. Qualidade de vida e idade madura. Campinas: Papirus; 1993.
44. Pereira DEC. Qualidade de vida na terceira idade e sua relação com o trabalho no grupo de terceira idade “Amor e Carinho” de Santa Terezinha de Itaipu – PR [dissertação].
Florianópolis: Universidade Federal de Santa Catarina; 2002.
45. Rogerson RJ. Environmental and health related quality of life: conceptual and methodological similarities. Soc Sci Med. 1995;41(10):1373-82.
ABSTRACT
This study investigated the contribution of each quality of life domain (physical, social, psychological and environmental) in the overall quality of life and how these domains explain the overall quality of life of elderly people resident in the city of Teixeiras, Southeastern Brazil. It is a cross-sectional observational study, random sampling stratified by gender, Family Health Program use and health micro-region (n = 211 individuals aged 60 or over), representing 14.28% of elderly people in the total municipality in study. The World Health Organization Quality of Life Instrument (WHOQOL-Bref) was used to assess the quality of life; it was applied by only one well trained interviewer. Linear regression analyses showed that none of the sociodemographic variables interfered significantly in the overall quality of life domain and, among the four domains, physical was the one that best explained the overall quality of life, followed by the environmental and psychological domains. The social domain did not show significant contribution to the overall quality of life. The possible explanations for the results were discussed.
Keywords: Aging, elderly people’s health, quality of life, WHOQOL-Bref.
Title: Contribution of the physical, social, psychological and environmental domains to
overall quality of life of the elderly
Correspondence:
Departamento de Nutrição e Saúde
Avenida P. H. Rolfs s/nº – Campus Universitário CEP 36570-000 – Viçosa – MG – Brazil