ISSN 0975-928X
Research Note
Performance of sorghum mutant lines for yield and quality of fodder under
Udaipur conditions
Jogendra Singh and Lata Chaudhary
Department of Plant Breeding and Genetics, Rajasthan College of Agriculture,
Maharana Pratap University of Agriculture and Technology, Udaipur-313001 (Rajasthan) Email: [email protected]
(Received: 22 April 2014; Accepted: 04 Sep 2014)
Abstract
An investigation was carried out with multicut forage sorghum variety SSG 59-3 and its 15 mutants derived from gamma irradiation to identify the superior mutant genotypes for high fodder yield and quality in sorghum. Differences among the genotypes were found significant for all the quality traits and most of the yield traits studied at different cut(s). The mutant genotypes SSG 226 was the best performer for both quality and fodder yield and, another two mutant genotypes SSG 231 and SSG 222 was also good for fodder yield and quality, respectively but it perform poorer for vice-versa. The genotype SSG 226 produced green fodder yield (3.33, 1.52 and 0.95 g/plant/day) and dry fodder yield (1.03, 0.61 and 0.42 g/plant/day) at first, second and third cuts, respectively with crude protein (8.18) along with desirable lowest crude fibre (30.60) and highest ash content (8.39) at first cut. Taking a better variety in respect to fodder yield and nutritional contents, the genotype SSG 226 should be preferred over the tested mutant genotypes for forage purpose.
Keywords
Sorghum, Mutant lines, Multicut forage type.
Availability of adequate quantity of quality feed and fodder for livestock is essential for sustaining the livestock productivity. Due to increasing pressure on land for growing food grains, oil seeds, and pulses, fodder production generally gets lower priority. With about 2.29% share of the land area of the world, India is maintaining about 10.71% world’s livestock (State of Indian Agriculture, 2012-13). Further, inadequate production and availability of improved fodder seeds, diverse uses of agriculture crop residues (paper industry, packaging, etc.), area has been declined under coarse cereals which are also used as feed for last 30 years, a substantial amount of crop residues is burnt by the farmers after harvesting the main crops like wheat and paddy, subsequently, the gap between the demand and supply of fodder is increasing. Fodder and feeds are the major inputs in animal production especially in milch animals, which account for about 60 to 70 per cent of total cost of milk production. The present availability of green fodder is about 513 million tonnes projecting a deficit of 53 per cent and that of dry fodder is around 400 million tonnes against the requirement of 676 million tonnes (Mukherjee et al., 1998). At present, fodder is being cultivated only on 4% of grossed cropped area, which is not adequate to meet the requirement of the livestock (State of Indian Agriculture, 2012-13).
The forage crops are the cheapest source of animals feed and therefore, taken as foundation of livestock industry. The demand for livestock products is continuously rising due to their regular use in human diets. It has been estimated that need for forage crops upto 2050 will increase two to three
folds in Asian countries (Devendra and Leng, 2011). To overcome such situation, genetically stable genotypes having good nutritional value and high fodder yield potential are urgently needed. Sorghum fodder plays an important role in the health and nutrition of the large population of livestock in the country by providing nutritive fodder. Sorghum is an important crop widely grown for grain and fodder with a greater emphasis on fodder particularly in semi-arid tracts. Sorghum produces a tonnage of dry matter having proportions of digestible nutrients (50%), crude protein (8%), fat (2.5%) and nitrogen free extracts (45%) (Azam et al., 2010). It can be used fresh as well as stored in form of silage and hay for future use. As a result of crop improvement programme, a number of promising strains of plants with diversified morphological and quality traits are available for general cultivation (Hussain et al., 1995). The changes in genetic material of crops resulted wide variations in the morphological and forage quality traits (Alias et al., 2010 and Ullah et al., 2007). Therefore, genetic improvement of crop is basically aimed to enable the crop to survive in environmental vagaries. The planned study was conducted with the objective to understand the response of mutant lines under the Udaipur conditions and identification of suitable mutant line for growing under such conditions and even some of the mutant lines may be used in the breeding programme for some specific traits for further development of suitable genotypes for high quality forage production.
ISSN 0975-928X
during summer-2010 at Instructional Farm of Rajasthan College of Agriculture, MPUAT, Udaipur (Rajasthan). Udaipur is situated at South-Eastern part of Rajasthan at an altitude of 579.5 metre above mean sea level and at 24º 35 N latitude and 74º 42 E longitude. The region falls under agro-climatic zone IV a (Sub- humid Southern Plain and Aravalli Hills) of Rajasthan. The experiment was conducted during 24 May to 21 October, 2010 on clay loam soil under irrigated conditions. The experimental material comprised of 15 mutant lines in M5 generation, viz., SSG 222,
SSG 224, SSG 225, SSG 226, SSG 227, SSG 231, SSG 232, SSG 233, SSG 234, SSG 236, SSG 241, SSG 244, SSG 253, SSG 256 and SSG 263 obtained through the use of gamma-rays, along with its parent SSG 59-3 (a popular variety of multicut forage sorghum), were planted in randomized block design with three replications. Each genotype had four rows of 4m length with 25cm row to row and 15cm plant to plant spacing. The recommended cultural practices were adopted for raising the good crop. The observations were recorded for 14 different characters at different cut (s) on five randomly selected plants for each genotype in each replication.
Observations on green fodder yield and related components were recorded at 60 days after sowing (DAS) during first cut, 45 days after first cut (DAFC) during second cut and 45 days after second cut (DASC) during third cut while number of tillers per plant was recorded at cutting stage of only second and third cuts. Quality parameters viz., crude protein, crude fibre, ether extract, nitrogen free extract, ash and TDN were estimated from dry fodder at first cut only, while N content in plants were estimated from dry fodder from all the three cuts. Besides, HCN content in plants was calculated at 30 DAS, 30 DAFC and 30 DASC, respectively using Picric acid method given by Hogg and Ahlgren (1942). Fresh plant samples of the various genotypes were collected from each replication and evaluated for the nitrogen content and remaining forage quality parameters (crude protein, crude fibre, nitrogen free extracts, ether extract and total ash). The plant samples were chopped mixed thoroughly and grind to fine powder and were divided into three groups for estimations of the following quality components by using proximate analysis (AOAC, 1996). The data recorded were subjected to analysis of variance (Steel et al. 1997) for the mentioned characteristics to determine the significance of differences among genotypes.
The analysis of variance revealed significant differences among the genotypes for all the quality traits and most of the morphological and yield traits
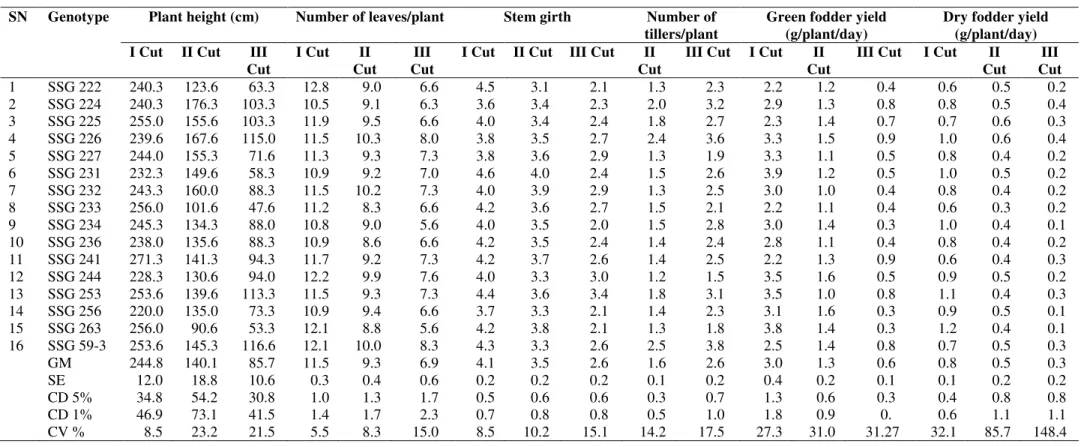
studied at different cut(s). The mean values for morphological characters are presented in Table 1.
Plantheight(cm) The difference among the genotypes with respect to the plant height was significant at third cut only while it was non-significant at first and second cut. The average plant height was 244.83 cm at first cut, 140.17 cm at second cut and 85.77 cm at third cut. At third cut, maximum plant height was observed in check SSG 59-3 (116.67) followed by SSG 226 (115.00) and SSG 253 (113.33). The earlier studies conducted by Nabi et al. (2006), Ayub et al. (2010), Al-Din et al. (2012), Ayub et al. (2012), Ghasemi et al. (2012), Naim et al. (2012), Seetharam and Ganesamurthy (2013) and Singh et al. (2013) for sorghum cultivars also supported our findings for plant height. Singh et al. (2013) reported earlier that higher plant height enhances the fodder yield it means selection for that trait may be considered to improve the fodder yield.
Number of leaves per plant The difference among the genotypes with respect to the number of leaves per plant was significant at first cut only while it was non-significant at second and third cut. The average number of leaves was 11.52 at first cut, 9.35 at second cut and 6.96 at third cut. Data from first cut revealed that maximum number of leaves was observed in SSG 222 (12.80) followed by SSG 244 (12.20) while SSG 263 was equal to check SSG 59-3 (12.13) for number of leaves. The significant differences among sorghum cultivars has also been previously reported by Nabi et al. (2006), Ayub et al. (2012), Seetharam and Ganesamurthy (2013) and Singh et al. (2013) which probably due to genetic make of genotypes under investigation.
Stem girth (cm) The difference among the genotypes with respect to the stem girth was significant at third cut only while it was non-significant at first and second cut. The average values of stem girth were 4.13 cm at first cut, 3.56 cm at second cut and 2.60 cm at third cut. At third cut, highest stem girth values were obtained from the SSG 253 (3.47) followed by SSG 244 (3.00), SSG 227 (2.95) and SSG 232 (2.93). Thinnest stem was observed in SSG 234 (2.07). Our results for stem diameter has also been confirmed by the findings of Nabi et al. (2006), Ayub et al. (2012), Ghasemi et al. (2012), Seetharam and Ganesamurthy (2013) and Singh et al. (2013) where a range of stem diameter was observed for sorghum cultivars.
ISSN 0975-928X
1.64 at second cut and 2.62 cm at third cut. Maximum number of tillers produced by check SSG 59-3 (2.55 and 3.89) followed by SSG 226 (2.44 and 3.66) at second and third cut, respectively. Lowest tillers number was found in SSG 244 at both the cuts. Our result has also been confirmed by the findings of Ghasemi et al. (2012) and Singh et al. (2013) for tiller number in sorghum. Singh et al. (2013) reported earlier that if we increase in tillers number than fodder yield also increase, it means selection for that trait have important to improve the fodder yield also.
Green fodder yield per plant per day (g) The difference among the genotypes with respect to the green fodder yield per plant per day was significant at third cut only while it was non-significant at first and second cut. The average values of green fodder yield per plant per day were 3.02 g at first cut, 1.32 g at second cut and 0.60 g at third cut. At third cut, green fodder yield varied from 0.30 (SSG 263) to 0.95 (SSG 226) g. Besides, three other genotypes SSG 241 (0.90), SSG 224 and SSG 253 (0.89) also showed higher yield than check SSG 59-3 (0.81). The significant differences in green forage yield among sorghum cultivars have also been undertaken by Chughtai et al. (2007), Ayub et al. (2012), Ghasemi et al. (2012) and Singh et al. (2013).
Dry fodder yield per plant per day (g) The difference among the genotypes with respect to the dry fodder yield per plant per day was non-significant at all the three cuts. The average values of dry fodder yield per plant per day were 0.74 g at first cut, 0.51 g at second cut and 0.33 g at third cut. The significant variations among sorghum genotypes for dry matter production have already been reported in studies conducted by Yousef et al. (2009), Ayub et al. (2012), Ghasemi et al. (2012) and Singh et al. (2013).
Quality parameters The differences among the genotypes with respect to all quality parameters were significant at different cut (s) as these were studied.
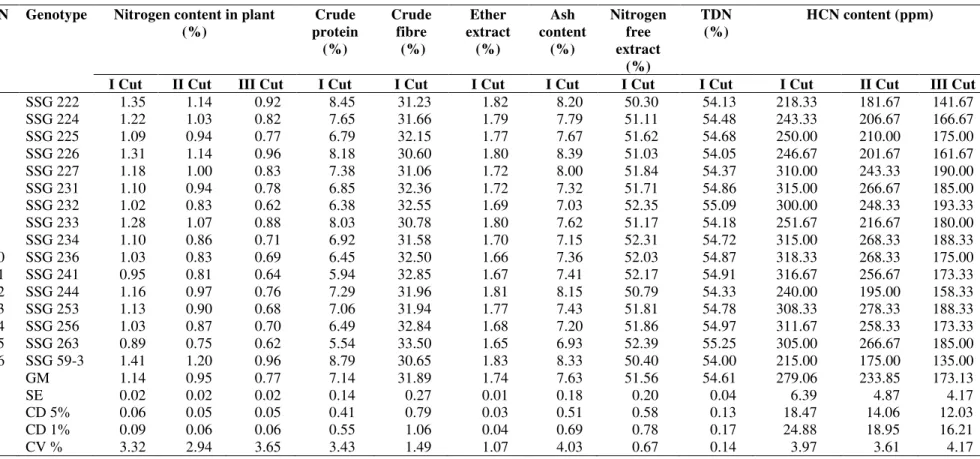
Nitrogen content in plant (%) As shown in Table-2, the difference among the genotypes with respect to the nitrogen content in dry fodder was significant at all the three cuts. The average values of nitrogen content in plant were 1.14 at first cut, 0.95 at second cut and 0.77 at third cut. At first cut, the maximum nitrogen content in plant was exhibited by check SSG 59-3 (1.41) followed by SSG 222 (1.35), SSG 226 (1.31) and SSG 233 (1.28) while minimum value was observed in SSG 263 (0.89). Data from second cut revealed that the maximum nitrogen content in plant was observed in check SSG 59-3 (1.20) followed by SSG 222 and SSG
226 (1.14) while minimum value showed in SSG 263 (0.75). At third cut, the maximum nitrogen content was exhibited in check SSG 59-3 and SSG 226 (0.96) followed by SSG 222 (0.92) and SSG 233 (0.88) while minimum N content was recorded in SSG 232 and SSG 263 (0.62). Similar results were founded by Singh et al. (2013) in sorghum.
Crude protein (%) Data from first cut (Table-2) revealed that average value of crude protein in dry fodder was 7.14 % and check SSG 59-3 exhibited maximum crude protein (8.79) followed by SSG 222 (8.45), SSG 226 (8.18) and SSG 233 (8.03) while minimum value was observed in SSG 263 (5.54). The higher protein contents in dry matter ultimately will result higher protein yield on unit area. The significant differences in crude protein contents in dry matter of various genotypes have also been confirmed by Nabi et al. (2006), Tauqir et al. (2009), Ayub et al. (2012), Bibi et al. (2012) and Singh et al. (2013). The difference among genotype may be due to relative contribution of leaves to total biomass and concentration of protein in dry matter.
Crude fibre (%) Data from first cut (Table-2) revealed that the average value of crude fibre content in dry fodder was 31.89 %. Desirable lower value was observed in SSG 226 (30.60) followed by check SSG 59-3 (30.65) and SSG 233 (30.78) while, maximum values were observed in SSG 263 (33.50). The significant differences among sorghum genotypes for crude fibre have already been confirmed by studies conducted by Nabi et al. (2006), Ayub et al. (2012), Bibi et al. (2012) and Singh et al. (2013).
Ether extract (%) Data from first cut (Table-2) revealed that the average value of ether extract in dry fodder was 1.74 %. Maximum ether extract was calculated in check SSG 59-3 (1.85) followed by SSG 222 (1.82), SSG 244 (1.81), SSG 226 and SSG 233 (1.80) while, minimum value was observed in SSG 263 (1.65). Similar results were founded by Bibi et al. (2012) and Singh et al. (2013) in sorghum.
ISSN 0975-928X
Nitrogen free extract (%) Data from first cut (Table-2) revealed that the average value of nitrogen free extract in dry fodder was 51.56 %. Desirable minimum value of nitrogen free extract was observed in SSG 222 (50.30) followed by check SSG 59-3 (50.40) and SSG 244 (50.79). Maximum values were observed in SSG 263 (52.39). Similar results were founded by Bibi et al. (2012) and Singh et al. (2013) in sorghum.
TDN (%) Data from first cut (Table-2) revealed that the average value of TDN content was 54.61 %. Maximum TDN content was observed in SSG 263 (55.25) followed by SSG 232 (55.09), SSG 256 (54.97) and SSG 241 (54.91) while, it was minimum in check SSG 59-3 (54.00). It means all the genotypes studied were found better than check for TDN content. Similar results were founded by Singh et al. (2013) in sorghum.
HCN content (ppm) As shown in Table-3, the difference among the genotypes with respect to the HCN content was significant at all the three cuts. The average values of HCN content were 279.06 at first cut, 233.85 at second cut and 173.13 at third cut. The desirable lower value was observed in check SSG 59-3 followed by SSG 222 and SSG 244 during all the three cuts. Maximum value exhibited by SSG 236 (318.33) at first cut, SSG 253 (278.33) at second cut and SSG 232 (193.33) at third cut. Similar results were founded by Singh et al. (2013) in sorghum.
The genetic variations in genotypes induced significant changes in morphological and yield traits. The data also suggested that new genotypes have potential to serve the forage purposes. Under the light of present study, the mutant genotypes SSG 226 is recommended for approval for general cultivation as it has better performance for fresh and dry matter yield. Furthermore, the variety SSG 226 appears to be leafier and therefore its dry matter has the best nutritional value. Besides, two mutant genotypes SSG 231 and SSG 222 was also good for fodder yield and quality, respectively but it perform poorer for vice-versa. The future research should be to create more variability of check variety SSG 59-3 though inter-mating of these mutant lines specifically SSG 226, SSG 231 and SSG 222 to improve yield potential and nutritive value of forage sorghum.
References
Alam, M.S., Rahman, A.R.M.S. and Khair, A.B.M.A. Al-Din A.A., Hessein E.M. and Ali E.A. 2012 Path coefficient assessment of yield and yield associated traits in sorghum (Sorghum bicolour L.) genotypes. Am-Euras. J. Agric. & Environ. Sci., 12(6): 815-819.
Alias M.A., Bukhsh H.A., Ahmad R., Malik A.U., Hussain S. and Ishaque M. 2010 Agro-physiological traits of three maize hybrids as influenced by varying plant density. The J. Anim. Pl. Sci. 20(1): 34-39.
Anonymous 13 State of Indian Agriculture, 2012-13, p157.
A.O.A.C. 1975 Official method of analysis. 12th Ed. Association of Official Analytical Chemical, Washington, D. C.
Ayub, M., Nadeem M., Thir M., Ahmed Z. and Naeem M. 2010. Evaluation of some forage sorghum varieties under the condition of central region, Saudi Arabia. Annals Agric. Sci. Ainshams Univ., Cairo, 39(2): 649-654.
Ayub, M., Khalid M., Tariq M., Elahi M. and Nadeem M.A. 2012. Comparision of sorghum genotypes for forage production and quality. J. Anim. Plant Sci., 22(3): 733-737.
Azam, M., Waraich E.A., Pervaiz A., and Nawaz F. 2010. Response of a newly developed fodder sorghum (Sorghum bicolor L. Monech) variety (F-9917) to NPK application. Pakistan J. Life Soc. Sci. 8(2): 117-120.
Bibi A., Sadaqat H.A., Tahir M.H.N., Usman B.F. and Ali B. 2012. Genetic analysis of forage quality traits in sorghum-sudangrass hybrids under water stress. J. Anim. Plant Sci., 22(4): 1092-1100.
Chughtai, S.R., Fateh J., Munawwar M.H., and Hussain M. 2007. Participatory sorghum varietal evaluation and selection in Pakistan. Pakistan J. Agric. Res. 55: 19-26.
Devendra, C., and Leng R.A. 2011. Feed resources for animals in Asia: issues, strategies for use, intensification and integration for increased productivity. Asian-Aust. J. Anim. Sci. 24 (3): 303 – 321.
Ghasemi A., Karim M.H. and Ghasemi M.M. 2012. Green fodder yield performance of different varieties of sorghum grown in an arid region. Intl. J. Agri. Crop Sci., 4(13): 839-843. Hogg P.G. and Ahlgren H.L. 1942. A rapid method for
determining HCN content of single plant of sudan grass. J. Americ. Soc. Agron., 43: 199-200.
Hussain, A., Muhammad D., Khan S., and Bhatti M.B. 1995. Performance of various cultivars of forage sorghum under rainfed conditions. J. Agric. Res. 33: 413-418.
Mukherjee A.K., Malti S. and Nanda M.R. 1998 Strategy for maximization of forage production. Proc. National Seminar on Strategy for maximization of forage production by 2000A.D. held at `BCKV. West Bengal. pp. 5-7.
Nabi, C.G., Riaz M. and G. Ahmed 2006. Comparison of some advanced lines of Sorghum bicolour L. Monech for green fodder/dry matter yield and morpho economical parameters. J. Agric. Res. 44: 191-196.
Naim A.M.E., Ibrahim I.M., Rahman M.E.A. and Ibrahim E.A. 2012. Evaluation of some local sorghum (Sorghum bicolour L.Moench) genotypes in rainfed. Intl J. Pl. Res., 2(1): 15-20.
ISSN 0975-928X
yield and other agronomic traits through genetic variability and diversity analysis. Electron. J. Plant Breeding, 4(1): 1073-1079. Singh J., Ranwah B.R., Chaudhary L., Lal C., Dagla
M.C. and Kumar V. 2013. Evaluation for genetic variability, correlation and path coefficient in mutant population of forage sorghum (Sorghum bicolor L. Moench). The Bioscan, 8(4): 1471-1476.
Steel, R.G.D., Torrie J. H. and Dickey D.A. 1997. Principles and Procedures of Statistics. A biometrical approach. 3rd Ed. McGraw Hill, Inc. Book Co. N.Y. (U.S.A.):352-358. Tauqir, N.A., Sarwar M., Jabbar M.A., and Mahmood S.
2009. Nutritive value of jumbo grass (Sorghum bicolour sorghum sudanefe) silage in lactating nili- ravi buffaloes. Pakistan Vet. J. 29: 5-10. Ullah, A., Khan A.A., Nawab K., Khan A. and Islam B.
2007. Growth characters and fodder production potential of sorghum varieties under irrigated conditions. Sarhad J. Agric. 23(2):265- 268. Yousef E., Carmi A., Nikbachat M., Zenou A., Umiel N.
ISSN 0975-928X
Table 1. Mean values of green and dry fodder yield traits at different cut(s) in forage sorghum.
SN Genotype Plant height (cm) Number of leaves/plant Stem girth Number of
tillers/plant
Green fodder yield (g/plant/day)
Dry fodder yield (g/plant/day)
I Cut II Cut III
Cut
I Cut II
Cut
III Cut
I Cut II Cut III Cut II
Cut
III Cut I Cut II
Cut
III Cut I Cut II
Cut
III Cut
1 SSG 222 240.3 123.6 63.3 12.8 9.0 6.6 4.5 3.1 2.1 1.3 2.3 2.2 1.2 0.4 0.6 0.5 0.2
2 SSG 224 240.3 176.3 103.3 10.5 9.1 6.3 3.6 3.4 2.3 2.0 3.2 2.9 1.3 0.8 0.8 0.5 0.4
3 SSG 225 255.0 155.6 103.3 11.9 9.5 6.6 4.0 3.4 2.4 1.8 2.7 2.3 1.4 0.7 0.7 0.6 0.3
4 SSG 226 239.6 167.6 115.0 11.5 10.3 8.0 3.8 3.5 2.7 2.4 3.6 3.3 1.5 0.9 1.0 0.6 0.4
5 SSG 227 244.0 155.3 71.6 11.3 9.3 7.3 3.8 3.6 2.9 1.3 1.9 3.3 1.1 0.5 0.8 0.4 0.2
6 SSG 231 232.3 149.6 58.3 10.9 9.2 7.0 4.6 4.0 2.4 1.5 2.6 3.9 1.2 0.5 1.0 0.5 0.2
7 SSG 232 243.3 160.0 88.3 11.5 10.2 7.3 4.0 3.9 2.9 1.3 2.5 3.0 1.0 0.4 0.8 0.4 0.2
8 SSG 233 256.0 101.6 47.6 11.2 8.3 6.6 4.2 3.6 2.7 1.5 2.1 2.2 1.1 0.4 0.6 0.3 0.2
9 SSG 234 245.3 134.3 88.0 10.8 9.0 5.6 4.0 3.5 2.0 1.5 2.8 3.0 1.4 0.3 1.0 0.4 0.1
10 SSG 236 238.0 135.6 88.3 10.9 8.6 6.6 4.2 3.5 2.4 1.4 2.4 2.8 1.1 0.4 0.8 0.4 0.2
11 SSG 241 271.3 141.3 94.3 11.7 9.2 7.3 4.2 3.7 2.6 1.4 2.5 2.2 1.3 0.9 0.6 0.4 0.3
12 SSG 244 228.3 130.6 94.0 12.2 9.9 7.6 4.0 3.3 3.0 1.2 1.5 3.5 1.6 0.5 0.9 0.5 0.2
13 SSG 253 253.6 139.6 113.3 11.5 9.3 7.3 4.4 3.6 3.4 1.8 3.1 3.5 1.0 0.8 1.1 0.4 0.3
14 SSG 256 220.0 135.0 73.3 10.9 9.4 6.6 3.7 3.3 2.1 1.4 2.3 3.1 1.6 0.3 0.9 0.5 0.1
15 SSG 263 256.0 90.6 53.3 12.1 8.8 5.6 4.2 3.8 2.1 1.3 1.8 3.8 1.4 0.3 1.2 0.4 0.1
16 SSG 59-3 253.6 145.3 116.6 12.1 10.0 8.3 4.3 3.3 2.6 2.5 3.8 2.5 1.4 0.8 0.7 0.5 0.3
GM 244.8 140.1 85.7 11.5 9.3 6.9 4.1 3.5 2.6 1.6 2.6 3.0 1.3 0.6 0.8 0.5 0.3
SE 12.0 18.8 10.6 0.3 0.4 0.6 0.2 0.2 0.2 0.1 0.2 0.4 0.2 0.1 0.1 0.2 0.2
CD 5% 34.8 54.2 30.8 1.0 1.3 1.7 0.5 0.6 0.6 0.3 0.7 1.3 0.6 0.3 0.4 0.8 0.8
CD 1% 46.9 73.1 41.5 1.4 1.7 2.3 0.7 0.8 0.8 0.5 1.0 1.8 0.9 0. 0.6 1.1 1.1
ISSN 0975-928X
Table 2. Mean values of quality traits at different cut(s) in forage sorghum.
SN Genotype Nitrogen content in plant
(%)
Crude protein
(%)
Crude fibre (%)
Ether extract
(%)
Ash content
(%)
Nitrogen free extract
(%)
TDN (%)
HCN content (ppm)
I Cut II Cut III Cut I Cut I Cut I Cut I Cut I Cut I Cut I Cut II Cut III Cut
1 SSG 222 1.35 1.14 0.92 8.45 31.23 1.82 8.20 50.30 54.13 218.33 181.67 141.67
2 SSG 224 1.22 1.03 0.82 7.65 31.66 1.79 7.79 51.11 54.48 243.33 206.67 166.67
3 SSG 225 1.09 0.94 0.77 6.79 32.15 1.77 7.67 51.62 54.68 250.00 210.00 175.00
4 SSG 226 1.31 1.14 0.96 8.18 30.60 1.80 8.39 51.03 54.05 246.67 201.67 161.67
5 SSG 227 1.18 1.00 0.83 7.38 31.06 1.72 8.00 51.84 54.37 310.00 243.33 190.00
6 SSG 231 1.10 0.94 0.78 6.85 32.36 1.72 7.32 51.71 54.86 315.00 266.67 185.00
7 SSG 232 1.02 0.83 0.62 6.38 32.55 1.69 7.03 52.35 55.09 300.00 248.33 193.33
8 SSG 233 1.28 1.07 0.88 8.03 30.78 1.80 7.62 51.17 54.18 251.67 216.67 180.00
9 SSG 234 1.10 0.86 0.71 6.92 31.58 1.70 7.15 52.31 54.72 315.00 268.33 188.33
10 SSG 236 1.03 0.83 0.69 6.45 32.50 1.66 7.36 52.03 54.87 318.33 268.33 175.00
11 SSG 241 0.95 0.81 0.64 5.94 32.85 1.67 7.41 52.17 54.91 316.67 256.67 173.33
12 SSG 244 1.16 0.97 0.76 7.29 31.96 1.81 8.15 50.79 54.33 240.00 195.00 158.33
13 SSG 253 1.13 0.90 0.68 7.06 31.94 1.77 7.43 51.81 54.78 308.33 278.33 188.33
14 SSG 256 1.03 0.87 0.70 6.49 32.84 1.68 7.20 51.86 54.97 311.67 258.33 173.33
15 SSG 263 0.89 0.75 0.62 5.54 33.50 1.65 6.93 52.39 55.25 305.00 266.67 185.00
16 SSG 59-3 1.41 1.20 0.96 8.79 30.65 1.83 8.33 50.40 54.00 215.00 175.00 135.00
GM 1.14 0.95 0.77 7.14 31.89 1.74 7.63 51.56 54.61 279.06 233.85 173.13
SE 0.02 0.02 0.02 0.14 0.27 0.01 0.18 0.20 0.04 6.39 4.87 4.17
CD 5% 0.06 0.05 0.05 0.41 0.79 0.03 0.51 0.58 0.13 18.47 14.06 12.03
CD 1% 0.09 0.06 0.06 0.55 1.06 0.04 0.69 0.78 0.17 24.88 18.95 16.21