Identifying Human Genome-Wide CNV, LOH
and UPD by Targeted Sequencing of Selected
Regions
Yu Wang1,2☯
*, Wei Li2☯, Yingying Xia2,5☯, Chongzhi Wang2☯, Y. Tom Tang2,4☯, Wenying Guo3, Jinliang Li2, Xia Zhao2, Yepeng Sun2, Juan Hu2, Hefu Zhen2, Xiandong Zhang2, Chao Chen2, Yujian Shi2, Lin Li2, Hongzhi Cao2,6, Hongli Du1*, Jian Li2,6*
1School of Bioscience and Bioengineering, South China University of Technology, Guangzhou, China, 2BGI-Shenzhen, Shenzhen, China,3Weifang Hospital of Traditional Chinese Medicine, Weifang, Shandong, China,4Complete Genomics, Inc., 2071 Stierlin Court, Mountain View, California, 94043, United States of America,5School of Life Sciences, Sun Yat-sen University, Guangzhou, China,6University of Copenhagen, Department of Biology, Copenhagen, Denmark
☯These authors contributed equally to this work.
*[email protected](YW); [email protected](HD);[email protected](JL)
Abstract
Copy-number variations (CNV), loss of heterozygosity (LOH), and uniparental disomy (UPD) are large genomic aberrations leading to many common inherited diseases, cancers, and other complex diseases. An integrated tool to identify these aberrations is essential in understanding diseases and in designing clinical interventions. Previous discovery methods based on whole-genome sequencing (WGS) require very high depth of coverage on the whole genome scale, and are cost-wise inefficient. Another approach, whole exome ge-nome sequencing (WEGS), is limited to discovering variations within exons. Thus, we are lacking efficient methods to detect genomic aberrations on the whole genome scale using next-generation sequencing technology. Here we present a method to identify genome-wide CNV, LOH and UPD for the human genome via selectively sequencing a small portion of genome termed Selected Target Regions (SeTRs). In our experiments, the SeTRs are covered by 99.73%~99.95% with sufficient depth. Our developed bioinformatics pipeline calls genome-wide CNVs with high confidence, revealing 8 credible events of LOH and 3 UPD events larger than 5M from 15 individual samples. We demonstrate that genome-wide CNV, LOH and UPD can be detected using a cost-effective SeTRs sequencing approach, and that LOH and UPD can be identified using just a sample grouping technique, without using a matched sample or familial information.
Introduction
Copy-number variations (CNV)[1]and loss of heterozygosity (LOH)[2] are different types of genomics aberrations. CNV is defined as a variation from the reference genome by a more than 1Kbp DNA segment, either via duplication or deletion[3]. LOH is manifested by unusual OPEN ACCESS
Citation:Wang Y, Li W, Xia Y, Wang C, Tang YT, Guo W, et al. (2015) Identifying Human Genome-Wide CNV, LOH and UPD by Targeted Sequencing of Selected Regions. PLoS ONE 10(4): e0123081. doi:10.1371/journal.pone.0123081
Academic Editor:Kelvin Yuen Kwong Chan, Hospital Authority, CHINA
Received:July 21, 2014
Accepted:February 27, 2015
Published:April 28, 2015
Copyright:© 2015 Wang et al. This is an open access article distributed under the terms of the
Creative Commons Attribution License, which permits unrestricted use, distribution, and reproduction in any medium, provided the original author and source are credited.
Data Availability Statement:All relevant data are within the paper and its Supporting Information files. The ICLU pipeline is implemented in Perl script and can be freely downloaded athttp://soap.genomics. org.cn/ICLU.html. 8 alignment results of real samples were uploaded to this web as well. They can be used as test cases.
Funding:The authors have no support or funding to report.
long stretches of homozygous SNPs. When a LOH occurs without a change in copy number (CN), i.e. that both copies are inherited from only one parent, it is called copy-neutral LOH, or uniparental disomy (UPD)[4,5]. CNV, LOH, and UPD are important factors leading to many common inherited diseases, cancers, and other complex diseases[6–10]. Thus, accurately iden-tifying genome-wide CNV, LOH and UPD is essential in understanding diseases and in design-ing correct clinical interventions.
For a long time, SNP genotyping arrays[11]and array Comparative Genomic Hybridization (aCGH)[12] have been deemed as standard means to detect CNV or LOH. Those DNA micro-arrays, however, suffer some common limitations—most notably that the measured CN ratio from fluorescence intensities is noisy[13–16] and the experimental results require further ex-amination from an experienced person.
With the rapid decrease in price and increase in accuracy with next-generation sequencing (NGS), more and more CNV and LOH studies are turning to NGS. Four methods for genome-wide CNV detection have been established recently based on whole-genome sequencing (WGS) using NGS. There are: paired-end mapping, read-depth analysis, split-read strategies, and sequence assembly comparisons[17–20]. These methods require high depth of coverage on whole genome scale. Other approaches with low coverage depth on WGS cannot detect hetero-zygous positions for LOH and UPD[21,22]. Another parallel method is to sequence only the exome. The exome-only method detects CNVs associated with exons and typically small in size (~100—200bp). Their distribution in the genome is uneven. Thus, exome-only sequencing fails to capture a global picture of genome-scale aberrations.
A limited number of approaches have been developed for small CNV or LOH analysis using target region(TR) sequencing[23,24]. The current TR-approaches in practice are also limited to detect variations involving one or a few of exons. Most methods, based on TR sequencing, eliminate bias (GC bias etc.) by using some correction methods; but it is known that some local variations in depth-of-coverage cannot be removed by the GC-based correction[25] and the non-contiguous nature of target regions poses a different challenge to computational methods. For example, longer genes are on average better covered compared to shorter ones; and low-complexity target regions usually have poor coverage. Further, most of them do not discrimi-nate between two- and single-copy deletion and between three- and multiple-copy amplifica-tions. They cannot predict exact copy number of a genomic segment and fail to identify large LOH and UPD without a matched control or family members.
Results
Evaluation of SeTR Sequencing
In this study, we have designed 278,800 probes that are small DNA segments selected from the published human reference genome, Build 37.1, hg19. The total size of the probes is
41,795,106bp(~42Mb). Our probes cover 1.46% of the whole effective genome (2.86G bp, hg19). The average length of probe is about 150bp and the median physical distance between two adjacent probes is about 10.6kb genome wide (S1 TableandS1 Fig). We also vindicated the distribution of SeTR probes on three real samples before the downstream analysis.
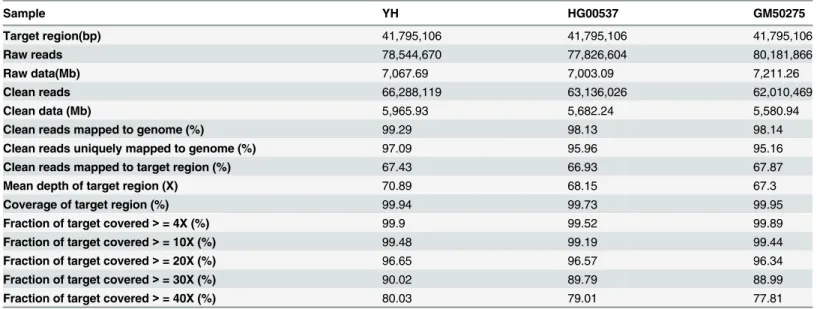
Three sequence libraries were generated from genomic DNA (gDNA) of three samples, in-cluding two normal samples (YH and HG00537) and a Coriell Institute sample, GM50275, known to contain a positive CNV. The three libraries were then sequenced via the Illumina high throughput sequencing platform. After filtering out reads with low sequencing quality scores (Q<20)[27] or with adapters’sequence, the clean data was mapped to the human ge-nome reference assembly (Build 37.1, hg19). 66.93%-67.87% of clean reads were aligned to tar-get regions, representing 95.16%-97.09% of the uniquely mapped. Under the condition that the mean target region coverage was 70 reads or above, the alignment results showed that 99.73%-99.95% of the target regions were covered by at least one reads and over 99% by at least ten reads (Table 1). This aligned coverage of target regions was better in evenness than the cover-age from other capturing methods, such as exome capturing, with similar mean covercover-age[28]. The coverage depth distribution of target regions showed a similar Poisson distribution for all three samples, indicating an even enrichment of the target regions (Fig 2A). Most SNPs’ sites called by GATK software have similar support reads for the non-reference allele and for the reference allele, inferring good enrichment balance for the two haplotypes (Fig 2B).
Characteristics of depth-of-coverage and heterozygous coefficient in
SeTRs
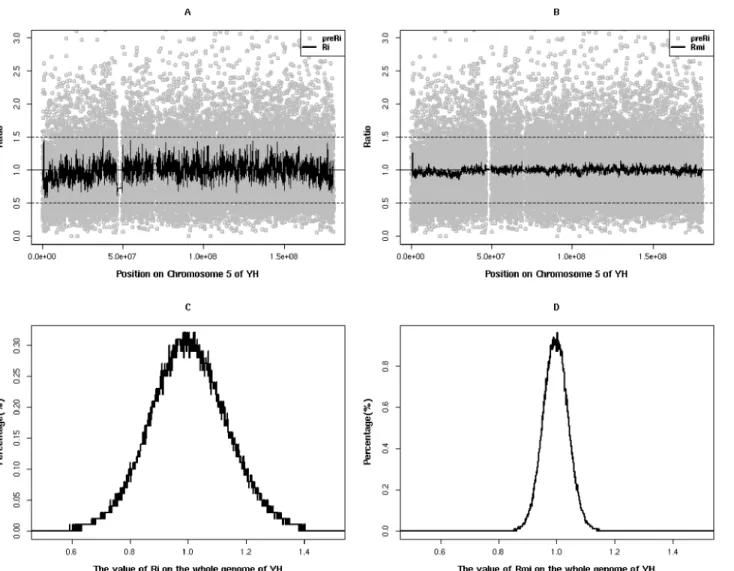
To detect CNV, the depth-of-coverage of SeTRs was calculated from the re-corrected align-ment results and then was transformed to preRiby dividing its coverage depth by the average depth of all target regions for the sample(seeMethods). We found that this preRihas large Fig 1. Overview of the ICLU pipeline.The pipeline takes the raw FASTQ files or the aligned BAM files as input, and outputs the genome-wide CNV, LOH and UPD results with visualization.
fluctuations on the whole genome scale, which is expected due to the characteristics of each tar-get region and the different capture efficiency of the probes (Fig 3AB). In order to keep the rela-tive stability of the fluctuations in contiguous target regions, two correction strategies were applied:1) We selected the mean value of ten downstream target regions’depth (TDmi) of the targetiregion to replace TDito get depth coefficient (Ri) using a smoothing fit. 2) We generate Rmby dividing Riwith the geometric median of all Ris of in the same target i region in multiple samples. The median of Ri, regarded as a robust baseline to reduce the adverse effect of experi-mental conditions and capture efficiency, is essential to renormalize Ri.A few of Ris alone in normal samples failed to be normalized to 1 by formulas (1,2,3,4,5) (seeMethods)(Fig 3A). After those smoothing and renormalization steps, the final corrected ratio (Rmi) showed much smaller variability across the whole genome. It is much closer to the normal distribution with a mean of 1(from 1.207 to 0.959) and a smaller standard deviation (from 0.54 to 0.29) than Ri (Fig 3) in YH. When using the above approach to analyze the depth-of-coverage of SeTRs on Table 1. Data production and mapping results for the three samples used.
Sample YH HG00537 GM50275
Target region(bp) 41,795,106 41,795,106 41,795,106
Raw reads 78,544,670 77,826,604 80,181,866
Raw data(Mb) 7,067.69 7,003.09 7,211.26
Clean reads 66,288,119 63,136,026 62,010,469
Clean data (Mb) 5,965.93 5,682.24 5,580.94
Clean reads mapped to genome (%) 99.29 98.13 98.14
Clean reads uniquely mapped to genome (%) 97.09 95.96 95.16
Clean reads mapped to target region (%) 67.43 66.93 67.87
Mean depth of target region (X) 70.89 68.15 67.3
Coverage of target region (%) 99.94 99.73 99.95
Fraction of target covered>= 4X (%) 99.9 99.52 99.89
Fraction of target covered>= 10X (%) 99.48 99.19 99.44
Fraction of target covered>= 20X (%) 96.65 96.57 96.34
Fraction of target covered>= 30X (%) 90.02 89.79 88.99
Fraction of target covered>= 40X (%) 80.03 79.01 77.81
doi:10.1371/journal.pone.0123081.t001
Fig 2. Characteristics of SeTRs in three real samples.(A) Distribution of coverage depth in SeTR; (B) The distribution of supported non-reference and reference allele reads at SNPs’sites.
chromosome 5 of GM50275 individual, a copy number loss event (del(5)(p14)) gradually emerged (Fig 4), consistent with the known and confirmed result (Table 2).
To estimate LOH, polymorphic positions with high allele frequency between 0.1 and 0.9 in the 1000 Genome SNPs Database (ftp://ftp.ncbi.nih.gov/1000genomes/ftp/release) in SeTRs of samples were retained and the non-reference-allele or“B-allele”frequency (BAF) of these posi-tions was substituted by heterozygous coefficient (denoted as RHet, seeMethods) to represent the heterozygous status of these local sites in SeTRs. In order to eliminate the individual back-ground difference and give reasonable expression of RHet, median RHetwas introduced. It is the geometric median of all RHets for every polymorphic position in the collection of multiple sam-ples. By RHet’s definition, if a LOH occurs in a sequenced region, the expected sets of RHets on the sequenced regionequal0 and otherwise they should equal1. In practice, most of RHets or median RHets were distributed between 0 and 1 across the whole chromosomes in one normal sample or in multiple samples (Fig 5). PCR amplification bias in NGS[29] may cause a haploid fragment pairs not equal in amounts. In our investigation, on chromosome 5p14 in GM50275 individual, a loss event happens, the sets of RHets were close to 0 (Fig 5) and it reveals obviously Fig 3. Characteristics of three ratios in YH sample.(AB)The distribution of three ratios across Chromosome 5.The imaginary line (Ratio = 0.5) means the CN equals to 1 and the imaginary line (Ratio = 1.5) CN equals to 3. After smoothing and renormalized steps, the fluctuation of ratios decreased gradually from preRi(gray circle points) to Ri, and then to Rmi(black line). (C)The distribution of Riin the whole genome;(D)The distribution of Rmiin the whole genome.
that there was a LOH. Based on this reasoning, an F-test is applied in our method to detect sig-nificance increases in variance of RHets of a genomic region in a test sample from that of medi-an RHets in the collection of multiple samples (seeMethods).
The performance of ICLU
We first used simulated data and then real samples’data to assess the accuracy and power of our method for detecting genome-wide CNV. As our first step, we applied ICLU and CONTRA developed on WEGS[24], to detect small CNV with sizes ranging from 450Kb to 3Mb, and to identify the boundaries (break point detection) using the simulated whole genome sequencing data. With the same SeTRs, we simulated the Illumina paired-end (PE) reads with ~30X cover-age of 8 individual samples using wgism (website:https://github.com/lh3/wgsim) but only per-formed the simulation on Chromosomes 19 and 20 of hg19 because of limited computing Fig 4. Characteristics of preRiand Rmion Chromosome 5 of GM50275 individual.
doi:10.1371/journal.pone.0123081.g004
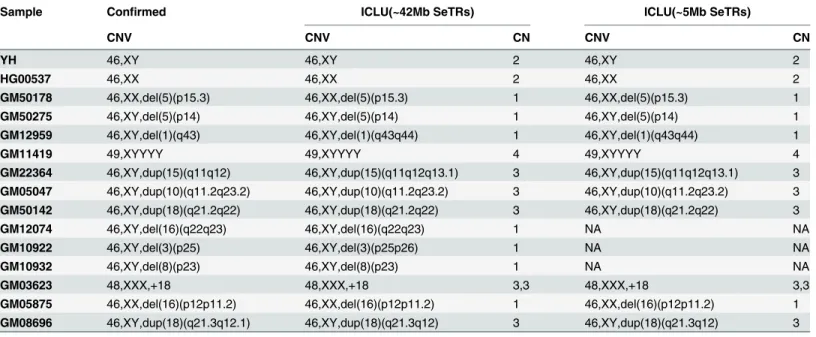
Table 2. The detected results of genome-wide CNV of 15 confirmed samples.
Sample Confirmed ICLU(~42Mb SeTRs) ICLU(~5Mb SeTRs)
CNV CNV CN CNV CN
YH 46,XY 46,XY 2 46,XY 2
HG00537 46,XX 46,XX 2 46,XX 2
GM50178 46,XX,del(5)(p15.3) 46,XX,del(5)(p15.3) 1 46,XX,del(5)(p15.3) 1
GM50275 46,XY,del(5)(p14) 46,XY,del(5)(p14) 1 46,XY,del(5)(p14) 1
GM12959 46,XY,del(1)(q43) 46,XY,del(1)(q43q44) 1 46,XY,del(1)(q43q44) 1
GM11419 49,XYYYY 49,XYYYY 4 49,XYYYY 4
GM22364 46,XY,dup(15)(q11q12) 46,XY,dup(15)(q11q12q13.1) 3 46,XY,dup(15)(q11q12q13.1) 3 GM05047 46,XY,dup(10)(q11.2q23.2) 46,XY,dup(10)(q11.2q23.2) 3 46,XY,dup(10)(q11.2q23.2) 3 GM50142 46,XY,dup(18)(q21.2q22) 46,XY,dup(18)(q21.2q22) 3 46,XY,dup(18)(q21.2q22) 3
GM12074 46,XY,del(16)(q22q23) 46,XY,del(16)(q22q23) 1 NA NA
GM10922 46,XY,del(3)(p25) 46,XY,del(3)(p25p26) 1 NA NA
GM10932 46,XY,del(8)(p23) 46,XY,del(8)(p23) 1 NA NA
GM03623 48,XXX,+18 48,XXX,+18 3,3 48,XXX,+18 3,3
GM05875 46,XX,del(16)(p12p11.2) 46,XX,del(16)(p12p11.2) 1 46,XX,del(16)(p12p11.2) 1 GM08696 46,XY,dup(18)(q21.3q12.1) 46,XY,dup(18)(q21.3q12) 3 46,XY,dup(18)(q21.3q12) 3 Note:“NA”means there is no result due to failing to make a NGS library.
resource. The simulated sequence data has a median insert size of 200bp and a read length of 100bp. 3 of 8 individual samples are designed as true positive CNV samples. The other 5 sam-ples are designed as normal, and are used as a control set so as to create a robust base line. All these simulated data received CNV analysis using ICLU pipeline described above (Fig 1) with parameters-M 10,-P 0.05 and CONTRA with default parameters. ICLU analysis results cap-tured all 9 true positive events containing CN, and no false positive with 100% of sensitivity and 100% of specificity(S2 TableandS2 Fig). In comparison, CONTRA reports 11 CNV events, 8 are true positive and 3 false positive, thus behaving with 88.9% of sensitivity and 66.7% of specificity(S2 Table)
In the second step, we applied ICLU on 55X~90X of SeTRs sequencing data of 15 real human individuals, including 2 normal samples and 13 samples with true positive CNV events, all of which have been studied before. A robust base line of median Riwas constructed from 15 samples, and all samples were searched for CNVs over 1Mb at the p-value of 0.05 with the min-imal number of probes setting at 45 or the minmin-imal size of region at ~0.5Mb (45~10kb = ~450kb). In total, 13 out of 15 test samples were identified with CNVs over 4Mb or with aneu-ploidies, including 11 events of CNVs from 11 samples and 3 aneuploidies from 2 samples. Among those, 7 events were single-copy deletions, 6 events three-copy amplifications, and 1 event a four-copy amplification on chromosome Y. In summary, the CNV results estimated by ICLU were highly consistent with confirmed CNV results (Table 2). The results demonstrated that ICLU in this case presented 100% sensitivity and 100% specificity(S3 Table).
Fig 5. The distribution of RHetacross Chromosome 5 in YH, multiple samples and GM50275.(A) RHets
for the normal sample, YH; (B) Median RHets for multiple samples; (C) RHets for the positive sample, GM50275.
We also studied the ability of our method at different coverage depth of SeTRs by gradually decreasing the depth of SeTRs from 55X~90X to 5X. The performance of ICLU did not degen-erate significantly as coverage depth decreases. Almost all known CNV were discovered with no false positive predictions (S4 Table), even at its lower depth level of 8X.If coverage is below 8X,CNV calls by ICLU are no longer reliable (S3 Fig). There is one exception concerning an an-euploidy prediction on chromosome Y of sample GM11419 with 30X average coverage depth. Its computed mean CN is 3.497, giving a false predicted CN of 3 after round off (whereas the correct CN should be 4). In this case, the density of probes on chromosome Y is not high enough (S1 Table) to keep Rmistable with lowered average coverage. This problem can be fixed by increasing the probe density at this region without raising coverage depth, or, of course, by increasing the average coverage depth as was shown before.
We also used ICLU to analyze LOH and UPD events within these 15 real samples on 55X~90X depth-of-coverage of SeTRs sequencing data. 8 events of LOH, whose sizes are larger than 5Mb, were observed under the p-value of 0.01; and all boundaries of LOH (CN = 1) were consistent with CNV results. Furthermore, combining with CNV (CN = 2) and LOH results, 3 isodisomy events of UPD were identified (Table 3). Without their familial information or matched samples, we cannot confirm the accuracy of these findings. But at least in theory, when CN was equal 1, LOH should happen, and that was captured in our results.
Moreover, we redesigned another smaller SeTRs set according to the same designing ap-proach as described in Methods, the total size of which is 4,926,646bp(~5Mb).We used ICLU to analyze the above cell-line samples and it is demonstrated that the ICLU based on this SeTRs(~5Mb) has as good performance in detecting CNVs as that based on SeTRs(~42Mb) (Table 2andS3 Table). This indicates that ICLU is flexible with its number of probes, and the results produced by ICLU are reproducible even though the SeTR probes are significantly re-duced. Of course, the resolution power on CNV boundaries will drop as number of probes are decreased systematically. We also tested ICLU algorithm on 5 samples from aborted fetuses Table 3. The detected results of genome-wide LOH and UPD in15 test samples.
Sample Chromosome Start End Size(>5M) LOH CN
YH - - -
-HG00537 - - -
-GM50178 chrX 103489643 108870605 5.38 UPD 2
chr5 38139 5893356 5.86 LOH_nonUPD 1
GM50275 chr5 18601469 28281734 9.68 LOH_nonUPD 1
GM12959 chr1 242808483 248553940 5.75 LOH_nonUPD 1
chr10 38160098 43475568 5.32 UPD 2
GM11419 chr3 46077525 51871405 5.79 UPD 2
GM22364 - - -
-GM05047 - - -
-GM50142 - - -
-GM12074 chr16 67747306 75697469 7.95 LOH_nonUPD 1
GM10922 chr3 75084 11736290 11.66 LOH_nonUPD 1
GM10932 - - -
-GM03623 - - -
-GM05875 - - -
-GM08696 - - -
-Note:“LOH_nonUPD”means there is a LOH, but not UPD;“-”means there is no LOH events in this sample.
with unknown result and then validated these predictions by WGS method[30]. The data showed that ICLU, just as the WGS approach, can produced highly reliable results (S5 Table).
Visualization
In our study, Circos[26] is used to plot circular maps for a genome-wide view of relationships among genomic intervals. It depicts the details of whole-genome CNV and LOH features and is useful for a comprehension of the global picture. The figure is consisted of four parts from outside to inside: I) the chromosome ideograms in a pter-qter orientation, clockwise with the centromeres in red; II) the distribution of Rmiacross whole genome with blue lines and the value of Rmiis from 4 to 0; III) the p-value views of heterozygous state; IV) the distribution of RHetacross whole genome with orange spots and the value of RHetis from 1 to 0. As shown in
Fig 6, one can see that there are 1 deletion and 1 LOH on chromosome 5p14 of the individual GM50275. Results for other individuals are shown inS4 Fig.
Discussion
In this paper, we have proposed a novel integrated method, a selected target region approach (SeTR approach), for detecting genome-wide structural variations such as CNV, LOH and UPD. SeTRs are selected genome-wide with mean probe length of 150bp, the average distance
Fig 6. The Circos result of GM50275.In part II, CN can be predicted by dividing Rmiby 0.5 and a red line indicates a loss event and a green line displays a gain event.
among them of ~10kb, and the cumulative size of ~42Mb. Once sequenced to a certain depth, captured sequences of this set can be effectively used to detect structural variations and geno-mic aberrations for the entire genome. We also have developed a software package, ICLU, that uses statistical algorithms to detect of CNV, LOH and UPD for the SeTR sequencing approach. In addition, if one is only concerned about a specific CNV disease, or on a specific chromo-some, or a certain collection of genomic hot spots, one can use a subset of our SeTRs within the interesting regions and our method will just work effectively as well.
With this selected target region approach, we don’t need to sequence the entire genome in order to detect CNVs. Our current approach only requires the sequencing of a fraction of the genome, about ~42Mb in size, or ~1.5% of the genome. In the extreme case, we can even lower the set to a minimal size of ~5Mb, or about ~0.17% of the genome, and still make correct pre-dictions. With this approach, we can bring the coverage depth in the targeted regions much higher, and in the meantime, keep the overall cost of sequencing much smaller than that of a genome-wide sequencing approach. With the genomic sequencing cost dropping exponential-ly, our approach is a low-cost, high efficient method for detecting large structure aberrations such as CNV, LOH and UPD. It has the potential to displace other methods, such as the micro-array based approaches, and the WGS methods.
At any specific location within genome, we perform noise reduction and signal smoothing using the medium coverage value for the entire collection of samples. This medium value mat-ters a lot to us. Presumably, the healthy samples should far exceed diseased ones in a popula-tion for any specific region in quespopula-tion; otherwise one would be prone to make incorrect CNV calls. In the extreme, a sample size of 3 with at most 1 CNV in any specific genomic spot for the entire genome would be the absolute limit in applicability for our approach. In practice, for our method to make correct predictions, we would require a substantially larger collection of samples. Here we propose that a meaningful threshold of 8 samples as the minimum, and the samples should come from a random population.
Another limitation on our method concerns the detection of breaking points, or the exact CNV transition locations. We assume that each of our probes is located either entirely out of a CNV or entirely within. As we only sequence the genomic regions of SeTRs, a breaking point cannot be resolved beyond the two neighboring probes. What we do convey is to indicate that the two neighboring probes fall into two different CN regions. We also do not attempt to re-solve any breaking point within a single probe, although in theory that can happen in ~1.5% cases (which is the coverage of our probes for the genome). So, our current limit of detection resolution is ~10K bases. A deeper read depth of SeTRs or a higher density of probes can im-prove the statistical power of CNV and LOH detection, and can also discover CNV events smaller in size. In contract, the approach of paired-end mapping[31,32] andde novoassembly of a genome[33] on WGS data would be more suitable to pinpoint breakpoints, to identify novel cross-chromosome events, and to completely characterizing the full spectrum of CNV and LOH.
In previous studies, people have developed CNV methods for CNVs in only exome regions [23,24,34]. We can combine these exome probe sets with our SeTR set. The combined probe set will be able to detect exon SNPs, indels, and identify genome-wide CNV and LOH for dis-eases. This approach may be financially meaningful, as we are only sequencing the minimum amount of the genome, yet we will have the ability to address the most urgent questions such as protein integrity and genomic integrity the same time.
Conclusion
With the rapid development of sequencing technology and the fast decrease in price of NGS, detecting genomic alterations using a targeted sequencing strategy has the promises of high throughput and of low price. Price wise it should be less costly than both the microarray-based techniques and the WGS strategy. The targeted sequence data set offers a quick insight into CNV and LOH for specific diseases[35,36] or phenotypes in concern. Per conventions pro-posed in Itsara’s study, CN variants at the size larger than 500kb would usually be considered pathogenic in a clinical diagnostic setting[37]. This size fits well above our detection limit of 10kb. Therefore, our approach can detect all CNV events defined by current clinical standard. Our selected targeted region strategy, coupled with a much smaller size of sequenced genomic region and a decreased sequencing coverage depth, has tremendous financial advantages over other methods in clinics today. In addition, SeTRs sequencing can be combined with the se-quencing of other genomic regions of interest, such as exomic regions to form an economic way of discovering genetic variations that have significant impact on human health[38].
Materials and Methods
Designing SeTRs
Genomic regions with extreme GC content (high or low) or with high polymorphism rates negatively impact their PCR or target capture efficiency[23,39]. In some previous studies, GC-content adjustment and mappability corrections have been applied in computation to remove experimental bias[22,40–42]. In our study, we select special target regions, called evenly distrib-uted selected target regions (SeTRs) to avoid coverage bias due to sequence content. We select candidate SeTRs using the following criteria: (i) the uniqueness and stability properties of the region. We require less polymorphism and a modest GC content; (ii) a small number of sparse SNPs within to detect LOH, and that these SNPs are present with high frequency in population; (iii) the probes are relatively uniform in distribution within the entire genome. Each target re-gion is captured by one and only one probe.
The set of SeTR locations across the entire genome has been selected by the following steps:
i. SNPs set1: Based on SNPs database of the 1000 Genome Project (web:ftp://ftp.ncbi.nih.gov/ 1000genomes/ftp/release/), SNPs with allele frequency (AF) ranging 10% to 90% in popula-tion have been retained as candidates. A porpopula-tion of clustered SNPs, i.e. those located within the neighborhood of 100bp of another selected SNP, are removed.
iii. SNPs set3: Based on SNPs set2, the SNPs which are evenly distributed on the whole genome are selected as final selected SNPs. In our study, the ideal physical distance between two ad-jacent SNPs is set at 10k base. If an interval of 10k size contains more than one SNP in SNPs set2, only one is kept. SNPs set3 may contain large gaps within the neighboring SNPs.
iv. Final set for probe locations: For SNPs set3, if the physical distance of two adjacent SNPs was more over 10k base, one or more selected target locations, selected to be evenly distrib-uted within this gap region, are inserted. These additional locations make our collection of SeTR locations complete. We now have achieved a set of locations that are relatively evenly distributed across of the entire genome.
The typical gap size between two neighboring probe locations is around 10k base. The loca-tion may be a SNP localoca-tion from the 1000 Genome Project, or it may simply be a sequenced lo-cation within the reference genome. In lolo-cation selection, given the requirements of achieving a relative evenness in distribution, but not an absolute evenness, we do have the freedom of avoiding simple repetitive regions, and the regions with extreme GC values.
The source of samples and simulated data
The cell lines of 13 samples have been bought from The Coriell Institute, containing 2 aneu-ploid samples and 11 micro deletion or duplication samples. All of their karyotype results and catalogue ID (S6 Table) can be found from the webpage (http://ccr.coriell.org/Default.aspx? public = true) using GM id. In addition, the YH sample, a healthy Chinese individual, and the HG00537 sample (www.1000genomes.org) with normal karyotype and 5 DNA samples from aborted fetuses were used in our evaluation of the method. We also used simulated data for evaluation. A collection of 8 WGS data were generated via computer simulation, with the sam-ples containing a total of 9 true CNV events.
Sequencing read mapping
After the whole genome shotgun library was constructed, the target PCR products captured by SeTRs kits were sequenced on the Illumina HiSeq2000 sequencer following manufacturer’s in-structions. Raw sequencing data was filtered by some bioinformatics screens (screening out low quality reads and contaminated reads by using adapter and bacteria sequences). The re-maining data were mapped to the reference human genome (hg19, Build 37.1) using BWA[44] with default parameters. We then process the alignments by using SAMtools[45] to remove PCR duplications. We also run local realignment around indels and base quality score recali-bration employing the Genome Analysis Tool Kit (GATK) software[46].
Genome-wide CNV screening
The relevant computation formula is as follow:
TDi ¼Tibase=Tilen 1
TDmi ¼ ð
Xi
iþnTDiÞ=ðnþ1Þ;n10 2
TD¼ ðXiiþnTDiÞ=ðnþ1Þ 3
TDm¼ ð
Xi
iþnTDmiÞ=ðnþ1Þ 4
Ri ¼TDmi=TDm 5
preRi¼TDi
.
ðX1NTDiÞ
.
N 6
Note:Tibasewas the number of aligned bases in the regioniandTilenwas its length. In theory, all Rmifrom multiple samples in the specific regionifollow normal distribution. For a given test sample in regioni, T-test was adapted to detect a CNV signal using parameters estimated from the collection of samples.
t¼ðRmi1 Rmi2Þ ðm1 m2Þ
ffiffiffiffiffiffiffiffiffiffiffiffiffiffiffiffiffiffiffiffiffiffiffiffiffiffiffiffiffiffiffiffiffiffiffiffiffiffiffiffiffiffi
ðn1 1ÞS21þðn2 1ÞS22
n1þn2 2 ð
1
n1þ
1
n2Þ
q tn1þn2 2 7
When the number of test samples was 1 and the number of multiple samples was n, under the condition of the same Rmidistribution in each population, formula (7) can be simplified to:
t¼Rmi testffiffiffiffiffiffiffiffiffiffiffiffiffiffiffiffiffiffiffiffiffiffiffiffiffiffiRmi multiple
S2
multipleð1þ
1
nÞ
q 8
According to formula (8), a T-score and a p-value of each regionican be calculated. A re-gion with p-value less than 0.05 was considered as a CNV signal in our study; and copy number for the region was simply predicted by dividing Rmby 0.5 and taken it to the nearest integer (the nearest integer function):CN = int(Rmi/0.5). Based on the p-value from T-test of a target region, a pseudo signal was appended to each probe to indicate whether it was implicated in the CNV region for the next step. Then, neighboring target regions having same copy numbers will be merged together to form larger intervals across the entire chromosome. Here is an idea on merging neighboring target regions into large intervals: A continuous 4 target regions was set as the minimum interval size if they had the same direction of copy number change (T-score<0 or>0) and 3 of their p-values were less than thefirst threshold value (i.e. 0.05, com-mon threshold set for tests of significance), and the fourth p-value should not exceed a second threshold (set at 0.2,i.e. Four times thefirst threshold value). Once meeting these condition, all continuous 4 target regions would be mark‘-’or‘+’as a pseudo signal. With the same pseudo signal, the two sets of {i..i+k;k3,i1;i,k2n} and {j..j + l;l3,ji+k;j,l2n} that were separated by less than 5 target regions, i.e.j−(i+ 3)5, would be merged as a single
approach, the boundary, size and CN of {i..N;N4,i1;N,i2n} would be reported.
Zi ¼Rmi test Rmi multiple 9
t¼
Xi NZi
,
ðN iþ1Þ
SZi
ffiffiffiffiffiffiffiffi
N i p
tðN iÞ 10
Genome-wide LOH and UPD screening
SNP positions with allele frequencies between 0.1 and 0.9 in the 1000 Genome SNPs Database in the target regions of samples are used to detect heterozygosity. For the positioni, the B-allele count is the number of reads with non-reference calls at this position. The B-Allele Frequency, aka BAF, is the B-allele count divided by the total number of reads mapped to positioni. RHet, the heterozygosity advantage rate of the positioni, is calculated by formula (11) and it repre-sents the heterozygous state of positioni.
RHet¼min
BAF
1 BAF;
1 BAF BAF
;RHet ½0;1 11
If positioniappears to be an absolute heterozygous state, its RHetwould be 1. On the con-trary, when the RHetequals 0, positioniis completely homozygous. An F-test has been applied to detect LOH in whole genome using SD of RHets as follow: In the test sample, a subset of RHets, has been constructed from the position i to j, denoted byTij= {RHet_i,RHet_i+1,. . .,RHet_j;
i,j2n}. The corresponding,Mij¼ fR~Het i;R~Het iþ1;. . .;R~Het j;i;j2ngcould be identified from
multiple samples, hereR~Het idenotes the median value of RHet_is for all samples at the position i. Standard deviation (SD) of Tijwas compared with SD of Mijby F-test to accept the null hy-pothesis (H0) or the alternative hypothesis (HA) under the threshold of the p-value 0.01. If the p-value of Tijis lower than 0.01, HAis accepted. It means that the subset of Tijhas lost hetero-zygosis comparing with the multiple samples. See formulas below for calculation details.
S2
test¼
X
irj
ðRtest r Rtest rÞ
2
n 1 12
S2
mul¼
X
irj
ðRmul r Rmul rÞ
2
n 1 13
S2
max ¼maxfS
2
test;S
2
mulg;S
2
min¼minfS
2
test;S
2
mulg 14
Fupper¼
S2
max
S2
min
;dftest¼dfmul¼n 1 ;Funder¼
S2
min
S2
max
;dftest¼dfmul¼n 1 15
p value¼pupperþ ð1 punderÞ 16
We scan the continuous sets of {Tk,Tk+ 1,. . .,Tl;k,l2n;l−k3}, and initiate a LOH
interval size spanning 3 probes. We extend this LOH by adding neighboring probes with small p-values. We allow the continuous expansion of LOH region if only one probe has p-value greater than 0.01 but the mean p-value for the entire region {Tk,Tk+ 1,. . .,Tl;k,l2n;l−k3}
is still less than 0.1. In another word, if the p-value of {Tk,Tk+ 1,. . .,Tl;k,l2n;l−k3} of the
extended region is smaller than 0.01,HA:σtest6¼σmulis accepted and that {Tk,Tk+ 1,. . .,Tl;k,l
2n;l−k3} is predicted as a larger LOH.
The isodisomy of UPD occurs when a person receives two copies of a part or entire chromo-some from one parent because of a duplication event. Integrating the results from genome-wide CNV computation and heterozygosis screening, the isodisomy can be evaluated by apply-ing this definition. If a segment presents that an LOH event has happened and the copy num-ber is normal at the same time, we can conclude that the segment is an isodisomy.
Supporting Information
S1 Fig. The characteristics of SeTRs on whole genome.(A) The distribution of the SeTRs probe length; (B) The distribution of the gap sizes of adjacent probes in SeTRs.
(TIF)
S2 Fig. The CNV results for eight simulated WGS samples using ICLU pipeline.From out-side to inout-side, the turn is from sample 1 to sample 8 and the detected CNV events are presented with purple solid line.
(TIF)
S3 Fig. The performance of ICLU on ~42Mb SeTRs with the decrease of depth-of-coverage.
(TIF)
S4 Fig. The Circos results of fifteen real samples.
(TIF)
S5 Fig. The distribution of RHets (green spots) across chromosome 10 on GM05047.When the CN of a fragment with heterozygosity is three, the sets of RHets of the fragment cluster is around 0.5 (between two red dotted lines). Following this observation, RHetcan also be used to predict CNV events, or be used to verify the accuracy of a CNV prediction.
(TIF)
S1 Table. The SeTRs statistics by chromosome.
(DOCX)
S2 Table. The performance of ICLU and CONTRA on a 30X coverage of simulated WGS data set.
(DOCX)
S3 Table. The performance of ICLU for detecting CNV with~42Mb and~5Mb size of SeTRs.
(DOCX)
S4 Table. The performance of ICLU for detecting CNV with different depth on 15 real sam-ples’SeTRs data.
(XLS)
S5 Table. The CNV analysis of SeTRs with ICLU algorithm and WGS method on the five abortion samples.
S6 Table. Catalogue number of the 13 cell line samples bought from Coriell Institute.
(DOCX)
S1 Text. No competing Interest declared by Y. Tom Tang.
(PDF)
Acknowledgments
We are grateful to our colleagues at the BGI-Shenzhen for sequencing. We thank Yile Huang, Dayang Chen, and Aiping Zhang, for participating in analyzing sequence data. We also want to thank Saijun Liu and Caifen Zhang for excellent discussions and advices.
Author Contributions
Conceived and designed the experiments: YW WL JL. Performed the experiments: WL XZ HZ XDZ. Analyzed the data: YW YX JLL. Contributed reagents/materials/analysis tools: WG YPS JH CC YJS LL HC. Wrote the paper: YW WL YX CW YTT HD JL.
References
1. Redon R, Ishikawa S, Fitch KR, Feuk L, Perry GH, Andrews TD, et al. (2006) Global variation in copy number in the human genome. Nature 444: 444–454. PMID:17122850
2. Rancoita PM, Hutter M, Bertoni F, Kwee I (2010) An integrated Bayesian analysis of LOH and copy number data. BMC Bioinformatics 11: 321. doi:10.1186/1471-2105-11-321PMID:20550648 3. Freeman JL, Perry GH, Feuk L, Redon R, McCarroll SA, Altshuler DM, et al. (2006) Copy number
varia-tion: new insights in genome diversity. Genome Res 16: 949–961. PMID:16809666
4. Broman KW, Weber JL (1999) Long homozygous chromosomal segments in reference families from the centre d'Etude du polymorphisme humain. Am J Hum Genet 65: 1493–1500. PMID:10577902 5. Frazer KA, Ballinger DG, Cox DR, Hinds DA, Stuve LL,Gibbs RA, et al. (2007) A second generation
human haplotype map of over 3.1 million SNPs. Nature 449: 851–861. PMID:17943122
6. Choi CH, Lee KM, Choi JJ, Kim TJ, Kim WY, Lee JW, et al. (2007) Hypermethylation and loss of hetero-zygosity of tumor suppressor genes on chromosome 3p in cervical cancer. Cancer Lett 255: 26–33. PMID:17467893
7. Deng FY, Zhao LJ, Pei YF, Sha BY, Liu XG, Yan H, et al. (2010) Genome-wide copy number variation association study suggested VPS13B gene for osteoporosis in Caucasians. Osteoporos Int 21: 579–
587. doi:10.1007/s00198-009-0998-7PMID:19680589
8. Jankowska AM, Szpurka H, Tiu RV, Makishima H, Afable M, Huh J, et al. (2009) Loss of heterozygosity 4q24 and TET2 mutations associated with myelodysplastic/myeloproliferative neoplasms. Blood 113: 6403–6410. doi:10.1182/blood-2009-02-205690PMID:19372255
9. Rovelet-Lecrux A, Hannequin D, Raux G, Le Meur N, Laquerriere A, Vital A, et al. (2006) APP locus du-plication causes autosomal dominant early-onset Alzheimer disease with cerebral amyloid angiopathy. Nat Genet 38: 24–26. PMID:16369530
10. Stefansson H, Rujescu D, Cichon S, Pietilainen OP, Ingason A, Steinberg S, et al. (2008) Large recur-rent microdeletions associated with schizophrenia. Nature 455: 232–236. doi:10.1038/nature07229 PMID:18668039
11. Conrad DF, Andrews TD, Carter NP, Hurles ME, Pritchard JK (2006) A high-resolution survey of dele-tion polymorphism in the human genome. Nat Genet 38: 75–81. PMID:16327808
12. Pinkel D, Segraves R, Sudar D, Clark S, Poole I, Kowbel D, et al. (1998) High resolution analysis of DNA copy number variation using comparative genomic hybridization to microarrays. Nat Genet 20: 207–211. PMID:9771718
13. Bengtsson H, Irizarry R, Carvalho B, Speed TP (2008) Estimation and assessment of raw copy num-bers at the single locus level. Bioinformatics 24: 759–767. doi:10.1093/bioinformatics/btn016PMID: 18204055
14. Chen HI, Hsu FH, Jiang Y, Tsai MH, Yang PC, Meltzer PS, et al. (2008) A probe-density-based analysis method for array CGH data: simulation, normalization and centralization. Bioinformatics 24: 1749–
15. Fitzgerald TW, Larcombe LD, Le Scouarnec S, Clayton S, Rajan D, Carter NP, et al. (2011) aCGH. Spline—an R package for aCGH dye bias normalization. Bioinformatics 27: 1195–1200. doi:10.1093/ bioinformatics/btr107PMID:21357574
16. Marioni JC, Thorne NP, Valsesia A, Fitzgerald T, Redon R, Fiegler H, et al. (2007) Breaking the waves: improved detection of copy number variation from microarray-based comparative genomic hybridiza-tion. Genome Biol 8: R228. PMID:17961237
17. Dalca AV, Brudno M (2010) Genome variation discovery with high-throughput sequencing data. Brief Bioinform 11: 3–14. doi:10.1093/bib/bbp058PMID:20053733
18. Koboldt DC, Zhang Q, Larson DE, Shen D, McLellan MD, Lin L, et al. (2012) VarScan 2: somatic muta-tion and copy number alteramuta-tion discovery in cancer by exome sequencing. Genome Res 22: 568–576. doi:10.1101/gr.129684.111PMID:22300766
19. Medvedev P, Stanciu M, Brudno M (2009) Computational methods for discovering structural variation with next-generation sequencing. Nat Methods 6: S13–20. doi:10.1038/nmeth.1374PMID:19844226 20. Ruffalo M, LaFramboise T, Koyuturk M (2011) Comparative analysis of algorithms for next-generation
sequencing read alignment. Bioinformatics 27: 2790–2796. doi:10.1093/bioinformatics/btr477PMID: 21856737
21. Chiang DY, Getz G, Jaffe DB, O'Kelly MJ, Zhao X, Carter SL, et al. (2009) High-resolution mapping of copy-number alterations with massively parallel sequencing. Nat Methods 6: 99–103. doi:10.1038/ nmeth.1276PMID:19043412
22. Zhang C, Chen S, Yin X, Pan X, Lin G, Tan Y, et al. (2013) A single cell level based method for copy number variation analysis by low coverage massively parallel sequencing. PLoS One 8: e54236. doi: 10.1371/journal.pone.0054236PMID:23372689
23. Sathirapongsasuti JF, Lee H, Horst BA, Brunner G, Cochran AJ, Binder S, et al. (2011) Exome se-quencing-based copy-number variation and loss of heterozygosity detection: ExomeCNV. Bioinformat-ics 27: 2648–2654. doi:10.1093/bioinformatics/btr462PMID:21828086
24. Li J, Lupat R, Amarasinghe KC, Thompson ER, Doyle MA, Ryland GL, et al. (2012) CONTRA: copy number analysis for targeted resequencing. Bioinformatics 28: 1307–1313. doi:10.1093/ bioinformatics/bts146PMID:22474122
25. Teo SM, Pawitan Y, Ku CS, Chia KS, Salim A (2012) Statistical challenges associated with detecting copy number variations with next-generation sequencing. Bioinformatics 28: 2711–2718. doi:10.1093/ bioinformatics/bts535PMID:22942022
26. Krzywinski M, Schein J, Birol I, Connors J, Gascoyne R, Horsman D, et al. (2009) Circos: an information aesthetic for comparative genomics. Genome Res 19: 1639–1645. doi:10.1101/gr.092759.109PMID: 19541911
27. Cock PJ, Fields CJ, Goto N, Heuer ML, Rice PM (2010) The Sanger FASTQ file format for sequences with quality scores, and the Solexa/Illumina FASTQ variants. Nucleic Acids Res 38: 1767–1771. doi: 10.1093/nar/gkp1137PMID:20015970
28. Parla JS, Iossifov I, Grabill I, Spector MS, Kramer M, McCombie WR(2011) A comparative analysis of exome capture. Genome Biol 12: R97. doi:10.1186/gb-2011-12-9-r97PMID:21958622
29. Aird D, Ross MG, Chen WS, Danielsson M, Fennell T, Russ C, et al. (2011) Analyzing and minimizing PCR amplification bias in Illumina sequencing libraries. Genome Biol 12: R18. doi: 10.1186/gb-2011-12-2-r18PMID:21338519
30. Li X, Chen S, Xie W, Vogel I, Choy KW, Chen F, et al. (2014) PSCC: sensitive and reliable population-scale copy number variation detection method based on low coverage sequencing. PLoS One 9: e85096. doi:10.1371/journal.pone.0085096PMID:24465483
31. Kidd JM, Cooper GM, Donahue WF, Hayden HS, Sampas N, Graves T, et al. (2008) Mapping and se-quencing of structural variation from eight human genomes. Nature 453: 56–64. doi:10.1038/ nature06862PMID:18451855
32. Tuzun E, Sharp AJ, Bailey JA, Kaul R, Morrison VA, Pertz LM, et al. (2005) Fine-scale structural varia-tion of the human genome. Nat Genet 37: 727–732. PMID:15895083
33. Iqbal Z, Caccamo M, Turner I, Flicek P, McVean G (2012) De novo assembly and genotyping of vari-ants using colored de Bruijn graphs. Nat Genet 44: 226–232. doi:10.1038/ng.1028PMID:22231483 34. Magi A, Tattini L, Cifola I, D'Aurizio R, Benelli M, Mangano E, et al. (2013) EXCAVATOR: detecting
copy number variants from whole-exome sequencing data. Genome Biol 14: R120. PMID:24172663 35. Coin LJ, Cao D, Ren J, Zuo X, Sun L, Yang S, et al. (2012) An exome sequencing pipeline for identifying
and genotyping common CNVs associated with disease with application to psoriasis. Bioinformatics 28: i370–i374. doi:10.1093/bioinformatics/bts379PMID:22962454
37. Miller DT, Adam MP, Aradhya S, Biesecker LG, Brothman AR, Carter NP, et al. (2010) Consensus statement: chromosomal microarray is a first-tier clinical diagnostic test for individuals with develop-mental disabilities or congenital anomalies. Am J Hum Genet 86: 749–764. doi:10.1016/j.ajhg.2010. 04.006PMID:20466091
38. Girirajan S, Campbell CD, Eichler EE (2011) Human copy number variation and complex genetic dis-ease. Annu Rev Genet 45: 203–226. doi:10.1146/annurev-genet-102209-163544PMID:21854229 39. van Heesch S, Mokry M, Boskova V, Junker W, Mehon R, Toonen P, et al. (2013) Systematic biases in
DNA copy number originate from isolation procedures. Genome Biol 14: R33. doi: 10.1186/gb-2013-14-4-r33PMID:23618369
40. Abyzov A, Urban AE, Snyder M, Gerstein M (2011) CNVnator: an approach to discover, genotype, and characterize typical and atypical CNVs from family and population genome sequencing. Genome Res 21: 974–984. doi:10.1101/gr.114876.110PMID:21324876
41. Miller CA, Hampton O, Coarfa C, Milosavljevic A (2011) ReadDepth: a parallel R package for detecting copy number alterations from short sequencing reads. PLoS One 6: e16327. doi:10.1371/journal. pone.0016327PMID:21305028
42. Yoon S, Xuan Z, Makarov V, Ye K, Sebat J (2009) Sensitive and accurate detection of copy number variants using read depth of coverage. Genome Res 19: 1586–1592. doi:10.1101/gr.092981.109 PMID:19657104
43. Mount DW (2007) Using the Basic Local Alignment Search Tool (BLAST). CSH Protoc 2007: pdb top17.
44. Li H, Durbin R (2009) Fast and accurate short read alignment with Burrows-Wheeler transform. Bioin-formatics 25: 1754–1760. doi:10.1093/bioinformatics/btp324PMID:19451168
45. Li H, Handsaker B, Wysoker A, Fennell T, Ruan J, Homer N, et al. (2009) The Sequence Alignment/ Map format and SAMtools. Bioinformatics 25: 2078–2079. doi:10.1093/bioinformatics/btp352PMID: 19505943