Identification of Genome-Wide Variations among Three
Elite Restorer Lines for Hybrid-Rice
Shuangcheng Li1,2,3, Shiquan Wang1,2,3, Qiming Deng1,2,3, Aiping Zheng1,2, Jun Zhu1,2, Huainian Liu1, Lingxia Wang1, Fengyan Gao2, Ting Zou2, Bin Huang2, Xuemei Cao2, Lizhi Xu1, Chuang Yu1, Peng Ai1, Ping Li1,2,3*
1Rice Research Institute, Sichuan Agricultural University, Wenjiang, Sichuan, China,2Key Laboratory of Crop Genetic Resources and Improvement, Ministry of Education, Sichuan Agricultural University, Ya’an, Sichuan, China,3State Key Laboratory of Hybrid Rice, Sichuan Agricultural University, Chengdu, China
Abstract
Rice restorer lines play an important role in three-line hybrid rice production. Previous research based on molecular tagging has suggested that the restorer lines used widely today have narrow genetic backgrounds. However, patterns of genetic variation at a genome-wide scale in these restorer lines remain largely unknown. The present study performed re-sequencing and genome-wide variation analysis of three important representative restorer lines, namely, IR24, MH63, and SH527, using the Solexa sequencing technology. With the genomic sequence of the Indica cultivar 9311 as the reference, the following genetic features were identified: 267,383 single-nucleotide polymorphisms (SNPs), 52,847 insertion/deletion polymorphisms (InDels), and 3,286 structural variations (SVs) in the genome of IR24; 288,764 SNPs, 59,658 InDels, and 3,226 SVs in MH63; and 259,862 SNPs, 55,500 InDels, and 3,127 SVs in SH527. Variations between samples were also determined by comparative analysis of authentic collections of SNPs, InDels, and SVs, and were functionally annotated. Furthermore, variations in several important genes were also surveyed by alignment analysis in these lines. Our results suggest that genetic variations among these lines, although far lower than those reported in the landrace population, are greater than expected, indicating a complicated genetic basis for the phenotypic diversity of the restorer lines. Identification of genome-wide variation and pattern analysis among the restorer lines will facilitate future genetic studies and the molecular improvement of hybrid rice.
Citation:Li S, Wang S, Deng Q, Zheng A, Zhu J, et al. (2012) Identification of Genome-Wide Variations among Three Elite Restorer Lines for Hybrid-Rice. PLoS ONE 7(2): e30952. doi:10.1371/journal.pone.0030952
Editor:Randall P. Niedz, United States Department of Agriculture, United States of America
ReceivedSeptember 6, 2011;AcceptedDecember 27, 2011;PublishedFebruary 23, 2012
Copyright:ß2012 Li et al. This is an open-access article distributed under the terms of the Creative Commons Attribution License, which permits unrestricted use, distribution, and reproduction in any medium, provided the original author and source are credited.
Funding:This work was supported by the National Basic Research (973) Program of China (2011CB100101), the National Natural Science Foundation of China (30800084), and the Special Programs for GM Crops Initiative of China (2008ZX08001-001). The funders had no role in study design, data collection and analysis, decision to publish, or preparation of the manuscript.
Competing Interests:The authors have declared that no competing interests exist. * E-mail: [email protected]
Introduction
As the main staple food for more than half of the world’s population, rice (Oryza sativaL.) is one of the most important food crops. In 1973, the field production of Indica hybrid rice succeeded when Chinese rice breeders completed the three-line breeding system [1]. A land area of approximately 130,000 hm2 was soon developed for hybrid rice cultivation, greatly increasing rice yield in China. In the three-line breeding system, the cytoplasmic male sterility (CMS) line is crossed with the restorer line to produce the F1hybrid rice, and with the maintainer line for
self-reproduction. The restorer line is widely considered as being key to further improve the resistance, yield, quality, and heterosis of hybrid rice [1,2]. IR24, an elite rice variety introduced in China by the International Rice Research Institute, was the most common restorer line used during the 1970s until the early 1980s. MH63, which was developed from a cross between IR30 and Gui630 [1], is thus far the most widely used restorer line in China. Its popularity can be attributed to the fact of being a co-parent of ShanYou63, the largest hybrid rice acreage that has created substantial economic and social benefits. SH527 is a heavy-panicle restorer line bred in the 1990s [3]. More than 40
new elite hybrid rice varieties have been bred using SH527 as the male parent, among which 5 were chosen for super hybrid rice development. At present, many hybrid rice varieties generated from SH527 are widely grown in China. IR24, MH63, and SH527 thus represent the first-, second-, and third-generation restorer lines, respectively, of the three-line breeding system. Although they are all significant backbone parents at different stages of hybrid rice development, their field performances and combining abilities differ considerably. Further research on the genetic diversity of these lines, which might be related to their varying performances, can improve our understanding of restorer lines and promote improved restorer line selection and super hybrid rice breeding.
recombinant inbred lines by utilizing whole-genome re-sequencing data generated using the Illumina Genome Analyzer [8]. Six elite maize inbred lines, including the parents of the most productive commercial hybrid in China, were recently re-sequenced and more than 1,000,000 SNPs, 30,000 indel polymorphisms and 101 low-sequence-diversity chromosomal intervals were uncovered in the maize genome [9]. Huang et al. [10] identified approximately 3.6 million single-nucleotide polymorphisms (SNPs) by sequencing 517 rice landraces and constructed a high-density haplotype map of the rice genome. Moreover, they pioneered genome-wide
association studies for 14 agronomic traits of the O. sativa indica subspecies. Molecular marker screening has suggested narrow genetic backgrounds for rice restorer lines [11,12], which play a vital role in hybrid rice production. However, the current lack of information on genetic variation over the entire genome has limited further research into this topic. In the present study, we conducted re-sequencing and genome-wide variation analysis of IR24, MH63, and SH527 using the Solexa sequencing technology. Identification of genome-wide single-nucleotide polymorphisms (SNPs), insertion/deletion polymorphisms (InDels), and structural Figure 1. Plant phenotypes of the three core restorer lines and their cross genealogies.a, Plant phenotypes of the three core restorer lines; shown from left to right are IR24, MH63, and SH527. b, Cross genealogies of the three core restorer lines showing that MH63 and SH527 were indirectly generated from IR24. A new rice line (at the head of an arrow) was bred by crossing of two or more parents (at the tail of an arrow) and by several turns of subsequent selfing and selection. A straight line in the figure indicates a backcross.
variations (SVs) as well as pattern analysis among these lines has the potential to provide valuable resources for future genetic studies and the molecular improvement of hybrid rice.
Results
Field performances of the restorer lines and their hybrid descendants
IR24, MH63, and SH527 (Fig. 1A) are considered hybrid rice core restorer lines because of the large number of elite commercial hybrid rice cultivars and useful restorer lines bred and generated from them. Based on their cross genealogies, MH63 and SH527 were both indirectly generated from IR24 (Fig. 1B), indicating that these three lines originate from the same restoring genes. We examined the field performances of these lines by selfing (Table 1). Performances of the hybrid rice made by crossing these three lines with six other widely used CMS lines, namely, G3A, Zhongjiu A, II-32A, G46A, 92A, and Chuangu A, were also examined (Table 1). No obvious differences were found in the yield components of MH63 and IR24 except for plant height, while the hybrid rice of MH63 was significantly different from that of IR24 in growth period, plant height, panicles per plant and seed setting rate. Between SH527 and IR24, significant differences were detected in plant height, panicles per plant and 1000-grains weight. Significant differences between their hybrid rice were also detected in growth period, plant height, seed setting rate and 1000-grains weight. In general, from the breeding stage of IR24, MH63 to SH527, combinations of these changes lead to an apparent yield increase for hybrid rice, although no obvious yield differences were found in the restorer lines themselves. Since the yield increase was evaluated on the average performance of hybrid rice generated from these three restorer lines with several common CMS lines, the yield increase of hybrid rice reflect an obvious genetic improvement of the restorer lines, possibly by improving the combining ability of the restorer lines.
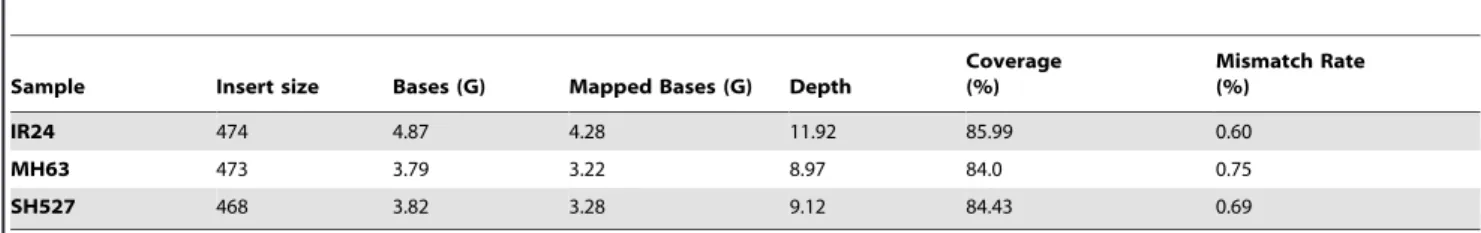
Genome sequencing and variation identification The genotypes of IR24, MH63, and SH527 were determined with approximately 10-fold coverage by genome sequencing using the Solexa sequencing technology. According to the protocol, three DNA libraries were constructed and 12.48 G bases were generated (raw sequence data obtained have been deposited in the NCBI Short Read Archive with accession number SRP006823). The alignment of reads was used to build consensus genome sequences for each rice accession. Furthermore, approximately 10.78 G high-quality raw databases were aligned with the reference sequence of cultivar 9311 using SOAPaligner [13] (http://soap.genomics.org.cn/). In total, an effective depth of 306
coverage was achieved, with an average of 106for each restorer line (Table 2). The resulting consensus sequence of each rice accession covered approximately 84.8% of the reference genome (84%–85.99%), indicating a close relationship between the samples and cultivar 9311.
SNPs, InDels, and SVs were then examined with SOAPsnp11 and SOAPsv using a conservative quality filter pipeline [14], yielding 267,383 SNPs from the genome of IR24, 288,764 SNPs from that of MH63, and 259,862 SNPs from that of SH527 (Table 3, http://rice.sicau.edu.cn/re-sequencing/variation/9311. rar). These outcomes resulted in a non-redundant collection of 568,787 SNPs after excluding the shared SNPs of each sample by synteny analysis (Fig. 2A–2C). In total, 100,095 InDels ranging from 1 to 5 bp in length and 5,561 SVs across the whole genome were identified. Because of inherent relationship between the samples, the overall genome diversity among these re-sequenced
elite restorer lines was much lower than that reported for a more diverse population [10], which is also in accordance with the close relationship among the three lines revealed by genealogy analysis. A phylogenetic tree [15] was constructed using several authentic collections of SNPs. An extremely closed genetic relationship was observed between sequencing samples, and a relatively distant relationship was observed between samples and the reference (Fig. 2D), which is consistent with a previously reported result of low genome diversity among rice restorer lines [11,12].
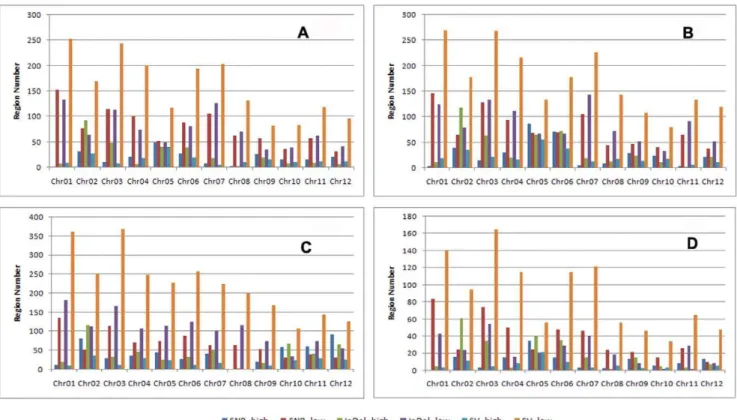
The frequencies of SNPs, InDels, and SVs for each sample were plotted at a 100 kb sliding window with a step size of 50 kb along each chromosome. SNP/InDel/SV frequency was defined as the corresponding number of SNPs/InDels/SVs divided by the number of nucleotides within the 100 kb interval, excluding the uncovered nucleotides. Each sample was compared with the corresponding intervals to identify regions that showed non-random variation frequencies. In total, 227/936 SNP high/low regions, 298/889 InDel high/low regions, and 188/1899 SV high/low regions were identified between IR24 and MH63; 339/ 914 SNP high/low regions, 440/1,030 InDel high/low regions, and 267/2,052 SV high/low regions were identified between IR24 and SH527; and 507/825 SNP high/low regions, 523/1,266 InDel high/low regions, and 235/2,684 SV high/low regions were identified between MH63 and SH527. Out of these, 135/450 SNP high/low regions, 229/297 InDel high/low regions, and 87/1,058 SV high/low regions were found to be identical among the three restorer lines (Figs. 3 and 4).
Variations between samples
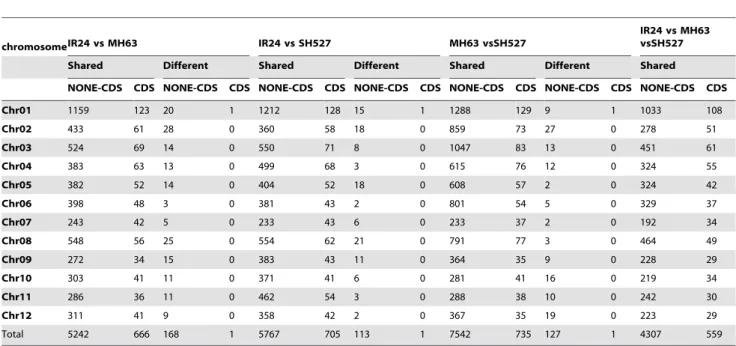
As differences between the samples (i.e., not between the samples and the reference) may reflect the genetic improvement of the recent restorer lines (such as SH527 and MH63) from older lines (such as IR24), an analysis of the variations and their distributions among the samples was performed. Synteny analysis of variations revealed 81,956 shared SNPs, 2,799 different SNPs, 24,053 shared InDels, and 860 different InDels between IR24 and MH63; 89,589 shared SNPs, 3,998 different SNPs, 26,936 shared InDels, and 634 different InDels between IR24 and SH527; and 129,364 shared SNPs, 2,927 different SNPs, 35,066 shared InDels, and 613 different InDels between MH63 and SH527. The distributions of these variations on each chromosome are showed in Table 4. Furthermore, only 10 different SNPs and 12 different InDels (allelic pleomorphic loci with different nucleotides in each line) were identified by the variation consensus comparative analysis of the three sequenced lines, although large numbers of shared SNPs and InDels were found (Table 5).
The SNPs in coding regions were analyzed to gain further insights into the potential functional effects of the detected SNPs (Table 6). Between IR24 and MH63, 13,160 shared SNPs, of which 2,290 were synonymous coding sequences (Syn CDS) and 2,902 were non-synonymous coding sequences (Non-syn CDS), and 291 different SNPs, of which 54 were Syn CDS and 99 were Non-syn CDS, were found. Between IR24 and SH527, 14,473 shared SNPs (2,522 Syn CDS and 3,366 Non-syn CDS) and 594 different SNPs (94 Syn CDS and 138 Non-syn CDS) were found in Table 2.Summary of original sequencing data.
Sample Insert size Bases (G) Mapped Bases (G) Depth
Coverage (%)
Mismatch Rate (%)
IR24 474 4.87 4.28 11.92 85.99 0.60
MH63 473 3.79 3.22 8.97 84.0 0.75
SH527 468 3.82 3.28 9.12 84.43 0.69
doi:10.1371/journal.pone.0030952.t002
Table 3.Variations detected for each sample.
Chromosome SNPs InDels SVs
IR24 MH63 SH527 IR24 MH63 SH527 IR24 MH63 SH527
Chr01 36,134 34,498 33,949 8,026 7,755 7,779 528 488 491
Chr02 25,139 36,400 29,835 5,258 8,064 6,868 215 274 246
Chr03 19,810 30,599 27,263 4,249 7,097 6,519 322 363 352
Chr04 19,042 26,016 22,324 3,413 4,986 4,259 273 276 284
Chr05 32,928 21,990 21,396 6,212 4,726 4,638 283 241 232
Chr06 16,015 24,585 25,190 3,187 4,880 5,247 233 261 262
Chr07 12,093 13,607 10,325 2,061 2,388 1,807 98 108 88
Chr08 29,097 27,334 26,804 5,564 5,501 5,491 423 382 390
Chr09 17,905 13,685 13,451 3,657 2,723 2,891 153 115 120
Chr10 21,873 16,421 14,736 4,281 3,315 3,105 269 201 189
Chr11 19,377 19,470 16,873 3,472 3,625 3,329 297 267 252
Chr12 17,970 24,159 17,716 3,467 4,598 3,567 192 250 221
Total 267,383 288,764 259,862 52,847 59,658 55,500 3,286 3,226 3,127
coding regions. Moreover, 22,096 shared SNPs (3,517 Syn CDS and 4,738 Non-syn CDS) and 417 different SNPs (76 Syn CDS and 97 Non-syn CDS) were found between MH63 and SH527. In total, 666, 705 and 735 shared CDS-located InDels were found between IR24 and MH63, IR24 and SH527, and MH63 and SH527, respectively (Table 7). Different CDS-located InDels were not detected.
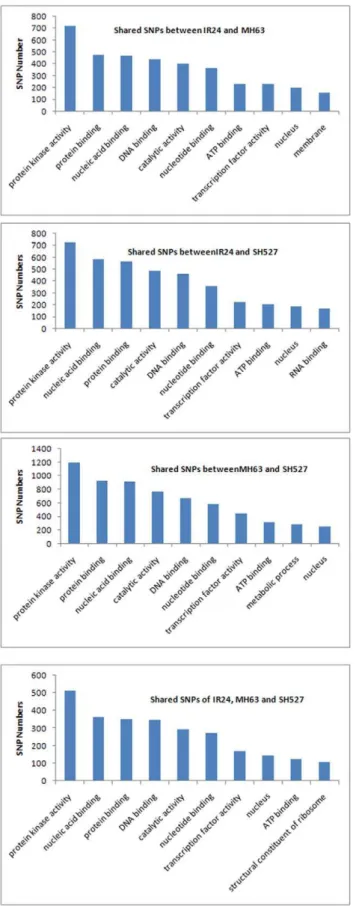
Three hundred thirty-one large-effect SNPs that were expected to affect the integrity of encoded proteins were also identified. These included changes introduced by premature termination codons (premature termination; 238 SNPs), elimination of translation initiation sites (ATG change; 11 SNPs), and replace-ment of nonsense with sense codons (stop change; 82 SNPs). Of these large-effect SNPs, only 10 SNPs (2 ATG changes, 5 premature terminations, and 3 stop changes) were observed from the different SNPs; the rest were from the shared SNPs (Table 8). GO and PFAM analyses were further carried out for the shared and different SNPs (InDels) in genes between samples to explore gene functions. In both the shared and different SNPs (InDels), the top GOs were protein kinase activity, nucleic acid binding, protein binding, DNA binding, and catalytic activity (Fig. 5 and 6). Genes coding for leucine-rich repeats and NB-ARC domains were found to have a significantly higher ratio of nonsynonymous-to-synonymous SNPs than average. As these domains are common in proteins that mediate disease resistance in plants, our finding is consistent with these proteins being particularly diverse due to pathogen pressure.
Variation analysis on important rice genes
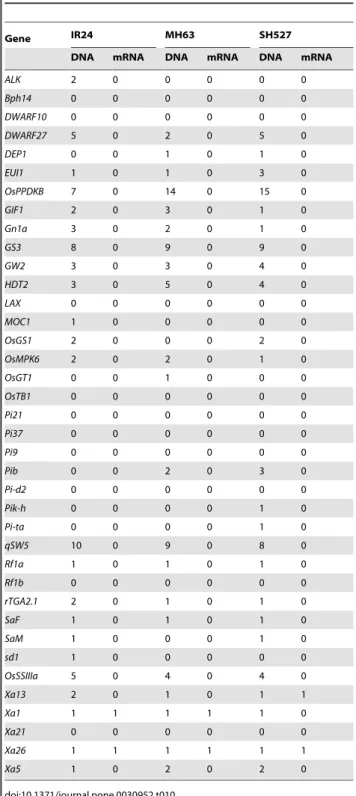
Several important rice genes related to yield, quality, resistance, and development processes were subjected to molecular cloning and functional analysis. Natural variations among the genes, which might explain the phenotypic differences of the sequenced sample, were then evaluated. A large number of SNPs (Table 9) were detected both in the DNA sequence and in the coding regions of genes related to disease/insect resistance, such as Pib
[16],Xa1[17], Pi9[18], Xa21[19],Xa26[20] and Bph14[21]. Although found to have many SNPs, genes related to rice developmental processes, yield, and quality, such as ALK [22], qSW5[23],GS3[24],Gn1a[25],HTD2[26],GW2[27] andEUI1 [28], had rare or no variations in the coding regions, which might explain the functional conservation. In addition, only a few InDels (or none in some cases) were found in the coding regions (Table 10), suggesting that SNPs, not InDels, effectively contribute to functional variation of the genes. When compared to the 9311 sequence, a number of SNPs were found both in the DNA sequence (,60) and in the coding regions (,40) ofRf1a [29], a possible allelic gene forRf4[30], which is the major restoring gene of the WA-CMS line, while the sequence difference in this gene between the sequencing samples was limited. These variations may account for the differences between the sequenced samples (restorer lines) and the reference cultivar 9311(non-restorer lines) in terms of their restoring ability.
Discussion
In the present study, we conducted re-sequencing and genome-wide variation analysis of three famous representative restorer lines, namely IR24, MH63, and SH527, with the aim of uncover genetic variation at a genome-wide scale by using the Solexa sequencing technology. Identification of genome-wide SNPs, InDels, and SVs, as well as pattern analysis of restorer lines can provide valuable resources for future genetic studies and the molecular improvement of hybrid rice.
We firstly used the 9311 [5] andNipponbare[4] sequence as the reference genome, respectively. The genome size of 9311 is 374,545,499, of which the effective size is 359,401,158 (excluding the N bases in the reference). On the other hand, the genome size of Nipponbare is 382,150,945, of which the effective size is 372,089,805. When the Nipponbare genome was used as the reference, the number of SNPs detected was noticeably higher (data not shown). However, quality of original sequence data such as mapped bases, sequencing depth, and coverage decreased, Figure 2. Shared variation clusters among IR24, MH63, and SH527 and phylogenetic tree analysis.a–c, Synteny analysis results for (a) SNPs, (b) InDels, and (c) SVs. d, Phylogenetic tree constructed by authentic collections of SNPs.
rendering the SNP data less reliable. Given that genetic variations between restorer lines, not the japonica and indica rice varieties, underlie the mechanism of their phenotypic differences, the 9311
genome sequence was then used as the only reference for detecting SNPs, InDels, and SVs, and for assembling the consensus sequence to exclude the large amount of background variations Figure 3. Comparative distributions of variation frequency on 12 chromosomes.s1, IR24; S2, MH63; S3,SH527.
Figure 4. High and low regions of variation between samples.a, IR24 vs. MH63. b, IR24 vs. SH527. c, MH63 vs. SH527. d, IR24 vs. MH63 vs. SH527.
doi:10.1371/journal.pone.0030952.g004
Table 4.Variations detected between each sample.
Chromosome SNPs InDels
IR24 vs MH63 MH63 vs SH527 IR24 vs SH527 IR24 vs MH63 MH63 vs SH527 IR24 vs SH527
Shared Different Shared Different Shared Different Shared Different Shared Different Shared Different
Chr01 16776 364 17425 437 20167 191 5107 86 5380 70 5761 26
Chr02 6207 331 5548 470 13209 586 1833 162 1717 97 3747 170
Chr03 6268 216 6708 275 15437 333 2191 66 2410 51 4699 54
Chr04 5813 257 7138 618 11451 275 1597 49 2184 19 2732 41
Chr05 7075 239 7400 208 10666 121 2056 73 2058 88 3045 28
Chr06 5042 211 4631 229 13302 150 1663 17 1518 22 3541 23
Chr07 3697 92 3412 181 3964 169 1063 22 1017 15 979 17
Chr08 10698 271 10938 335 16565 109 2745 132 2847 117 4227 14
Chr09 3961 164 5089 398 6062 261 1218 56 1693 49 1655 32
Chr10 4809 234 5513 275 5085 152 1514 57 1808 50 1381 56
Chr11 5407 194 9257 150 6440 163 1430 71 2406 22 1594 58
Chr12 6203 226 6530 422 7016 417 1636 69 1898 34 1705 94
Total 81956 2799 89589 3998 129364 2927 24053 860 26936 634 35066 613
that account for differences between the japonica and indica rice varieties.
Interestingly, approximately 76,000, 71,000, and 76,000 heterozygous SNPs in IR24, MH63, and SH527, respectively, were identified throughout the whole rice genome, leading to an estimated heterozygosity rate of approximately 1.98–2.061024,
which is lower than that for other species, such as pandas [31] and humans [32]. The heterozygosity rate showed, to some extent, an un-purified genetic background of the sequenced rice varieties and indicated that the rice restorer lines still have high genetic variability, supporting the sporadic phenotypic variability of individuals observed within a rice line, even it is strictly self-pollinated. Thus we may speculate that, besides spontaneous mutations, genomic heterozygosity might also play a role in phenotypic variations. These results might also suggest that self-pollinated plants have the potential to maintain a relatively high heterozygosity rate. More plant lines should be studied to confirm this idea.
Here we report variations over the whole genome among elite rice restorer lines. Our results indicate that genetic variations among these lines, although far lower than those reported for a more diverse landrace population [10], are greater than expected, indicating a complicated genetic basis for the phenotypic diversity of the restorer lines. Although several candidate genes have been proposed to account for the varying performances of rice lines and selected for functional analysis, further analysis of more restorer lines is necessary to better understand the mechanism by which restorer lines are improved by breeding. Furthermore, several follow-up steps can be taken to pinpoint candidate genes that may contribute to phenotypic diversity in rice cultivars. This study therefore lays the groundwork for long-term efforts to uncover genes and alleles important for cultivar improvement in rice restorer lines.
Materials and Methods
Sampling
Seedlings of IR24, MH63, and SH527 and six other widely used CMS lines, namely, G3A, Zhongjiu A, II-32A, G46A, 92A, and Table 5.Three sequenced lines shared/different variations.
Chromosome SNPs InDels
Shared Different Shared Different
Chr01 12245 0 4336 0
Chr02 3255 2 1197 2
Chr03 4313 1 1841 2
Chr04 4082 2 1331 1
Chr05 4645 0 1592 0
Chr06 3141 1 1275 0
Chr07 2112 0 750 1
Chr08 7665 1 2339 0
Chr09 2493 0 979 0
Chr10 2460 0 965 5
Chr11 3772 2 1216 0
Chr12 3504 1 1121 1
Total 53687 10 18942 12
Chuangu A, were planted in the experimental field of the Rice Research Institute, Sichuan Agricultural University, Wenjiang. When they reached the flowering stage, these three restorer lines were crossed with the six CMS lines to obtain the F1hybrid rice.
The three elite restorer lines, together with the F1hybrid rice, were
then planted in the following year for phenotypic evaluation and field test. All the restorer lines and the F1hybrid rice were planted
across 20 lines, with three replicates totaling 12 plants in each line. Eight middle plants of the 10 middle lines were surveyed, and data were recorded for statistical analysis. To compare the field performances of these elite restorer lines, we used a One-way ANOVA and LSD’s test of DPS Software (http://www.chinadps.
net/index.htm). To compare the contribution of restorer lines to their hybrids’ field performances, we used a Two-way ANOVA and LSD’s test of DPS Software (http://www.chinadps.net/index. htm) [33].
DNA isolation and genome sequencing
Total genomic DNA was extracted from the leaf tissues of one individual for each line using a DNeasy Plant Mini Kit (Qiagen). The DNA of each line was then randomly fragmented. After electrophoresis, DNA fragments of the desired length were gel-purified. Adapter ligation and DNA cluster preparation were performed and subjected to Solexa sequencing.
Table 7.None-CDS and CDS located InDels variations between samples.
chromosomeIR24 vs MH63 IR24 vs SH527 MH63 vsSH527
IR24 vs MH63 vsSH527
Shared Different Shared Different Shared Different Shared
NONE-CDS CDS NONE-CDS CDS NONE-CDS CDS NONE-CDS CDS NONE-CDS CDS NONE-CDS CDS NONE-CDS CDS
Chr01 1159 123 20 1 1212 128 15 1 1288 129 9 1 1033 108
Chr02 433 61 28 0 360 58 18 0 859 73 27 0 278 51
Chr03 524 69 14 0 550 71 8 0 1047 83 13 0 451 61
Chr04 383 63 13 0 499 68 3 0 615 76 12 0 324 55
Chr05 382 52 14 0 404 52 18 0 608 57 2 0 324 42
Chr06 398 48 3 0 381 43 2 0 801 54 5 0 329 37
Chr07 243 42 5 0 233 43 6 0 233 37 2 0 192 34
Chr08 548 56 25 0 554 62 21 0 791 77 3 0 464 49
Chr09 272 34 15 0 383 43 11 0 364 35 9 0 228 29
Chr10 303 41 11 0 371 41 6 0 281 41 16 0 219 34
Chr11 286 36 11 0 462 54 3 0 288 38 10 0 242 30
Chr12 311 41 9 0 358 42 2 0 367 35 19 0 223 29
Total 5242 666 168 1 5767 705 113 1 7542 735 127 1 4307 559
doi:10.1371/journal.pone.0030952.t007
Table 8.large-effect SNPs between samples.
Chromosome IR24 vs MH63 IR24 vs SH527 MH63 vsSH527 IR24 vs MH63 vs SH527
ATG change
Premature STOP
STOP change
ATG change
Premature STOP
STOP change
ATG change
Premature STOP
STOP change
ATG change
Premature STOP
STOP change
Chr01 0 8 3 0 8 4 0 12 4 0 7 2
Chr02 4 3 3 1 2 1 0 4 3 0 0 1
Chr03 1 5 2 1 7 2 0 13 4 0 4 2
Chr04 0 4 3 1 6 3 0 8 3 0 3 2
Chr05 0 7 1 0 9 1 0 5 4 0 5 1
Chr06 0 2 0 0 3 0 0 5 0 0 1 0
Chr07 0 1 0 0 0 0 0 2 0 0 0 0
Chr08 0 6 2 0 9 2 0 14 2 0 5 2
Chr09 0 5 1 0 7 1 0 6 2 0 3 1
Chr10 0 6 3 0 7 1 1 5 3 0 3 1
Chr11 0 2 2 0 6 3 0 2 2 0 0 1
Chr12 0 1 1 0 5 0 0 6 0 0 1 0
Total 5 50 21 3 69 18 1 82 27 0 32 13
Read mapping
The raw pair-end (PE) sequencing reads were aligned to the 9311 reference genome sequence using SOAPaligner [13] under the following conditions: if an original read cannot be aligned to
the reference sequence, the first nucleotide from the 59 end and two nucleotides from the 39end will be deleted and then realigned to the reference. If the alignment still cannot be achieved, two more nucleotides from the 39end will be deleted. The procedure Figure 6. Top 10 GOs of InDels detected between samples.
was repeated until the alignment was available or the read was less than 27 bp long. Average sequencing depth and coverage were calculated using the alignment results.
Assembly of consensus sequences and SNP/InDel detection
Based on the alignment results, and taking into consideration the analysis of data characters, sequencing quality, and other factors influencing the experiments, a Bayesian model was applied
to calculate the probability of genotypes with the actual data. The genotype with the highest probability was selected as the genotype of the sequencing individual at a specific locus, and a quality value was designated accordingly to reveal the accuracy of the genotype. Polymorphic loci against the reference sequence were selected from the consensus sequence and then filtered under certain requirements (e.g., the quality value must be greater than 20 and the result must be supported by at least two reads) using SOAPsnp [14]. Mapped reads that satisfied the PE requirements and Table 9.Cloned rice gene SNP detect in IR24, MH63 and
SH527.
Gene IR24 MH63 SH527
DNA mRNA DNA mRNA DNA mRNA
ALK 10 0 4 0 3 0
Bph14 16 8 5 3 7 6
DWARF10 3 12 1 7 0 0
DWARF27 15 5 10 5 13 5
DEP1 10 1 7 0 6 0
EUI1 5 0 3 0 9 0
OsPPDKB 24 3 38 1 34 2
GIF1 13 2 8 1 5 1
Gn1a 11 0 9 0 8 0
GS3 23 0 19 0 17 0
GW2 11 1 12 1 10 0
HTD2 8 0 6 0 9 0
LAX 1 1 0 0 0 0
MOC1 3 1 11 1 13 2
OsGS1 3 0 3 0 3 0
OsMPK6 6 0 4 0 4 0
OsGT1 18 0 13 0 16 0
OsTB1 0 0 1 1 1 1
Pi21 1 0 0 0 1 0
Pi37 7 0 2 2 7 5
Pi9 21 0 21 20 19 19
Pib 39 0 53 35 41 22
Pi-d2 14 0 14 0 17 0
Pik-h 7 7 1 1 1 1
Pi-ta 9 1 5 1 5 1
qSW5 47 0 27 0 41 0
Rf1a 63 40 60 36 65 37
Rf1b 2 2 5 4 2 1
rTGA2.1 6 2 8 3 7 3
SaF 5 2 4 0 5 2
SaM 9 0 5 0 6 0
sd1 1 0 0 0 1 0
OsSSIIIa 25 0 22 5 23 3
Xa13 7 0 3 0 6 0
Xa1 18 12 32 25 33 20
Xa21 11 10 29 29 10 11
Xa26 20 0 14 16 10 8
Xa5 28 0 20 0 27 0
doi:10.1371/journal.pone.0030952.t009
Table 10.Cloned rice gene InDel detect in IR24, MH63 and SH527.
Gene IR24 MH63 SH527
DNA mRNA DNA mRNA DNA mRNA
ALK 2 0 0 0 0 0
Bph14 0 0 0 0 0 0
DWARF10 0 0 0 0 0 0
DWARF27 5 0 2 0 5 0
DEP1 0 0 1 0 1 0
EUI1 1 0 1 0 3 0
OsPPDKB 7 0 14 0 15 0
GIF1 2 0 3 0 1 0
Gn1a 3 0 2 0 1 0
GS3 8 0 9 0 9 0
GW2 3 0 3 0 4 0
HDT2 3 0 5 0 4 0
LAX 0 0 0 0 0 0
MOC1 1 0 0 0 0 0
OsGS1 2 0 0 0 2 0
OsMPK6 2 0 2 0 1 0
OsGT1 0 0 1 0 0 0
OsTB1 0 0 0 0 0 0
Pi21 0 0 0 0 0 0
Pi37 0 0 0 0 0 0
Pi9 0 0 0 0 0 0
Pib 0 0 2 0 3 0
Pi-d2 0 0 0 0 0 0
Pik-h 0 0 0 0 1 0
Pi-ta 0 0 0 0 1 0
qSW5 10 0 9 0 8 0
Rf1a 1 0 1 0 1 0
Rf1b 0 0 0 0 0 0
rTGA2.1 2 0 1 0 1 0
SaF 1 0 1 0 1 0
SaM 1 0 0 0 1 0
sd1 1 0 0 0 0 0
OsSSIIIa 5 0 4 0 4 0
Xa13 2 0 1 0 1 1
Xa1 1 1 1 1 1 0
Xa21 0 0 0 0 0 0
Xa26 1 1 1 1 1 1
Xa5 1 0 2 0 2 0
contained alignment gaps at one end were also used to detect the short InDels. The maximum gap length allowed in the alignments was 5 bp. Gaps that were supported by at least three gapped PE reads were extracted in InDel calling.
SV detection
According to the principle of PE sequencing, under normal situations, one read of PE should be aligned to the forward sequence and another should be aligned to the reverse. The distance between the two aligned positions at the reference should be in accordance with the insert size. Thus, the alignment of the two paired reads to the genome is regarded to be of normal direction and appropriate span. If the direction or span of the alignments of the two paired reads is different from that expected, then the region might have SVs. Abnormal PE alignments observed in our analysis were further analyzed by clustering and compared with previously defined SVs. In this manner, the SVs were detected using SOAPsv [14], with support from at least three abnormal PE reads. Currently, the types of SVs that can be detected include deletion, replication, reversion, and transposition, among others.
SNP annotation
The localization of SNPs in coding regions, noncoding regions, start codons, stop codons, and splice sites were based on the annotation of gene models provided by the Rice Genome Sequencing Project of 9311 [34]. The characterization of synonymous or non-synonymous status of SNPs within the CDS was conducted using Genewise version 30 [35]. The GO/PFAM annotation data were further used to functionally annotate each gene [36].
Variation frequency distribution
The frequencies of SNPs, InDels, and SVs for each sample were plotted over a 100 kb sliding window with a step size of 50 kb along each chromosome to explore the genomic distribution of DNA polymorphism in these lines [37]. The scanned regions were defined as high- or low-variation frequency regions if variation rates were higher than 4 fold or lower than 1/20th of the average rate over the whole genome (ARG), respectively. The deviation ratio (DR) of samples in a given window was first calculated as the sum of the ratio of each sample that deviated from the average rate, then the ARG was defined as the arithmetic average of all the windows across chromosomes.
Variations between samples
The SNPs/InDels/SVs detected for each individual line were further compared between samples to identify the shared and unique SNP/InDel loci. Only those loci for which at least one effective sequence read was mapped for every individual were selected for comparison. A phylogenetic tree was constructed using the MEGA4 software [15] based on these data on SNPs.
Acknowledgments
We thank the faculty and staff of the Beijing Genomics Institute, Shenzhen, for helping with data analysis. We also thank Dacheng Tian, Sihai Yang, and Long Wang of Nanjing University for providing technical assistance.
Author Contributions
Conceived and designed the experiments: PL. Performed the experiments: SL SW AZ JZ LX CY QD. Analyzed the data: SL PL. Contributed reagents/materials/analysis tools: FG BH PA XC TZ. Wrote the paper: SL PL. Collected samples and performed the phenotyping: HL LW.
References
1. Xie H, Luo J, Zhang S, Zheng J, Lin M, et al. (1994) Breeding of Restorer Lines in Indica Hybrid Rice. Hybrid Rice 3: 31–33.
2. Chen S (2000) Current Status and Prospect in the Development of Breeding Materials and Breeding Methodology of Hybrid Rice. Chinese Joural of Rice science 14: 165–169.
3. Wang Y, Li S, Li H, Gao K (2004) Breeding and Utilization of Restorer Line Shuhui 527 with Good Grain Quality and High Combining Ability in Grain Yield. Hybrid Rice 19: 12–14.
4. Goff SA, Ricke D, Lan TH, Presting G, Wang R, et al. (2002) A draft sequence of the rice genome (Oryza sativa L. ssp. japonica). Science 296: 92–100. 5. Yu J, Hu S, Wang J, Wong GK, Li S, et al. (2002) A draft sequence of the rice
genome (Oryza sativa L. ssp. indica). Science 296: 79–92.
6. Craig DW, Pearson JV, Szelinger S, Sekar A, Redman M, et al. (2008) Identification of genetic variants using bar-coded multiplexed sequencing. Nat Methods 5: 887–893.
7. Cronn R, Liston A, Parks M, Gernandt DS, Shen R, et al. (2008) Multiplex sequencing of plant chloroplast genomes using Solexa sequencing-by-synthesis technology. Nucleic Acids Research 36: e122.
8. Huang X, Feng Q, Qian Q, Zhao Q, Wang L, et al. (2009) High-throughput genotyping by whole-genome resequencing. Genome Research 19: 1068–1076. 9. Lai J, Li R, Xu X, Jin W, Xu M, et al. (2010) Genome-wide patterns of genetic
variation among elite maize inbred lines. Nature Genetics 42: 1027–1030. 10. Huang X, Wei X, Sang T, Zhao Q, Feng Q, et al. (2010) Genome-wide association
studies of 14 agronomic traits in rice landraces. Nat Genet 42: 961–967. 11. Liu S, Cheng H, Wang F, Zhu Y (2002) DNA Polymorphism of Main Restorer
Lines of Hybrid Rice in China. Chinese Joural of Rice science 16: 1–5. 12. Duan S, Mao J, Zhu Y (2002) Genetic Variation of Main Restorer Lines of
Hybrid Rice in China Was ReVealed by Microsatellite Markers. Acta Genetica Sinica 29: 250–254.
13. Li R, Li Y, Kristiansen K, Wang J (2008) SOAP: short oligonucleotide alignment program. Bioinformatics 24: 713–714.
14. Li R, Li Y, Fang X, Yang H, Wang J, et al. (2009) SNP detection for massively parallel whole-genome resequencing. Genome Res 19: 1124–1132.
15. Tamura K, Dudley J, Nei M, Kumar S (2007) MEGA4: Molecular Evolutionary Genetics Analysis (MEGA) Software Version 4.0. Molecular Biology and Evolution 24: 1596–1599.
16. Wang ZX, Yano M, Yamanouchi U, Iwamoto M, Monna L, et al. (1999) The Pib gene for rice blast resistance belongs to the nucleotide binding and leucine-rich repeat class of plant disease resistance genes. Plant J 19: 55–64.
17. Yoshimura S, Yamanouchi U, Katayose Y, Toki S, Wang Z-X, et al. (1998) Expression of Xa1, a bacterial blight-resistance gene in rice, is induced by bacterial inoculation. Proceedings of the National Academy of Sciences 95: 1663–1668.
18. Qu S, Liu G, Zhou B, Bellizzi M, Zeng L, et al. (2006) The Broad-Spectrum Blast Resistance Gene Pi9 Encodes an NBS-LRR Protein and is a Member of a Multigene Family in Rice. Genetics: genetics.105.044891.
19. Song W-Y, Wang G-L, Chen L-L, Kim H-S, Pi L-Y, et al. (1995) A Receptor Kinase-Like Protein Encoded by the Rice Disease Resistance Gene, Xa21. Science 270: 1804–1806.
20. Sun X, Cao Y, Yang Z, Xu C, Li X, et al. (2004) Xa26, a gene conferring resistance to Xanthomonas oryzae pv. oryzae in rice, encodes an LRR receptor kinase-like protein. Plant J 37: 517–527.
21. Du B, Zhang W, Liu B, Hu J, Wei Z, et al. (2009) Identification and characterization of Bph14, a gene conferring resistance to brown planthopper in rice. Proc Natl Acad Sci U S A 106: 22163–22168.
22. Gao Z, Zeng D, Cui X, Zhou Y, Yan M, et al. (2003) Map-based cloning of the ALK gene, which controls the gelatinization temperature of rice. Science China Life Sciences 46: 661–668.
23. Shomura A, Izawa T, Ebana K, Ebitani T, Kanegae H, et al. (2008) Deletion in a gene associated with grain size increased yields during rice domestication. Nat Genet 40: 1023–1028.
24. Fan C, Xing Y, Mao H, Lu T, Han B, et al. (2006) GS3, a major QTL for grain length and weight and minor QTL for grain width and thickness in rice, encodes a putative transmembrane protein. Theor Appl Genet 112: 1164–1171. 25. Ashikari M, Sakakibara H, Lin S, Yamamoto T, Takashi T, et al. (2005)
Cytokinin oxidase regulates rice grain production. Science 309: 741–745. 26. Liu W, Wu C, Fu Y, Hu G, Si H, et al. (2009) Identification and characterization
of HTD2: a novel gene negatively regulating tiller bud outgrowth in rice. Planta 230: 649–658.
27. Song XJ, Huang W, Shi M, Zhu MZ, Lin HX (2007) A QTL for rice grain width and weight encodes a previously unknown RING-type E3 ubiquitin ligase. Nat Genet 39: 623–630.
28. Zhu Y, Nomura T, Xu Y, Zhang Y, Peng Y, et al. (2006) ELONGATED UPPERMOST INTERNODE Encodes a Cytochrome P450 Monooxygenase That Epoxidizes Gibberellins in a Novel Deactivation Reaction in Rice. The Plant Cell 18: 442–456.
Restored by Two Related PPR Motif Genes via Distinct Modes of mRNA Silencing. The Plant Cell Online 18: 676–687.
30. Ahmadikhah A, Karlov GI (2006) Molecular mapping of the fertility-restoration gene Rf4 for WA-cytoplasmic male sterility in rice. Plant Breeding 125: 363–367.
31. Li R, Fan W, Tian G, Zhu H, He L, et al. (2009) The sequence and de novo assembly of the giant panda genome. Nature 463: 311–317.
32. Wang J, Wang W, Li R, Li Y, Tian G, et al. (2008) The diploid genome sequence of an Asian individual. Nature 456: 60–65.
33. Tang Q, Feng M (2007) DPS Data processing system: Experimental design, statistical analysis, and data mining. Beijing: Science Press. 528 p.
34. Zhao W, Wang J, He X, Huang X, Jiao Y, et al. (2004) BGI-RIS: an integrated information resource and comparative analysis workbench for rice genomics. Nucleic Acids Research 32: D377–D382.
35. Birney E (2004) GeneWise and Genomewise. Genome Research 14: 988–995. 36. Ouyang S, Zhu W, Hamilton J, Lin H, Campbell M, et al. (2007) The TIGR
Rice Genome Annotation Resource: improvements and new features. Nucleic Acids Res 35: D883–887.