www.atmos-chem-phys.net/12/3951/2012/ doi:10.5194/acp-12-3951-2012
© Author(s) 2012. CC Attribution 3.0 License.
Chemistry
and Physics
Characterisation of sub-micron particle number concentrations
and formation events in the western Bushveld Igneous Complex,
South Africa
A. Hirsikko1,2, V. Vakkari2, P. Tiitta3,4, H. E. Manninen2, S. Gagn´e2,*,**, H. Laakso2, M. Kulmala2, A. Mirme5, S. Mirme5, D. Mabaso6, J. P. Beukes4, and L. Laakso1,4
1Finnish Meteorological Institute, Research and Development, P.O. Box 503, 00101, Finland 2Department of Physics, University of Helsinki, P.O. Box 64, University of Helsinki, 00014, Finland 3University of Eastern Finland, PL 1627, 70211, Kuopio, Finland
4School of Physical and Chemical Sciences, North-West University, Potchefstroom, South Africa 5Institute of Physics, University of Tartu, 18 ¨Ulikooli Str., 50090 Tartu, Estonia
6Rustenburg Local Municipality, Rustenburg, South Africa
*now at: Environment Canada, Toronto, Ontario, M3H5T4, Canada **now at: Dalhousie University, Halifax, Nova Scotia, B3H3J5, Canada
Correspondence to:A. Hirsikko ([email protected])
Received: 10 January 2012 – Published in Atmos. Chem. Phys. Discuss.: 20 January 2012 Revised: 3 April 2012 – Accepted: 13 April 2012 – Published: 4 May 2012
Abstract.South Africa holds significant mineral resources, with a substantial fraction of these reserves occurring and being processed in a large geological structure termed the Bushveld Igneous Complex (BIC). The area is also highly populated by informal, semi-formal and formal residential developments. However, knowledge of air quality and re-search related to the atmosphere is still very limited in the area. In order to investigate the characteristics and processes affecting sub-micron particle number concentrations and for-mation events, air ion and aerosol particle size distributions and number concentrations, together with meteorological pa-rameters, trace gases and particulate matter (PM) were mea-sured for over two years at Marikana in the heart of the west-ern BIC. The observations showed that trace gas (i.e. SO2,
NOx, CO) and black carbon concentrations were relatively
high, but in general within the limits of local air quality standards. The area was characterised by very high conden-sation sink due to background aerosol particles, PM10 and
O3 concentration. The results indicated that high amounts
of Aitken and accumulation mode particles originated from domestic burning for heating and cooking in the morning and evening, while during daytime SO2-based nucleation
fol-lowed by the growth by condensation of vapours from
in-dustrial, residential and natural sources was the most prob-able source for large number concentrations of nucleation and Aitken mode particles. Nucleation event day frequency was extremely high, i.e. 86 % of the analysed days, which to the knowledge of the authors is the highest frequency ever reported. The air mass back trajectory and wind direction analyses showed that the secondary particle formation was influenced both by local and regional pollution and vapour sources. Therefore, our observation of the annual cycle and magnitude of the particle formation and growth rates dur-ing nucleation events were similar to results previously pub-lished for a semi-clean savannah site in South Africa.
1 Introduction
threat for the population (e.g. Pope and Dockery, 2006; Rus-sell and Brunekreef, 2009; Breitner et al., 2011).
Particle sources and formation mechanisms have been in-tensively studied (e.g. Kulmala et al., 2004, 2011), but the number of observations in the developing world is still very limited. Previously, such observations have been carried out in Mexico City (Mexico), Beijing (China), New Delhi (In-dia), Gaborone (Botswana) (e.g. Jayaratne and Verma, 2001; Dunn et al., 2004; M¨onkk¨onen et al., 2004, 2005; Yue et al., 2009; Wu et al., 2008, 2011; Kalafut-Pettibone et al., 2011) and a few other sites. To our knowledge, there are no pre-vious observations of ultrafine particle number concentra-tions or size distribuconcentra-tions from residential areas in southern Africa. However, in a relatively clean background savannah area in South Africa new particle formation has been stud-ied by Laakso et al. (2008) and Vakkari et al. (2011). These studies revealed new particle formation taking place every sunny day throughout the year. As new particle formation was found to be a regional phenomenon (Laakso et al., 2008; Vakkari et al., 2011), it is expected that new particle forma-tion will also occur in polluted areas.
South Africa holds major mineral assets. A significant pro-portion of these reserves are located in a geological struc-ture known as the Bushveld Igneous Complex (BIC), out of which ca. 80 % and 45 % of the world’s platinum group metals (PGMs) and chromium, respectively, are produced (Cramer et al., 2004; Xiao and Laplante, 2004; Beukes et al., 2010). The most important use of PGMs is for the produc-tion of catalytic converters in automotive exhaust systems, which improve air quality. The chromium produced in this region is mostly in the form of ferrochrome (a crude alloy between iron and chromium), which in turn is mostly used for the production of stainless steel, a vital modern alloy. The BIC is divided into five different limbs, of which the western limb is the most intensely mined and industrialised. In a re-cent study it has been proposed that the western BIC should be declared as an air pollution hotspot by the South African government (Scott, 2010). However, notwithstanding the in-ternational importance of the western BIC in terms of the supply of commodities critical for the modern day society, nor the afomentioned indication that air quality in this re-gion might be problematic, very little has been published in the peer reviewed scientific literature on atmospheric related matters for the western BIC.
Due to the lure of employment in the mining and met-allurgical sectors in the western BIC, the area is populated by informal and semi-formal settlements. The observations discussed in this paper were carried out in a semi-informal and informal residential area at Marikana village in the heart of the western BIC, as part of an atmospheric research and air quality monitoring project initiated in 2006 (Laakso et al., 2008). Recently, Venter et al. (2012) analysed sources and temporal variation of gaseous compounds and particu-late matter (PM10)at Marikana. The aims of this work were
to investigate the characteristic behaviour of sub-micron
par-ticles by investigating ion and particle concentrations, as well as new particle formation based on nucleation event classi-fication, formation and growth rate analyses. As far as the authors could asses, this is the first paper investigating sub-micron and ultrafine particle characteristics and new particle formation in this internationally important area. Addition-ally, the measurement site also afforded the opportunity to investigate the interaction of pollution from semi-formal and informal settlements, with that of mining and pyrometallur-gical industries.
2 Site description
The measurements at Marikana (25◦41′54.51′′S and
27◦28′50.05′′E, 1170 m a.s.l.) were carried out from 8
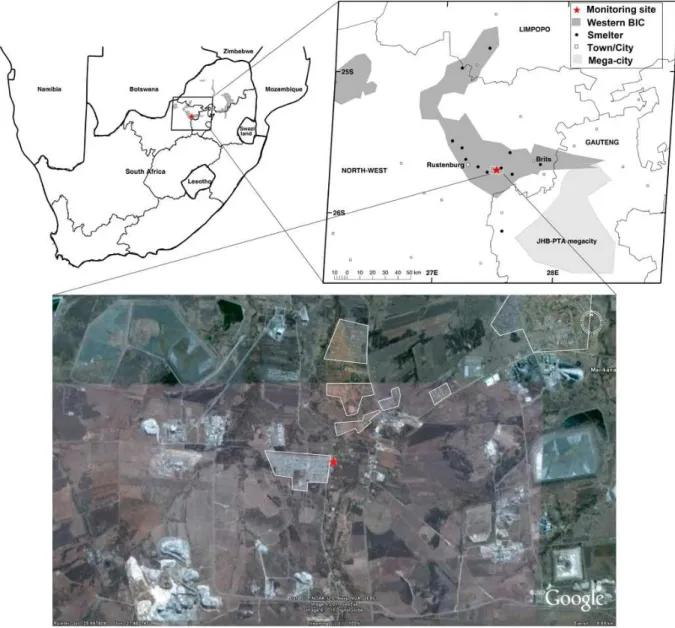
Febru-ary 2008 to 17 May 2010. Venter et al. (2012) gave a detailed description of the measurement site and its location, which is therefore not repeated here. In general, the Rustenburg-Brits mining and residential area is located in a shallow valley sur-rounded by mountains rising 500 m above the central area. The valley is approximately 60 km long in west-east direc-tion and 20–30 km wide in north-south direcdirec-tion. Figure 1 shows the location of Marikana within a regional context. The extent of the BIC in central South Africa and the loca-tion of major point sources (i.e. pyrometallurgical smelters) within the western BIC are also indicated in Fig. 1. Addition-ally, the Google image shows the immediate surroundings of the measurement site. The distributions of semi-formal and informal settlements in the immediate vicinity of the mea-surement site are indicated on this image with white blocks.
On the Highveld of South Africa two distinct seasonal pe-riods can be identified, i.e. dry and wet pepe-riods, from May to September and October to April, respectively. The dry period (winter and adjacent months on autumn and spring) is char-acterised by cold nights and low relative humidity with no rain for several months, while during the wet period (summer and adjacent months in autumn and spring) the air is warm and heavy rains, especially in the form of thunderstorms, oc-cur.
3 Measurements
Fig. 1.A geographical map of southern Africa indicating the extent of the Bushveld Igneous Complex (BIC, in grey). The enlarged section of the geographical map indicates the western BIC, the proximity of the Johannesburg/Pretoria mega-city and the location of major point sources (pyrometallurgical smelters) in the western BIC. The Google map indicates the immediate surroundings of the measurement site (25◦41′54.51′′S and 27◦28′50.05′′E). The white outlined blocks indicate the occurrence of informal and semi-formal residential settlements in-between the mining and metallurgical industries.
3.1 Ion and particle size distribution measurements
An Air Ion Spectrometer (AIS, Mirme et al., 2007) mea-sures naturally charged air ions in the mobility range 3.2– 0.0013 cm2V−1s−1, which corresponds to diameter range of
ca. 0.8–42 nm. The AIS consists of two identical cylindri-cally symmetric differential mobility analysers (DMA), each with 21 electrometers. One DMA measures the positive ion spectrum and the other DMA measures the negative ion spec-trum simultaneously. The air that flows through each DMA consists of a sample (30 lpm) and sheath (60 lpm) flow. These air flows are controlled by ball valves, which are placed after
the DMAs, and measured by venturi tubes, which include a dense grid to produce laminar flow. The AIS data is averaged and recorded in five minute cycles. The accuracy of the AIS data of this specific measurement campaign will be discussed in Sect. 4.1.
Permapure MD-110-48 (Permapure LLC, USA) to less than 30 % relative humidity, which was also continuously mon-itored. The total concentration obtained with this CPC was compared to a reference CPC (TSI 3772). The difference be-tween the two CPCs was 7 %, which was considered in the data inversion.
3.2 Supporting data
Ancillary data included gas concentrations and basic meteo-rological parameters. For ozone (O3)concentration
monitor-ing, an Environment S.A. analyser (O341M) was deployed, correspondingly sulphur dioxide (SO2)concentrations were
monitored with Thermo analyser (Thermo Environmental Instruments Inc. model 43S), nitrogen oxides (NOx)
con-centrations with a Teledyne analyser (Teledyne Instruments API model 200AU), black carbon (BC) concentrations with a multi-angle absorption photometer (MAAP, model 5012), and carbon monoxide (CO) with a Horiba analyser (Horiba APMA 360). Temperature and relative humidity were mea-sured with Rotronic (MP 101A), while wind speed and di-rection were measured with Vector equipment (A101ML and A200P/L, respectively). Additionally, particulate matter con-centrations (i.e. PM1, PM2.5and PM10)were monitored and
trace metal content of the particulate matter is also avail-able, although only discussion of the PM10is included in this
work.
4 Methods
Data measured both with the AIS and the DMPS included some gaps or bad data, which were due to malfunctioning of the instruments, as well as service and/or calibrations be-ing conducted. Before data analysis commenced, raw data was cleaned according to methods indicated by Laakso et al. (2008) and Venter et al. (2012). Aerosol data was cleaned by visually selecting and deleting periods and size intervals when data was noisy or otherwise suspicious. Gas data was corrected based on in-situ calibration procedures. All the data was averaged over 15 min. However, as higher temporal reso-lution particle and ion data are needed for the formation and growth rate analysis, the original time resolution of DMPS (9 min) and AIS (5 min) data were kept.
4.1 Effect of flow rate and contamination on size distributions obtained with the AIS
During the measurements at Marikana we noticed that the air pathways of the AIS got partially blocked due to the accumu-lation of soot and coarse particles, mainly in the areas with small apertures and on the venturi tube nets (for a technical drawing of AIS, please see Mirme et al., 2007). Fortunately no particulate build-up occurred in the blower. As a result of accumulation of particulate matter, the flow rates of the two DMAs may become different over time, since both of
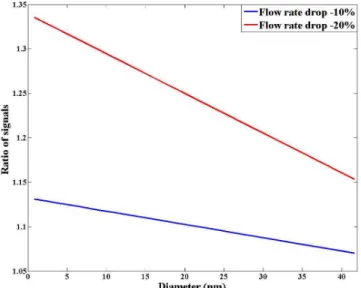
Fig. 2.Ratio of raw signals during normal flow rate to reduced flow rate. The peak signal and both adjacent signals from the electrome-ters were included in the analysis.
the DMAs have their own post-venturi air flow paths. The sheath air flow rates were also affected by blockages in the nets before the electrical filters, which produce ion free air.
Decreasing flow rate broadens and shifts mobility distri-butions. The best way to correct the data would have been to calculate new transfer functions, which correspond to new flow rates. However, we were uncertain of the relative changes of the different flows (i.e. two sheath flows, two sample flows and a combined exhaust flow), since only the combined exhaust flow rate was recorded by default. All the individual flow rates were measured only after the measure-ment campaign at Marikana was completed. These post cam-paign measurements indicated that the decrease of all flows were proportional. Due to the limited amount of knowledge on the effect of reduced flow rates on the mobility distribu-tion, we conducted theoretical and experimental studies to evaluate the effect.
Fig. 3.Average size distributions measured with the AIS and a reference ion spectrometer at different flow rates during flow rate experiments. The negative polarity is symbolised with the letter N and the positive polarity with P.
Experimental investigation carried out in Finland in May– June 2010 included both laboratory calibration and field study. The laboratory calibrations are explained and analysed in detail by Gagn´e et al. (2011). The results showed that the AIS (serial nr. 2 utilised here) classified the mobility accu-rately. However, the AIS overestimated concentrations com-pared to a reference instrument. The concentration difference was almost constant and independent of size. We therefore calculated a correction factor for concentration based on the calibration.
The second experiment was to reduce flow rates artifi-cially by burning a paraffin torch, which generated soot and coarse particles, close to the inlet. In this way, the out flow rate was decreased by 10 and 20 %. The observations (Fig. 3) confirmed the results from the theoretical evalua-tion (Fig. 2). Upon reduced flow, small ion mode immedi-ately began shifting towards smaller sizes. Larger particle distribution shift could not be identified with the applied flow rates and method. However, concentrations of ions in all size ranges dropped with reduced flow. The functioning of the AIS electrometers eventually became unstable as an increased amount of soot gathered on their surfaces, there-fore, only a qualitative comparison was possible.
Based on the above-mentioned results, it was decided to use the AIS data as follows: (1) sub-3 nm ion data was used only if the flow rate was at the desired level (60 lpm±5 %), (2) data of ions larger than 3 nm in diameter were used if the
flow rate had decreased by at most 20 %, and (3) all the data affected by high electrometer noise (due to the accumulation of dirt on the electrometers) were excluded. After selecting the data based on the flow rate we were able to analyse 14 % and 78 % of the data of sub-3 nm and larger than 3 nm ions, respectively. The data cleaning removed large fraction of data for ions larger than 10 nm in diameter during the wet period (see Sect. 5.3).
4.2 Altitude and temperature effects on the AIS data
Our measurements were performed at a relatively high alti-tude (1170 m a.s.l.), where annual average temperature and pressure were 19◦C and 886 hPa, respectively. The mobility
of an ion depends on both ambient pressure and temperature. Thus at higher altitudes the ions may become more mobile compared to sea level. In this work we decided to use the Mil-likan diameter conversion (MilMil-likan, 1923) for both the ion and particle datasets. Following the convention in previous publications (e.g. Manninen et al., 2010; Vakkari et al., 2011; Hirsikko et al., 2011 and references therein), the ion diame-ters were adjusted to average summer temperature (23◦C) at
sea level (1000 hPa), while the diameters of the DMPS data were calculated by using instant temperature and pressure in-side the DMA. This led to a ca. 6 % underestimation of the ion diameters compared to diameters of DMPS size distribu-tion data. This small discrepancy in derived diameters due to different temperature and pressure scheme is small compared to other sources of uncertainty.
4.3 Data analysis
4.3.1 Particle formation
Particle formation events were classified visually accord-ing to guidelines by Yli-Juuti et al. (2009) and Vakkari et al. (2011) for the AIS data and by Dal Maso et al. (2005) for the DMPS data. We divided days into particle forma-tion (i.e. nucleaforma-tion), undefined and non-event days. Our aim was to analyse formation and growth rates for all nucleation events if possible, therefore no further division of particle formation events were made. Based on our earlier experience we know that this type of visual classification is subject to small discrepancies due to the judgement of the analyst(s).
Due to accuracy issues of concentration measurements and lack of sub-3 nm ion data (as discussed in Sect. 4.1) we were unable to calculate formation rates for 2-nm ions (J2) as
is typically done when investigating particle formation pro-cesses (e.g. Kulmala et al., 2007; Manninen et al., 2010). The DMPS system was set to measure particles larger than 10 nm in diameter. Unfortunately, the lowest size channel of the DMPS had to be rejected as the DMPS high voltage power source could not keep the voltage stable below 8 V. There-fore we began our analysis of formation and growth rates from 12 nm (i.e.J12and GR12−30).
Formation rates for 12 nm particles (J12)were calculated
following Dal Maso et al. (2005, and references therein):
J12=
dN12−30
dt +CoagS·N12−30+Fgrowth. (1) WhereN12−30is the concentration of nucleation mode
parti-cles obtained by the DMPS, CoagS the particle removal rate due to coagulation andFgrowthis the flux of particle growth
out of the nucleation mode. The latter was assumed to be
equal to zero due to the assumption that particles do not grow larger than 30 nm during the time the nucleation event is in-vestigated (Dal Maso et al., 2005).
4.3.2 Particle growth
We estimated the growth rates of particle population based on AIS and DMPS data. Ion growth rates from the AIS were analysed by using a maximum concentration method described by Hirsikko et al. (2005). The method follows the timing of maximum concentration of every size bin, and the growth rates are obtained as a slope of a linear fit to time-diameter pairs. However, this method works best when the growing mode is narrow enough (i.e. for sub-20 nm parti-cle mode). Therefore, we calculated growth rates based on the DMPS data by using a mode fitting method introduced by Hussein et al. (2005) and Dal Maso et al. (2005). The mode fitting method cannot typically be used to estimate ini-tial growth, thus the fitting often begins close to a diameter of 5 nm, which makes this method unsuitable for growth rate analysis with the AIS data.
Major error sources for growth rate analysis are the stretching of size distributions due to decreasing flow rates in the AIS (as discussed in Sect. 4.1) and an inhomoge-neous/changing air mass during a growth event. The first source of error was taken into account by using only data measured when the flow rates were high enough. The later effect was dealt with by visually checking how well the ob-tained slope followed the growing mode.
The analysis by Yli-Juuti et al. (2011) showed that the maximum concentration method typically results in some-what higher growth rates than the mode fitting method. This was assumed to be due to high and changing coagulation sinks during growth, especially if the growth is slow (Lepp¨a et al., 2011). However, growth rates at Marikana were high (Sect. 5.3), which reduced somewhat the possible overesti-mation. The obtained growth rates also depend on the in-strument and the charge polarity of the particles (Yli-Juuti et al., 2011). The first arises from inaccurate determinations of flow rates, and the latter is due to the combination of the fact that activation of one charge polarity occurs before the other and continuous charging in the atmosphere. We will present growth and formation rates statistically, therefore qualitative error estimation is assumed to be sufficient for our purposes.
4.3.3 Estimation of H2SO4concentration and air mass back trajectories
in a semi-clean South African savannah. Several proxies for sulphuric acid have been derived (Pet¨aj¨a et al., 2009; Mikko-nen et al., 2011). However, none of them have been tested against sulphuric acid data from environments comparable to Marikana. We decided to deploy parameterisation by Pet¨aj¨a et al. (2009), as was previously done by Vakkari et al. (2011):
[H2SO4]p=1.4×10⁻⁷·Glob−0.70·
[SO2]·Glob
CS . (2)
Where Glob indicates global radiation in W m−2, [SO 2] is
the concentration in molecules cm−3and CS is a
condensa-tion sink (in s−1)due to background aerosol particles. The
condensation sink was calculated based on particle size dis-tribution data according to Dal Maso et al. (2005, and ref-erences therein). While utilising the proxy developed for the clean Finnish background station, it should be kept in mind that there is no confirmation it works for the conditions at Marikana. Thus the absolute values are uncertain and most probably only the difference between the seasons can be con-sidered reliable.
In addition to source and sink rates of nucleating and con-densing vapours, particle formation is also affected by turbu-lent mixing of the boundary layer, as well as air mass origin and path. We, therefore, calculated 96-h air mass back trajec-tories in one hour resolution with a model (Hybrid Single-particle Lagrangian Integrated Trajectory-HYSPLIT version 4.8) by the National Oceanic and Atmospheric Administra-tion (Draxler and Hess, 2004; Air Resources Laboratory, 2011).
5 Results
A summary of daytime (08:00–14:00) gaseous and partic-ulate pollutant concentrations at Marikana during the mea-surement period is shown in Table 1. As reported by Venter et al. (2012), the measured concentrations of SO2, NOx, CO
and BC were relatively high but generally within the lim-its of European and South African air quality standards. The concentrations of O3and PM10were observed to exceed
reg-ulations frequently.
5.1 Variation of particle number concentration
The concentrations of Aitken (20–100 nm in diameter) and accumulation (100–840 nm in diameter) mode particles had a clear annual cycle, i.e. concentrations were higher during the dry period compared to the wet period (Fig. 4). Median diurnal cycles (Fig. 5) indicated that the accumulation mode had peaks in the morning (06:30–08:00) and evening (19:00– 21:00), while the Aitken mode had three peak periods, i.e. the first in the morning (06:00–07:30), the second in the af-ternoon (11:00–14:30) and the third in the evening (18:30– 20:00). However, the timing of the concentration peaks was related to the duration of daylight and followed the length
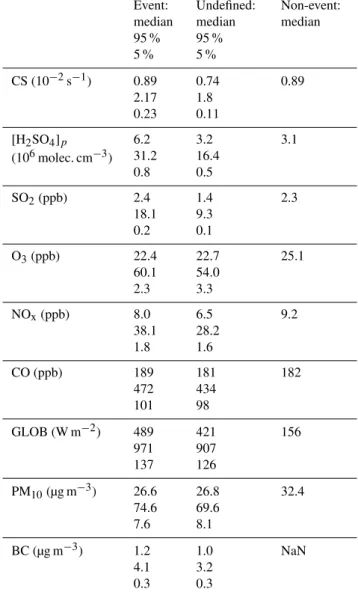
Table 1.Median, 95th and 5th percentiles of global radiation, trace gas and estimated sulphuric acid concentrations, particle mass (in prevailing conditions) and black carbon mass concentrations during 08:00–14:00 local time on particle formation and undefined days, which classification was based on the DMPS data. Only median value is presented on non-event day.
Event: median 95 % 5 % Undefined: median 95 % 5 % Non-event: median
CS (10−2s−1) 0.89 2.17 0.23 0.74 1.8 0.11 0.89
[H2SO4]p
(106molec. cm−3)
6.2 31.2 0.8 3.2 16.4 0.5 3.1
SO2(ppb) 2.4 18.1 0.2 1.4 9.3 0.1 2.3
O3(ppb) 22.4
60.1 2.3 22.7 54.0 3.3 25.1
NOx(ppb) 8.0
38.1 1.8 6.5 28.2 1.6 9.2
CO (ppb) 189
472 101 181 434 98 182
GLOB (W m−2) 489
971 137 421 907 126 156
PM10(µg m−3) 26.6
74.6 7.6 26.8 69.6 8.1 32.4
BC (µg m−3) 1.2
4.1 0.3 1.0 3.2 0.3 NaN
of the day. Nucleation mode (12–20 nm in diameter) parti-cle concentrations also had three concentration peaks dur-ing the day, the most important bedur-ing at or before midday (Fig. 5). However, nucleation mode particle concentrations did not show as clear annual cycle as was seen with larger particles (Fig. 4).
Fig. 4.Monthly median, 25 % and 75 % percentile concentrations of 12–20 nm, 20–50, 50–100 nm, 100–840 nm, and 12–840 nm (total) particles over two years. The dry periods are indicated with grey bars at the bottom of the figure.
Fig. 5. Diurnal cycle of 12–20 nm, 20–50, 50–100 nm and 100– 840 nm particle concentrations during the wet (October–April, up-per panel) and the dry (May–September, lower panel) up-periods.
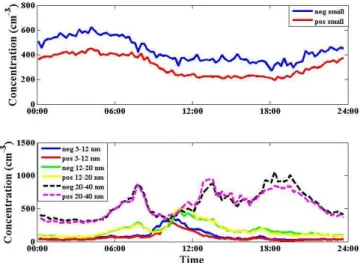
in Fig. 5. The concentrations of ions larger than 3 nm in diameter reflected the number concentration measured with the DMPS. The median small ion concentrations were 320 cm−3and 450 cm−3for positive and negative small ions
respectively, which are typical for polluted environments (Hirsikko et al., 2011).
Condensation sink, which is mainly caused by large parti-cles, may be used as a tracer for air quality. The CS values were high and typical for polluted urban or industrial envi-ronments (e.g. M¨onkk¨onen et al., 2005; Kulmala et al., 2005; Yue et al., 2009). The CS had a clear annual cycle with max-imum values during the dry period (Fig. 7), which was in accordance to observations by Vakkari et al. (2011) in the South African savannah.
Venter et al. (2012) indicated that NOx, CO, BC and
par-ticulate mass mainly originated from local residential
com-Fig. 6.Median diurnal concentrations: small ion concentrations are shown in the upper panel and concentrations of nucleation mode and 20–40 nm ions are presented in the lower panel.
bustion for heating and cooking at Marikana, while SO2
mainly originated from high stack industry emissions. Corre-lation coefficients between nucleation, Aitken and accumu-lation mode particle concentrations and trace gas, BC and CS are presented in Table 2. In addition, the relationship be-tween particle and SO2concentrations are shown in Fig. 8.
Fig. 7. Annual cycle of monthly medians of [H2SO4]p and
condensation sink. The figure includes observations made dur-ing February–December 2008, January–July 2009, September– December 2009, and January–May 2010.
Evening concentration peaks (Fig. 5) are usually more pro-nounced due to the need for space heating. The morning res-idential combustion period is usually curtailed due to warm-ing temperatures and residents leavwarm-ing for work. Durwarm-ing the wet periods, which correspond to summer and the wetter au-tumn and spring months, domestic heating probably plays a smaller role as a particle source. Hence the observed Aitken and accumulation mode particles concentrations were higher in the dry periods (Fig. 4).
In contrast, the midday peak in particle concentrations is expected to be due to particle formation as a result of indus-trial and natural emissions, as will be explained in Sect. 5.2. The South African Highveld is well known for the forma-tion of several well developed inversion layers, at different heights, that typically form during the night and persist un-til later morning (Garstang et al., 1996; Tyson et al., 1996; Wenig et al., 2003). High stack industry emissions can there-fore accumulate between two inversion layers during night-time, which is then released after the break-up of the inver-sion layers in the morning, hence resulting in a release of pol-lution at ground level. It is known that the PGM industry in this area has relatively high SO2emissions, since this
indus-try utilises sulphite ore (Xiao and Laplante, 2004) that gen-erate substantial SO2emissions. Thus, based on our
obser-vations we have identified two particle sources: SO2-based
nucleation before or at midday and domestic burning during the morning and evening.
5.2 Frequency of new particle formation days
In this section particle nucleation event classification was done on the entire, un-cleaned ion (AIS) and particle (DMPS)
datasets. This was done, since the procedure is visual and distinction between particle nucleation, undefined and non-events can be done even if the distributions may be disturbed or broadened (Sect. 4.1). This decision allowed us to use as much data as possible and to obtain the most representative result.
The nucleation events were observed on 86 % (DMPS), 84 % (negative ions) and 78 % (positive ions) of the analysed days at Marikana (Table 3, Fig. 9). With the ion spectrom-eter we were able to follow the growth of freshly nucleated ions, which allowed us to identify local charged particle for-mation events. The growing ion mode, however, was often visible from 3–7 nm upwards, which is an indication of a small contribution of ions to particle formation, or particle formation in residual layer or regional scale. If these obser-vations were due to dominance of electrically neutral path-ways in nucleation, then this would be in agreement with the theory and earlier observations that ion-mediated particle for-mation requires an environment of low nucleation rates, low temperature and aerosol content, but preferably having high concentrations of small ions and being rich with sulphuric acid (e.g. Laakso et al., 2002; Curtius et al., 2006; Iida, 2006; Yu, 2010). Despite the relatively high estimate of sulphuric acid concentration, none of these requirements were met at Marikana. It is also possible that the nucleation already be-gan in a residual layer before mixing into the boundary layer or some horizontal distance before the measurement site. Therefore, we suggest that regional new particle formation was significant at Marikana, despite the strong local pollu-tion sources. This is understandable, as the typical transport time above the western BIC area is short (1–2 h maximum).
At Marikana, the frequency of nucleation event days was higher than is reported from any other location (e.g. Kul-mala et al., 2004; Jaatinen et al., 2009; Hirsikko et al., 2011). As an example, in the South African savannah, the monthly nucleation event day frequency was 55–90 % (Vakkari et al., 2011), and in the Australian Eucalyptus forest the cor-responding frequency was ca. 52 % (Suni et al., 2008). In contrast, in the clean rural boreal environment annual nucle-ation event day frequency is typically less than 30 % (e.g. Dal Maso et al., 2005, 2007; Hirsikko et al., 2007a; Asmi et al., 2011). Over the polar areas the nucleation event day fre-quency is even lower (e.g. Virkkula et al., 2007; Asmi et al., 2010).
Table 2.Here Pearson correlation coefficients (r)between various trace parameters and particle concentrations are presented. Particle number concentrations were calculated for four size ranges: 12–20 nm, 20–50 nm, 50–100 nm and 100–840 nm.
Dry|Wet season Conc.12−20 nm Conc.20−50 nm Conc.50−100 nm Conc.100−840 nm
SO2: daytime night-time
0.48|0.49
−0.05| −0.02
0.38|0.51 0.10|0.09
0.18|0.36 0.21|0.14
0.29|0.30 0.30|0.12
CO: daytime night-time
−0.13| −0.02 0.14|0.35
0.04| −0.03 0.65|0.51
0.44|0.09 0.76|0.58
0.69|0.41 0.82|0.67
NOx: daytime
night-time
−0.08|0.00 0.26|0.47
0.07| −0.01 0.53|0.53
0.38|0.09 0.53|0.46
0.47|0.32 0.55|0.43
BC: daytime night-time
−0.08|0.02 0.07|0.35
0.08| −0.01 0.57|0.51
0.41|0.09 0.72|0.58
0.68|0.45 0.84|0.67
CS: daytime night-time
0.02|0.15 0.00|0.12
0.30|0.40 0.68|0.46
0.74|0.72 0.91|0.85
0.96|0.86 0.99|0.97
Fig. 8.Number concentrations of nucleation (dN12−20 nm), Aitken (dN20−50 nmand dN50−100 nm)and accumulation (dN100−840 nm)mode
particles are presented as a function of SO2concentration during the dry season (upper panel) and the wet season (lower panel). Red dots
Table 3.Statistics of nucleation event day classification based on the DMPS and the AIS data.
Analysed Events Non-events Undefined
DMPS
Number of days 649 559 2 88
Fraction of analysed days (%) 100 86.1 0.3 13.6
AIS(−)
Number of days 606 509 9 88
Fraction of analysed days (%) 100 84.0 1.5 14.5
AIS(+)
Number of days 606 476 18 112
Fraction of analysed days (%) 100 78.5 3.0 18.5
Fig. 9.Monthly distribution of particle formation, undefined and non-event days based on the DMPS (lower panel), positive (middle panel) and negative (upper panel) ion data (AIS).
during late autumn and winter having a similar annual cy-cle as [H2SO4]p(Fig. 7). Nevertheless, as shown in Table 1,
concentrations of SO2, [H2SO4]p and CS were typical for
urban environments, but also higher during nucleation and growth events compared to undefined and non-event days, or to values observed in rural environments (e.g. Hirsikko et al., 2007b; Pet¨aj¨a et al., 2009; Asmi et al., 2011; Wu et al., 2011; Mikkonen et al., 2011).
Air mass back trajectory analysis showed that despite the origin of the air masses, every trajectory circulated over the industrialised area of the western BIC and large cities nearby. The possible accumulation of trace gases from re-gional sources (Venter et al., 2012) may result in the observed high particle formation day frequency. Particle formation is also controlled by solar radiation. As is shown in Table 1, the
non-event days were likely influenced by presence of opti-cally thick clouds.
Despite the slightly lower frequency of positive ion events we cannot conclude with any certainty a clear polarity dif-ference based on the visual classification (Table 3, Fig. 9). In contrast, in rural boreal environment negative ion events have been observed to be more frequent and stronger compared to positive ion events (Hirsikko et al., 2007a).
A very notable observation was that multiple consecutive nucleation events (i.e. more than one event per day), starting from the nano-meter sizes (ca. 1.5–3 nm) followed by sub-sequent growth, were observed on ca. 100 days. All of these multiple events were observed during daylight. In addition to daytime nucleation, nocturnal nucleation events (Junninen et al., 2008; Lehtipalo et al., 2011), which were suppressed before diameter of ca. 3 nm, were also observed at Marikana. Svenningsson et al. (2008) have also observed several nu-cleation events, characterised by very fast growth rates, to oc-cur during a day over wetland in a clean Sub-Arctic Abisko, where the nucleation event day frequency was 40 % between spring and autumn. Svennigsson et al. (2008) observed such consecutive nucleation events related to homogeneous air masses to occur also during night-time in summer. However, they were not able to explain their observations of the night-time or multiple events. Further investigations of the mecha-nisms behind these observations are required in the future.
5.3 Particle formation and growth rates
Particle formation and growth rates (J12and GR12−30)were
Fig. 10. Monthly median formation rates of 12–30 nm parti-cles (J12) and growth rates (GR12−30 nm) based on the DMPS data. The figure includes observations made during February– December 2008, January–July 2009, September–December 2009, and January–May 2010.
Fig. 11.Formation rate of 12 nm particles as a function of growth rate (12–30 nm) based on the DMPS data.
direction did not seem to enhance formation or growth rates. This was expected, since the above discussed analysis indi-cated that particle formation and growth is probably affected by accumulation of trace gas species (e.g. SO2and organics)
from regional sources.
High formation rates were observed to occur simultane-ously with fast growth rates (Fig. 11). Both formation and growth rates were observed to correlate with concentrations of Aitken mode particles during nucleation events, but not with the accumulation mode particle concentrations. When
Table 4. Mean, median, standard deviation, and 10th/90th per-centiles of growth rate (GR) and formation rate (J12)separately for
dry and wet periods based on the DMPS. The growth rates based on the AIS data were calculated separately for the positive and the negative polarity.
Mean±std Median 10th|90th percentile
Dry period DMPS
J12(cm−3s−1) 4.5±6.1 2.5 0.6|10.7
GR12−30 nm(nm h−1) 8.0±4.1 7.1 4.2|13.1
AIS(+)
GR3−7 nm(nm h−1) 12.5±8.2 10.5 4.7|24.5
GR7−12 nm(nm h−1) 19.0±11.3 16.0 7.0|38.3
AIS(−)
GR3−7 nm(nm h−1) 11.9±7.3 10.1 4.7|22.6
GR7−12 nm(nm h−1) 19.7±10.5 17.5 8.2|34.5
Wet period DMPS
J12(cm−3s−1) 7.6±7.3 5.7 1.5|16.4
GR12−30 nm(nm h−1) 11.1±5.2 10.2 5.8|16.2
AIS(+)
GR3−7 nm(nm h−1) 13.1±7.7 11.1 5.4|24.2
GR7−12 nm(nm h−1) 19.1±11.0 15.4 7.9|35.4
AIS(−)
GR3−7 nm(nm h−1) 13.3±7.4 11.3 5.5|23.7
GR7−12 nm(nm h−1) 17.3±8.8 15.7 7.6|29.9
comparing our results ofJ12 and GR12−30 (Fig. 10) to
ob-servations by Vakkari et al. (2011) in the semi-clean South African savannah, we notice that both the magnitude and temporal variation of these parameters were similar.
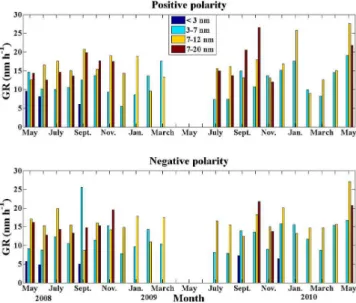
Even though sub-3 nm ion data was acceptable during 14 % of the time, we were able to estimate growth rates of sub-3 nm ions only on 13 days. Growth rate analysis for 7– 20 nm ions was possible only during half of the months due to data quality issues. Sub-20 nm charged particle growth rates in all size ranges were slightly higher during months from autumn to late spring (Figs. 12 and 13, Table 4). Growth rates of charged particles were also compared to Aitken and accumulation mode particle concentrations during the nu-cleation events. The analysis showed that the faster growth rates were observed when Aitken mode particle concentra-tions were higher.
Fig. 12.Monthly median growth rates of positive and negative ions (based on the AIS data) for different size fractions indicated with different colours.
rates are typically higher in polluted environments compared to rural or polar sites (e.g. Kulmala et al., 2004; Dal Maso et al., 2005, 2007; Iida et al., 2008; Jaatinen et al., 2009; Kalafut-Pettibone et al., 2011), due to more pronounced concentrations of H2SO4 vapour and stronger competition
between growth and coagulation loss. Earlier observations suggest that high growth rate and CS exist at the same time since slow growth cannot be observed due to quick scaveng-ing by pre-existscaveng-ing aerosol (e.g. Kulmala et al., 2005). The CS in Marikana was 3–5 times higher than in rural Botsalano (Vakkari et al., 2011), which may balance the potentially in-creased particle growth rates.
6 Concluding remarks
The aim of this work was to characterise particle sources and formation events at a residential area surrounded by mining and pyrometallurgical smelting industries in South Africa. The aerosol particle number concentrations were quite high (on average 104cm−3)and typical for urban or industrial
en-vironments, although, higher particle number concentrations have also been reported in literature (e.g. Ruuskanen et al., 2001; Woo et al., 2001; Wehner and Wiedensohler, 2003; Hussein et al., 2004; Stanier et al., 2004; M¨onkk¨onen et al., 2005; Wu et al., 2008; Cheung et al., 2011). Our results, together with the analysis by Venter et al. (2012) indicate that the major source for nucleation mode particles was new particle formation (most likely SO2-based) around midday.
Aitken and accumulation mode particles originated from do-mestic burning for heating and cooking, but in the afternoon an increased Aitken mode particle concentrations were also
Fig. 13.Annual monthly median growth rates (GR) based on DMPS (upper panel), positive (middle panel) and negative (lower panel) ion data (AIS).
observed due to regional nucleation and subsequent growth from industrial, residential and biological emissions.
Nucleation event day frequency was very high, i.e. 86 % of the analysed days, which is the highest thus far recorded in any environment (e.g. Kulmala et al., 2004; Hirsikko et al., 2011). Both the local sources and regional conditions af-fected the particle formation and growth. The formation and growth rates were high and typical for urban environments (Kulmala et al., 2004; Dal Maso et al., 2005, 2007; Iida et al., 2008; Jaatinen et al., 2009). However, the temporal cy-cle of the new particy-cle formation characteristics was similar as have been observed by Vakkari et al. (2011) over a semi-clean savannah in South Africa.
From the results presented it is clear that, despite the industrial and residential activities in the western BIC are sources of particulates, a large fraction of particle number concentration is due to regional nucleation. Our results com-bined with the results of Venter et al. (2012) provide valuable information for the assessment of local air quality and the possible health threat to the community in the western BIC, as well as supply information for decision making processes in the future for limiting air pollution. The results presented here were the most thorough analysis of particle formation and growth in an informal and semi-formal residential area, influenced by mining and pyrometallurgical industries.
of Excellence program (project no 1118615) is also gratefully acknowledged.
Edited by: L. M. Russell
References
Air Resources Laboratory: Gridded Meteorological Data Archives, available at: http://www.arl.noaa.gov/archives.php, 2011. Asmi, E., Frey, A., Virkkula, A., Ehn, M., Manninen, H. E.,
Ti-monen, H., Tolonen-Kivim¨aki, O., Aurela, M., Hillamo, R., and Kulmala, M.: Hygroscopicity and chemical composition of Antarctic sub-micrometre aerosol particles and observations of new particle formation, Atmos. Chem. Phys., 10, 4253–4271, doi:10.5194/acp-10-4253-2010, 2010.
Asmi, E., Kivek¨as, N., Kerminen, V.-M., Komppula, M., Hyv¨arinen, A.-P., Hatakka, J., Viisanen, Y., and Lihavainen, H.: Secondary new particle formation in Northern Finland Pallas site between the years 2000 and 2010, Atmos. Chem. Phys., 11, 12959–12972, doi:10.5194/acp-11-12959-2011, 2011.
Beukes, J. P., Dawson, N. F., and Van Zyl, P. G.: Theoretical and practical aspects of Cr(VI) in the South African FeCr industry, S. African Inst. Min. M., 110, 743–750, 2010.
Breitner, S., Liu, L., Cyrys, J., Br¨uske, I., Franck, U., Schlink, U., Leitte, A.M., Herbath, O., Wiedensohler, A., Wehner, B., Hu, M., Pan, X.-C., Wichmann, H.-E., and Peters, A.: Sub-micrometer particulate air ion pollution and cardiovascular mortality in Bei-jing, China, Sci. Total Environ., 409, 5196–5204, 2011. Brus, D., Neitola, K., Hyv¨arinen, A.-P., Pet¨aj¨a, T., Vanhanen, J.,
Sipil¨a, M., Paasonen, P., Kulmala, M., and Lihavainen, H.: Ho-mogenous nucleation of sulfuric acid and water at close to atmo-spherically relevant conditions, Atmos. Chem. Phys., 11, 5277– 5287, doi:10.5194/acp-11-5277-2011, 2011.
Cheung, H. C., Morawska, L., and Ristovski, Z. D.: Observation of new particle formation in subtropical urban environment, At-mos. Chem. Phys., 11, 3823–3833, doi:10.5194/acp-11-3823-2011, 2011.
Curtius, J., Lovejoy, E. R., and Froyd, K. D.: Atmospheric ion in-duced aerosol nucleation, Space Sci. Rev., 125, 159–167, 2006. Cramer, L. A., Basson, J., and Nelson, L. R.: The impact of platinum
production from UG2 ore on ferrochrome production in South African, S. African Inst. Min. M., 104, 517–527, 2004.
Dal Maso, M., Kulmala, M., Riipinen, I., Wagner, R., Hussein, T., Aalto, P. P., and Lehtinen, K. E. J.: Formation and growth of fresh atmospheric aerosols: eight years of aerosol size distribution data from SMEAR II, Hyyti¨al¨a, Finland, Boreal Environ. Res., 10, 323–336, 2005.
Dal Maso, M., Sogacheva, L., Aalto, P.P., Riipinen, I., Komp-pula, M., Tunved, P., Korhonen, L., Suur-Uski, V., Hirsikko, A., Kurt´en, T., Kerminen, V.-M., Lihavainen, H., Viisanen, Y., Hans-son, H.-C., and Kulmala, M.: Aerosol size distribution measure-ments at four Nordic field stations: identification, analysis, and trajectory analysis of new particle formation bursts, Tellus, 59B, 350-361, 2007.
Draxler, R. R. and Hess, G. D.: Description of the HYSPLIT 4 Mod-elling System, NOAA Technical Memorandum ERL ARL-224, 2004.
Dunn, M. J., Jim´enez, J.-L., Baumgardner, D., Castro, T., Mc-Murry, P. H., and Smith, J. N.: Measurements of Mexico
City nanoparticle size distributions: Observations of new par-ticle formation and growth, Geophys. Res. Lett., 31, L01012, doi:10.1029/2004GL019483, 2004.
Fiedler, V., Dal Maso, M., Boy, M., Aufmhoff, H., Hoffmann, J., Schuck, T., Birmili, W., Hanke, M., Uecker, J., Arnold, F., and Kulmala, M.: The contribution of sulphuric acid to atmospheric particle formation and growth: a comparison between boundary layers in Northern and Central Europe, Atmos. Chem. Phys., 5, 1773–1785, doi:10.5194/acp-5-1773-2005, 2005.
Gagn´e, S., Lehtipalo, K., Manninen, H. E., Nieminen, T., Schobes-berger, S., Franchin, A., Yli-Juuti, T., Boulon, J., Sonntag, A., Mirme, S., Mirme, A., H˜orrak, U., Pet¨aj¨a, T., Asmi, E., and Kul-mala, M.: Intercomparison of air ion spectrometers: an evaluation of results in varying conditions, Atmos. Meas. Tech., 4, 805–822, doi:10.5194/amt-4-805-2011, 2011.
Garstang, M., Tyson, P. D., Swap, R., Edwards, M., K˚allberg, P., and Lindesay, J. A.: Horizontal and vertical transport of air over southern Africa, J. Geophys. Res., 101, 721–736, 1996. Hand, J. L. and Malm, W. C.: Review of aerosol mass scattering
ef-ficiencies from ground-based measurements since 1990, J. Geo-phys. Res., 112, D16203, doi:10.1029/2007JD008484, 2007. Hirsikko, A., Laakso, L., H˜orrak, U., Aalto, P., Kerminen, V., and
Kulmala, M.: Annual and size dependent variation of growth rates and ion concentrations in boreal forest, Boreal Environ. Res., 10, 357–369, 2005.
Hirsikko, A., Bergman, T., Laakso, L., Dal Maso, M., Riipinen, I., H˜orrak, U., and Kulmala, M.: Identification and classification of the formation of intermediate ions measured in boreal forest, At-mos. Chem. Phys., 7, 201—210, doi:10.5194/acp-7-201-2007, 2007a.
Hirsikko, A., Yli-Juuti, T., Nieminen, T., Vartiainen, E., laakso, L., Hussein, T., and Kulmala: Indoor and outdoor air ions and aerosol particles in the uban atmosphere of Helsinki: character-istics, sources and formation, Boreal Eviron. Res., 12, 295–310, 2007b.
Hirsikko, A., Nieminen, T., Gagn´e, S., Lehtipalo, K., Manninen, H. E., Ehn, M., H˜orrak, U., Kerminen, V.-M., Laakso, L., McMurry, P. H., Mirme, A., Mirme, S., Pet¨aj¨a, T., Tammet, H., Vakkari, V., Vana, M., and Kulmala, M.: Atmospheric ions and nucle-ation: a review of observations, Atmos. Chem. Phys., 11, 767– 798, doi:10.5194/acp-11-767-2011, 2011.
Hoppel, W. A.: Determination of the aerosol size distribution from the mobility distribution of the charged fraction of aerosols, J. Aerosol Sci., 9, 41–54, 1978.
Hussein, T., Puustinen, A., Aalto, P. P., M¨akel¨a, J. M., H¨ameri, K., and Kulmala, M.: Urban aerosol number size distributions, Atmos. Chem. Phys., 4, 391–411, doi:10.5194/acp-4-391-2004, 2004.
Hussein, T., Dal Maso, M., Pet¨aj¨a, T., Koponen, I. K., Paatero, P., Aalto, P. P., H¨ameri, K., and Kulmala, M.: Evaluation of an auto-matic algorithm for fitting the particle number size distributions, Boreal Environ. Res., 10, 337–355, 2005.
Iida, K., Stolzenburg, M., McMurry, P., Dunn, M. J., Smith, J. N., Eisele, F., and Keady, P.: Contribution of ion-induced nucleation to new particle formation: Methodology and its application to at-mospheric observations in Boulder, Colorado, J. Geophys. Res., 111, D23201, doi:10.1029/2006JD007167, 2006.
charged fractions: Analysis of new particle formation events in Mexico City, J. Geophys. Res., 113, D05207, doi:10.1029/2007JD009260, 2008.
IPCC: Fourth Assessment Report of the Intergovernmental Panel on Climate Change (IPCC), 2007.
Jaatinen, A., Hamed, A., Joutsensaari, J., Mikkonen, S., Birmili, W., Wehner, B., Spindler, G., Wiedensohler, A., Decasari, S., Mircea, M., Facchini, M. C., Junninen, H., Kulmala, M., Lehtinen, K. E. J., and Laaksonen, A.: A comparison of new particle formation events in the boundary layer at three different sites in Europe, Boreal Environ. Res., 14, 481–498, 2009.
Jayaratne, E. R. and Verma, T. S.: The impact of biomass burning on the environmental aerosol concentration in Gaborone, Botswana, Atmos. Environ., 35, 1821–1828, 2001.
Jokinen, V. and M¨akel¨a, J. M.: Closed loop arrangement with crit-ical orifice for DMA sheath/excess flow system, J. Aerosol Sci., 28, 643–648, 1997.
Junninen, H., Hulkkonen, M., Riipinen, I., Nieminen, T., Hirsikko, A., Suni, T., Boy, M., Lee, S.-H., Vana, M., Tammet, H., Kermi-nen, V.-M., and Kulmala, M.: Observations on nocturnal growth of atmospheric clusters, Tellus, 60B, 365–371, 2008.
Kalafut-Pettibone, A. J., Wang, J., Eichinger, W. E., Clarke, A., Vay, S. A., Blake, D. R., and Stanier, C. O.: Size-resolved aerosol emission factors and new particle formation/growth activity oc-curring in Mexico City during the MILAGRO 2006 Campaign, Atmos. Chem. Phys., 11, 8861–8881, doi:10.5194/acp-11-8861-2011, 2011.
Kuang, C., McMurry, P. H., McCormick, A. V., and Eisele, F. L.: Dependence of nucleation rates on sulphuric acid vapor concen-trations in diverse atmospheric locations, J. Geophys. Res., 113, D10209, doi:10.1029/2007JD009253, 2008.
Kulmala, M., Vehkam¨aki, H., Pet¨aj¨a, T., Dal Maso, M., Lauri, A., Kerminen, V.-M., Birmili, W., and McMurry, P. H.: Formation and growth rates of ultrafine atmospheric particles: a review of observations, J. Aerosol Sci., 35, 143–176, 2004.
Kulmala, M., Pet¨aj¨a, T., M¨onkk¨onen, P., Koponen, I. K., Dal Maso, M., Aalto, P. P., Lehtinen, K. E. J., and Kerminen, V.-M.: On the growth of nucleation mode particles: source rates of condensable vapor in polluted and clean environments, Atmos. Chem. Phys., 5, 409–416, doi:10.5194/acp-5-409-2005, 2005.
Kulmala, M., Riipinen, I., Sipil¨a, M., Manninen, H. E., Pet¨aj¨a, T., Junninen, H., Dal Maso, M., Mordas, G., Mirme, A., Vana, M., Hirsikko, A., Laakso, L., Harrison, R. M., Hanson, I., Leung, C., Lehtinen, K. E. J., and Kerminen, V.-M.: Toward direct measure-ment of atmospheric nucleation, Science, 318, 89–92, 2007. Kulmala, M., Asmi, A., Lappalainen, H. K., Baltensperger, U.,
Brenguier, J.-L., Facchini, M. C., Hansson, H.-C., Hov, Ø., O’Dowd, C. D., P¨oschl, U., Wiedensohler, A., Boers, R., Boucher, O., de Leeuw, G., Denier van der Gon, H. A. C., Fe-ichter, J., Krejci, R., Laj, P., Lihavainen, H., Lohmann, U., Mc-Figgans, G., Mentel, T., Pilinis, C., Riipinen, I., Schulz, M., Stohl, A., Swietlicki, E., Vignati, E., Alves, C., Amann, M., Ammann, M., Arabas, S., Artaxo, P., Baars, H., Beddows, D. C. S., Bergstr¨om, R., Beukes, J. P., Bilde, M., Burkhart, J. F., Canonaco, F., Clegg, S. L., Coe, H., Crumeyrolle, S., D’Anna, B., Decesari, S., Gilardoni, S., Fischer, M., Fjaeraa, A. M., Foun-toukis, C., George, C., Gomes, L., Halloran, P., Hamburger, T., Harrison, R. M., Herrmann, H., Hoffmann, T., Hoose, C., Hu, M., Hyv¨arinen, A., H˜orrak, U., Iinuma, Y., Iversen, T., Josipovic,
M., Kanakidou, M., Kiendler-Scharr, A., Kirkev˚ag, A., Kiss, G., Klimont, Z., Kolmonen, P., Komppula, M., Kristj´ansson, J.-E., Laakso, L., Laaksonen, A., Labonnote, L., Lanz, V. A., Lehtinen, K. E. J., Rizzo, L. V., Makkonen, R., Manninen, H. E., McMeek-ing, G., Merikanto, J., Minikin, A., Mirme, S., Morgan, W. T., Nemitz, E., O’Donnell, D., Panwar, T. S., Pawlowska, H., Pet-zold, A., Pienaar, J. J., Pio, C., Plass-Duelmer, C., Pr´evˆot, A. S. H., Pryor, S., Reddington, C. L., Roberts, G., Rosenfeld, D., Schwarz, J., Seland, Ø., Sellegri, K., Shen, X. J., Shiraiwa, M., Siebert, H., Sierau, B., Simpson, D., Sun, J. Y., Topping, D., Tunved, P., Vaattovaara, P., Vakkari, V., Veefkind, J. P., Viss-chedijk, A., Vuollekoski, H., Vuolo, R., Wehner, B., Wildt, J., Woodward, S., Worsnop, D. R., van Zadelhoff, G.-J., Zardini, A. A., Zhang, K., van Zyl, P. G., Kerminen, V.-M., S Carslaw, K., and Pandis, S. N.: General overview: European Integrated project on Aerosol Cloud Climate and Air Quality interactions (EUCAARI) – integrating aerosol research from nano to global scales, Atmos. Chem. Phys., 11, 13061–13143, doi:10.5194/acp-11-13061-2011, 2011.
Laakso, L., M¨akel¨a, J. M., Pirjola, L., and Kulmala, M.: Model studies on ion-induced nucleation in the atmosphere, J. Geophys. Res., 107, 4427, doi:10.1029/2002JD002140, 2002.
Laakso, L., Laakso, H., Aalto, P. P., Keronen, P., Pet¨aj¨a, T., Nieminen, T., Pohja, T., Siivola, E., Kulmala, M., Kgabi, N., Molefe, M., Mabaso, D., Phalatse, D., Pienaar, K., and Kermi-nen, V.-M.: Basic characteristics of atmospheric particles, trace gases and meteorology in a relatively clean Southern African Savannah environment, Atmos. Chem. Phys., 8, 4823–4839, doi:10.5194/acp-8-4823-2008, 2008.
Lehtipalo, K., Sipil¨a, M., Junninen, H., Ehn, M., Brendt, T., Kajos, M. K., Worsnop, D. R., Pet¨aj¨a, T., and Kulmala, M.: Observa-tions of Nano-CN in the Nocturnal Boreal Forest, Aerosol Sci. Technol., 45, 499–509, 2011.
Lepp¨a, J., Anttila, T., Kerminen, V.-M., Kulmala, M., and Lehtinen, K. E. J.: Atmospheric new particle formation: real and apparent growth of neutral and charged particles, Atmos. Chem. Phys., 11, 4939–4955, doi:10.5194/acp-11-4939-2011, 2011.
Lohmann, U. and Feichter, J.: Global indirect aerosol effects: a re-view, Atmos. Chem. Phys., 5, 715—737, doi:10.5194/acp-5-715-2005, 2005
Manninen, H. E., Nieminen, T., Asmi, E., Gagn´e, S., H¨akkinen, S., Lehtipalo, K., Aalto, P., Vana, M., Mirme, A., Mirme, S., H˜orrak, U., Plass-D¨ulmer, C., Stange, G., Kiss, G., Hoffer, A., T¨or˝o, N., Moerman, M., Henzing, B., de Leeuw, G., Brinken-berg, M., Kouvarakis, G. N., Bougiatioti, A., Mihalopoulos, N., O’Dowd, C., Ceburnis, D., Arneth, A., Svenningsson, B., Swi-etlicki, E., Tarozzi, L., Decesari, S., Facchini, M. C., Birmili, W., Sonntag, A., Wiedensohler, A., Boulon, J., Sellegri, K., Laj, P., Gysel, M., Bukowiecki, N., Weingartner, E., Wehrle, G., Laakso-nen, A., Hamed, A., Joutsensaari, J., Pet¨aj¨a, T., KermiLaakso-nen, V.-M., and Kulmala, M.: EUCAARI ion spectrometer measurements at 12 European sites – analysis of new particle formation events, Atmos. Chem. Phys., 10, 7907–7927, doi:10.5194/acp-10-7907-2010, 2010.
Millikan, R. A.: The general law of fall of a small spherical body through a gas, and its bearing upon the nature of molecular re-flection from surfaces, Phys. Rev., 22, 1–23, 1923.
Mikkonen, S., Romakkaniemi, S., Smith, J. N., Korhonen, H., Pet¨aj¨a, T., Plass-Duelmer, C., Boy, M., McMurry, P. H., Lehtinen, K. E. J., Joutsensaari, J., Hamed, A., Mauldin III, R. L., Birmili, W., Spindler, G., Arnold, F., Kulmala, M., and Laaksonen, A.: A statistical proxy for sulphuric acid concentration, Atmos. Chem. Phys., 11, 11319–11334, doi:10.5194/acp-11-11319-2011, 2011. Mirme, A., Tamm, E., Mordas, G., Vana, M., Uin, J., Mirme, S., Bernotas, T., Laakso, L., Hirsikko, A., and Kulmala, M.: A wide-range multi-channel Air Ion Spectrometer, Boreal Environ. Res., 12, 247–264, 2007.
Myhre, G: Consistency between satellite-derived and modeled esti-mates of the direct aerosol effect, Science, 325, 187–190, 2009. M¨onkk¨onen, P., Uma, R., Srinivasan, D., Koponen, I. K., Lehtinen,
K. E. J., H¨ameri, K., Suresh, R., Sharma, V. P., and Kulmala, M.: Relationship and variation of aerosol number and PM10 mass concentrations in a highly polluted urban environment – New Delhi, India, Atmos. Environ., 38, 425–433, 2004.
M¨onkk¨onen, P., Koponen, I. K., Lehtinen, K. E. J., H¨ameri, K., Uma, R., and Kulmala, M.: Measurements in a highly polluted Asian mega city: observations of aerosol number size distribu-tion, modal parameters and nucleation events, Atmos. Chem. Phys., 5, 57–66, doi:10.5194/acp-5-57-2005, 2005.
Paasonen, P., Nieminen, T., Asmi, E., Manninen, H. E., Pet¨aj¨a, T., Plass-D¨ulmer, C., Flentje, H., Birmili, W., Wiedensohler, A., H˜orrak, U., Metzger, A., Hamed, A., Laaksonen, A., Facchini, M. C., Kerminen, V.-M., and Kulmala, M.: On the roles of sul-phuric acid and low-volatility organic vapours in the initial steps of atmospheric new particle formation, Atmos. Chem. Phys., 10, 11223–11242, doi:10.5194/acp-10-11223-2010, 2010.
Pet¨aj¨a, T., Mauldin, III, R. L., Kosciuch, E., McGrath, J., Niem-inen, T., Paasonen, P., Boy, M., Adamov, A., Kotiaho, T., and Kulmala, M.: Sulfuric acid and OH concentrations in a boreal forest site, Atmos. Chem. Phys., 9, 7435–7448, doi:10.5194/acp-9-7435-2009, 2009.
Pope, C. A. and Dockery, D. W.: Health effects of fine particulate air pollution: lines that connect, J. Air Waste Manage., 56, 709–742, 2006.
Quaas, J., Ming, Y., Menon, S., Takemura, T., Wang, M., Penner, J. E., Gettelman, A., Lohmann, U., Bellouin, N., Boucher, O., Sayer, A. M., Thomas, G. E., McComiskey, A., Feingold, G., Hoose, C., Kristj´ansson, J. E., Liu, X., Balkanski, Y., Donner, L. J., Ginoux, P. A., Stier, P., Grandey, B., Feichter, J., Sednev, I., Bauer, S. E., Koch, D., Grainger, R. G., Kirkev˚ag, A., Iversen, T., Seland, Ø., Easter, R., Ghan, S. J., Rasch, P. J., Morrison, H., Lamarque, J.-F., Iacono, M. J., Kinne, S., and Schulz, M.: Aerosol indirect effects – general circulation model intercom-parison and evaluation with satellite data, Atmos. Chem. Phys., 9, 8697–8717, doi:10.5194/acp-9-8697-2009, 2009.
Riipinen, I., Sihto, S.-L., Kulmala, M., Arnold, F., Dal Maso, M., Birmili, W., Saarnio, K., Teinil¨a, K., Kerminen, V.-M., Laak-sonen, A., and Lehtinen, K. E. J.: Connections between atmo-spheric sulphuric acid and new particle formation during QUEST III-IV campaigns in Heidelberg and Hyyti¨al¨a, Atmos. Chem. Phys., 7, 1899–1914, doi:10.5194/acp-7-1899-2007, 2007. Russell, A. G. and Brunekreef, B.: A focus on particulate matter and
health, Environ. Sci. Technol., 43, 4620–4625, 2009.
Ruuskanen, J., Tuch, T., Ten Brink, H., Peters, A., Khlystov, A., Mirme, A., Kos, G. P. A., Brunekreef, B., Wichmann, H. E., Bu-zorius, G., Vallius, M., Kreyling, W. G., and Pekkanen, J.: Con-centrations of ultrafine, fine and PM2.5particles in three
Euro-pean cities, Atmos. Environ., 35, 3729–3738, 2001.
Scott, G. M.: The Development of a Methodology for the Delin-eation of Air Quality Management Areas in South Africa, Ph.D. thesis, University of KwaZulu Natal, Durban, 2010.
Sihto, S.-L., Kulmala, M., Kerminen, V.-M., Dal Maso, M., Pet¨aj¨a, T., Riipinen, I., Korhonen, H., Arnold, F., Janson, R., Boy, M., Laaksonen, A., and Lehtinen, K. E. J.: Atmospheric sulphuric acid and aerosol formation: implications from atmospheric mea-surements for nucleation and early growth mechanisms, At-mos. Chem. Phys., 6, 4079–4091, doi:10.5194/acp-6-4079-2006, 2006.
Sipil¨a, M., Brendt, T., Pet¨aj¨a, T., Brus, D., Vanhanen, J., Strat-mann, F., Patokoski, J., Mauldin III, R. L., Hyv¨arinen, A.-P., Li-havainen, H., and Kulmala, M.: The role of sulphuric acid in at-mospheric nucleation, Science, 32, 1243–1246, 2010.
Stanier, C. O., Khlystov, A. Y., and Pandis, S. N.: Ambient aerosol size distributions and number concentrations measured during the Pittsburgh Air Quality Study (PAQS), Atmos. Environ., 38, 3275–3284, 2004.
Suni, T., Kulmala, M., Hirsikko, A., Bergman, T., Laakso, L., Aalto, P. P., Leuning, R., Cleugh, H., Zegelin, S., Hughes, D., van Gorsel, E., Kitchen, M., Vana, M., H˜orrak, U., Mirme, S., Mirme, A., Sevanto, S., Twining, J., and Tadros, C.: Formation and characteristics of ions and charged aerosol particles in a na-tive Australian Eucalypt forest, Atmos. Chem. Phys., 8, 129–139, doi:10.5194/acp-8-129-2008, 2008.
Svenningsson, B., Arneth, A., Hayward, S., Holst, T., Massling, A., Swietlicki, E., Hirsikko, A., Junninen, H., Riipinen, I., Vana, M., Dal Maso, M., Hussein, T., and Kulmala, M.: Aerosol parti-cle formation events and analysis of high growth rates observed above a subarctic wetland-forest mosaic, Tellus, 60B, 353–364, 2008.
Tyson, P. D., Garstang, M., and Swap, R.: Large-scale re-circulation of air over southern Africa, J. Appl. Meteorol., 35, 2218–2236, 1996.
Vakkari, V., Laakso, H., Kulmala, M., Laaksonen, A., Mabaso, D., Molefe, M., Kgabi, N., and Laakso, L.: New particle forma-tion events in semi-clean South African savannah, Atmos. Chem. Phys., 11, 3333–3346, doi:10.5194/acp-11-3333-2011, 2011. Venter, A. D., Vakkari, V., Beukes, J. P., van Zyl, P. G., Laakso,
H., Mabaso, D., Tiitta, P., Josipovic, M., Kulmala, M., Pienaar, J. J., and Laakso, L.: An air quality assessment in the industrialized western Bushveld Igneous Complex, South Africa, S. Afr. J. Sci., accepted, 2012.
Virkkula, A., Hirsikko, A., Vana, M., Aalto, P. P., Hillamo, R., and Kulmala, M.: Charged particle size distributions and analysis of particle formation events at the Finnish Antarctic research station Aboa, Boreal Environ. Res., 12, 397–408, 2007.
Weber, R. J., Marti, J. J., McMurry, P. H., Eisele, F. L., Tanner, D. J., and Jefferson, A.: Measured atmospheric new particle forma-tion rates: Implicaforma-tions for nucleaforma-tion mechanisms, Chem. Eng. Commun, 151, 53–64, 1996.
Phys., 3, 867–879, doi:10.5194/acp-3-867-2003, 2003.
Wenig, M., Spichtinger, N., Stohl, A., Held, G., Beirle, S., Wagner, T., J¨ahne, B., and Platt, U.: Intercontinental transport of nitro-gen oxide pollution plumes, Atmos. Chem. Phys., 3, 387–393, doi:10.5194/acp-3-387-2003, 2003.
Winklmayr, W., Reischl, G., Lindner, A., and Berner, A.: A new electromobility spectrometer for the measurement of aerosol size distributions in the size range from 1 to 1000 nm, J. Aerosol Sci., 22, 289–296, 1991.
Woo, K. S., Chen, D. R., Pui, d. Y. H., and McMurry, P. H.: Mea-surement of Atlanta aerosol size distributions: observations of ultrafine particle events, Aerosol Sci. Technol., 34, 75–87, 2001. Wu, Z., Hu, M., Lin, P., Wehner, B., and Wiedensohler, A.: Parti-cle number size distribution in the urban atmosphere of Beijing, China, Atmos. Environ., 42, 7967–7980, 2008.
Wu, Z., Hu, M., Yue, D., Wehner, B., and Wiedensohler, A.: Evolu-tion of particle number size distribuEvolu-tion in an urban atmosphere during episodes of heavy pollution and new particle formation, Science China, Earth Sciences, 54, 1772–1778, 2011.
Xiao, Z. and Laplante, A. R.: Characterizing and recovering the platinum group minerals – a review, Miner. Eng., 17, 961–979, 2004.
Yli-Juuti, T., Riipinen, I., Aalto, P. P., Nieminen, T., Maenhaut, W., Janssens, I. A., Clayas, M., Salma, I., Ocskay, R., Hoffer, A., Imre, K., and Kulmala, M.: Characteristics of new particle for-mation events and cluster ions at K-Puszta, Hungary, Boreal En-viron. Res., 14, 683–698, 2009.
Yli-Juuti, T., Nieminen, T., Hirsikko, A., Aalto, P. P., Asmi, E., H˜orrak, U., Manninen, H. E., Patokoski, J., Dal Maso, M., Pet¨aj¨a, T., Rinne, J., Kulmala, M., and Riipinen, I.: Growth rates of nucleation mode particles in Hyyti¨al¨a during 2003– 2009: variation with particle size, season, data analysis method and ambient conditions, Atmos. Chem. Phys., 11, 12865–12886, doi:10.5194/acp-11-12865-2011, 2011.
Yu, F., Luo, G., Bates, T. S., Andersson, B., Clarke, A., Ka-pustin, V., Yantosca, R. M., Wang, Y., and Wu, S.: Spa-tial distributions of particle number concentrations in the global troposphere: Simulations, observations, and implications for nucleation mechanism, J. Geophys. Res., 115, D17205, doi:10.1029/2009JD013473, 2010.

![Fig. 7. Annual cycle of monthly medians of [H 2 SO 4 ] p and condensation sink. The figure includes observations made dur-ing February–December 2008, January–July 2009, September–](https://thumb-eu.123doks.com/thumbv2/123dok_br/18177632.330701/9.892.73.432.96.377/monthly-condensation-includes-observations-february-december-january-september.webp)