ACPD
12, 12119–12162, 2012Observation of aerosol size distribution and new
particle formation
H. Guo et al.
Title Page
Abstract Introduction
Conclusions References
Tables Figures
◭ ◮
◭ ◮
Back Close
Full Screen / Esc
Printer-friendly Version
Interactive Discussion
Discussion
P
a
per
|
Dis
cussion
P
a
per
|
Discussion
P
a
per
|
Discussio
n
P
a
per
|
Atmos. Chem. Phys. Discuss., 12, 12119–12162, 2012 www.atmos-chem-phys-discuss.net/12/12119/2012/ doi:10.5194/acpd-12-12119-2012
© Author(s) 2012. CC Attribution 3.0 License.
Atmospheric Chemistry and Physics Discussions
This discussion paper is/has been under review for the journal Atmospheric Chemistry and Physics (ACP). Please refer to the corresponding final paper in ACP if available.
Observation of aerosol size distribution
and new particle formation at a mountain
site in subtropical Hong Kong
H. Guo1, D. W. Wang1, Z. H. Ling1, C. K. Chan2, and X. H. Yao3
1
Air Quality Studies, Department of Civil and Structural Engineering, The Hong Kong Polytechnic University, Hong Kong, China
2
Division of Environment and Department of Chemical and Biomolecular Engineering, The Hong Kong University of Science and Technology, Hong Kong, China
3
Key Lab of Marine Environmental Science and Ecology, Ministry of Education, Ocean University of China, Qingdao, China
Received: 28 March 2012 – Accepted: 22 April 2012 – Published: 10 May 2012
Correspondence to: H. Guo (ceguohai@polyu.edu.hk)
ACPD
12, 12119–12162, 2012Observation of aerosol size distribution and new
particle formation
H. Guo et al.
Title Page
Abstract Introduction
Conclusions References
Tables Figures
◭ ◮
◭ ◮
Back Close
Full Screen / Esc
Printer-friendly Version
Interactive Discussion
Discussion
P
a
per
|
Dis
cussion
P
a
per
|
Discussion
P
a
per
|
Discussio
n
P
a
per
|
Abstract
In order to investigate the atmospheric particle formation and growth processes, and to quantify the particle number (PN) concentration and size distributions in Hong Kong, a three-month intensive field measurement was conducted from September to Novem-ber in 2010 near the mountain summit of Tai Mo Shan, a suburban site approximately
5
the geographical centre of the New Territories in Hong Kong. The mean total num-ber concentration in the size range of 5.5–350 nm was 7.86±0.66×103cm−3 (mean ±95% confidence interval), with a maximum value in November. New particle formation (NPF) events were observed on 12 out of 35 days in October/November 2010 with the formation rate from 0.29 to 4.53 cm−3s−1, and the average growth rates from 1.53 to
10
9.44 nm h−1. The events usually began at 10:00∼11:00 local time characterized by the
occurrence of a nucleation mode with a peak diameter of 6∼10 nm. The observed lin-ear or non-linlin-ear correlations between nucleation mode PN concentration (5.5–10 nm) and ozone, volatile organic compounds (VOCs) and/or (UV×SO2) suggested critical
roles of sulfuric acid and biogenic VOCs (e.g. isoprene,α-pinene andβ-pinene) in the
15
NPF events.
1 Introduction
Over the past decades, atmospheric submicrometer aerosols (<1 µm in diameter) have been found to impact global climate (e.g., Twomey et al., 1984), air quality (USEPA, 1996), visibility (e.g., Mohan and Payra, 2009) and human health (e.g., Oberdorster
20
et al., 2005). Typically, the sizes of submicrometer particles are categorized into three modes: a nucleation mode, representing quite newly formed particles usually have di-ameters smaller than 10 nm; Aitken and accumulation modes, representing aged par-ticles generally ranged in size from 10 to 100 nm and from 100 to 1000 nm, respec-tively (e.g., McMurry et al., 2000; Seinfeld and Pandis, 2006). Especially, as the newly
25
ACPD
12, 12119–12162, 2012Observation of aerosol size distribution and new
particle formation
H. Guo et al.
Title Page
Abstract Introduction
Conclusions References
Tables Figures
◭ ◮
◭ ◮
Back Close
Full Screen / Esc
Printer-friendly Version
Interactive Discussion
Discussion
P
a
per
|
Dis
cussion
P
a
per
|
Discussion
P
a
per
|
Discussio
n
P
a
per
|
significantly increasing the indirect radioactive effect of cloud (e.g., McMurry et al., 2011). Moreover, due to their nanometer-scale size, the newly formed particles can enter deep into the ciliated and alveolar sections of the lung and even bloodstream (Oberdorster et al., 2005), contributing to negative health effects. Consequently, it is critical to understand formation and growth processes of these new particles in the
5
atmosphere.
To date, numerous measurements have been conducted in different locations to study the size distribution of submicrometer particles and new particle formation (NPF) processes, including free troposphere (e.g., Weber et al., 2001), boreal forests (e.g., Vehkam ¨aki et al., 2004; Dal Maso et al., 2007; Asmi et al., 2011), coastal rural
ar-10
eas (e.g., Lee et al., 2008), high mountain-top (e.g., Gannet et al., 2011) and Antarc-tic/Arctic areas (e.g., Park et al., 2004). In addition, an increased number of studies were conducted in continental and coastal urban areas, i.e. Atlanta (Woo et al., 2001), St. Louis (Shi et al., 2002), East St. Louis (Qian et al., 2007), Pittsburgh (Stanier et al., 2004a,b), Birmingham, UK (Alam et al., 2003), Mexico City (Dunn et al., 2004),
15
and Brisbane (Guo et al., 2008; Cheung et al., 2011). In China, the field measure-ments for particle size distribution were also carried out in several cities and regions in recent years. Short-term intensive studies on NPF were performed in Beijing (Yue et al., 2009), Pearl River Delta (PRD) (Liu et al., 2008), Yangtze River Delta (YRD) (Gao et al., 2009) and Hong Kong (Yao et al., 2010). Moreover, a couple of long-term
20
continuous measurements were conducted in Beijing (e.g., Wu et al., 2008; Shen et al., 2011) and a remote mountain site, Mt. Waliguan (Kivek ¨as et al., 2009). Generally, nu-cleation events are much more frequently observed in rural/remote areas than in urban locations.
The production of atmospheric particulate matters normally requires two processes:
25
ACPD
12, 12119–12162, 2012Observation of aerosol size distribution and new
particle formation
H. Guo et al.
Title Page
Abstract Introduction
Conclusions References
Tables Figures
◭ ◮
◭ ◮
Back Close
Full Screen / Esc
Printer-friendly Version
Interactive Discussion
Discussion
P
a
per
|
Dis
cussion
P
a
per
|
Discussion
P
a
per
|
Discussio
n
P
a
per
|
i.e. ammonia (NH3) (H2SO4–H2O–NH3) and (iii) ion-induced nucleation. While the ex-act mechanisms and compounds participating in atmospheric NPF have remained un-solved. Recent studies (e.g., Kerminen et al., 2010) found that (i) nucleation is driven by sulfuric acid and possibly other low-volatile vapors (e.g. organics), and there was no indication from field measurements that water vapor participates into the nucleation;
5
(ii) dimethylamine enhances the nucleation more effectively than ammonia in the atmo-sphere; and (iii) some organic acids produced from monoterpene oxidation can nucle-ate with sulfuric acid to form very stable clusters. The second step of particle growth is controlled by the competition between particle growth via complex mechanisms, and scavenging on the larger pre-existing particles (Kerminen et al., 2004). Actually,
par-10
ticle growth probably occurs due to the condensable vapors such as low VOCs. Both theoretical and experimental evidences suggest that a large number of charged and neutral clusters are almost always present in the atmosphere (Kulmala et al., 2007). Thus, the second step may be the limiting step in the atmospheric NPF.
Hong Kong is a coastal city located in the PRD region with a total land area of
15
1104 km2and a population of 7 million. Due to Hong Kong’s special geographical loca-tion and complex atmospheric condiloca-tions, both local emissions and regional transport influence the Hong Kong’s air quality. Previous studies indicate that air pollution caused by fine particulate matters and ozone (O3) in the atmosphere of Hong Kong is severe
(e.g., Wang et al., 2005; Guo et al., 2009a). It is well-known that both biogenic and
20
anthropogenic VOCs together with nitrogen oxides (NOx) are important precursors of
surface-level O3, and the oxidation products of photochemical reaction may play a key
role in determining the spatial and temporal features of the nucleation events. Hence, NPF events likely occur along with photochemical O3 production. To our best
knowl-edge, only one study was conducted on atmospheric new particle growth and shrinkage
25
ACPD
12, 12119–12162, 2012Observation of aerosol size distribution and new
particle formation
H. Guo et al.
Title Page
Abstract Introduction
Conclusions References
Tables Figures
◭ ◮
◭ ◮
Back Close
Full Screen / Esc
Printer-friendly Version
Interactive Discussion
Discussion
P
a
per
|
Dis
cussion
P
a
per
|
Discussion
P
a
per
|
Discussio
n
P
a
per
|
(PN) concentration and size distribution, and to investigate the NPF processes in Hong Kong.
In this study, an intensive field measurement was conducted from 6 September to 30 November in 2010 near the summit of Mt. Tai Mo Shan (TMS; 640 m a.s.l). The PN con-centration and size distribution were characterized and the NPF events were classified
5
based on their strength and growth of geometric mean diameter (GMD). Moreover, the favorable meteorological conditions and possible mechanisms for the nucleation and growth of new particles were discussed by analyzing concurrently-observed meteoro-logical parameters, gaseous pollutants, major hydrocarbons (e.g. isoprene,α- andβ -pinenes, myrcene, limonene, toluene andm/p/o-xylenes), intermediate products i.e.
10
methacrolein (MAC) and methyl vinyl ketone (MVK) generated from isoprene oxidation, carbonyl compounds i.e. formaldehyde, acetaldehyde and acetone, and 24–48 h PM2.5
data.
2 Methodology
2.1 The topography and climate of Hong Kong
15
Hong Kong (22◦15 N, 114◦10 E) is surrounded by the South China Sea on the east, south, and west, and borders the Guangdong city of Shenzhen to the north over the Shenzhen River. The territory’s 1104 km2 area consists of Hong Kong Island, the Kowloon Peninsula, the New Territories, and over 200 offshore islands, of which the largest is Lantau Island where a power plant is located. The highest elevation in the
20
territory is at TMS (957 m a.s.l.).
Hong Kong climate can be affected by severe weather phenomena including tropical cyclones, strong winter monsoon, and thunderstorms with associated squalls that are most frequent from April to September. Generally the dry monsoon season begins in mid to late September and brings three months of pleasantly warm days and clean air
ACPD
12, 12119–12162, 2012Observation of aerosol size distribution and new
particle formation
H. Guo et al.
Title Page
Abstract Introduction
Conclusions References
Tables Figures
◭ ◮
◭ ◮
Back Close
Full Screen / Esc
Printer-friendly Version
Interactive Discussion
Discussion
P
a
per
|
Dis
cussion
P
a
per
|
Discussion
P
a
per
|
Discussio
n
P
a
per
|
masses. Hence, we chose these three months (September, October and November) as a sampling period for field measurement at TMS.
2.2 The sampling site
Mt. TMS is claimed to be Hong Kong’s most misty area due to high daily clouds cover-age. The highest point on Mt. TMS is occupied by a Hong Kong Observatory weather
5
radar station. Our monitoring site was located at the waist of Mt. TMS near the moun-tain summit (22.405◦N, 114.118◦E, about 640 m a.s.l.) (see Fig. 1).
Surrounding the foot of the mountain are urban centers with a population of 2.23 million. The straight distances between the mountain summit and the urban centers at the foot are about 5–10 km. Farther to the south are the urban centers of the partial
10
New Territory, Kowloon peninsula and Hong Kong Island. To the southwest is the newly-developed residential area of Tung Chung, the international airport and the South China Sea. To the west are the Tuen Mun residential areas and to the south is the South China Sea. To the north and northeast are the city clusters of the inland PRD region. Due to prevailing north/northeast synoptic winds in September–November, polluted air
15
from inland PRD often reaches the sampling site. In addition, because of its unique topography, mountain-valley breezes and sea-land breezes are frequently observed at TMS. These mesoscale circulations enhance the interaction of polluted urban air and the mountain air. The sampling site was set on the rooftop of a building at the waist of TMS (22.405◦N, 114.118◦E; 640 m a.s.l.).
20
2.3 Measurement techniques
The PN concentration and size distribution, VOCs, carbonyl compounds PM2.5,
gaseous pollutants and meteorological parameters were measured in this study. The detailed information is presented as follows:
Particle size distributions in the range of 5.5 to 350 nm were continuously measured
25
ACPD
12, 12119–12162, 2012Observation of aerosol size distribution and new
particle formation
H. Guo et al.
Title Page
Abstract Introduction
Conclusions References
Tables Figures
◭ ◮
◭ ◮
Back Close
Full Screen / Esc
Printer-friendly Version
Interactive Discussion
Discussion
P
a
per
|
Dis
cussion
P
a
per
|
Discussion
P
a
per
|
Discussio
n
P
a
per
|
a Condensation Particle Counter (CPC, model 5.400, GRIMM, Germany) system with 44 size bins at 4-min scan intervals. The SMPS was equipped with a nano-differential mobility analyzer (DMA), which separated poly-disperse particles into selected mono-disperse particles according to the electrical mobility of the particles, a function of their size. Then the CPC counted the number concentration of mono-disperse
parti-5
cles by laser light scattering. A sample air flow rate of 0.3 l min−1 was fixed for the set of SMPS+CPC with a sheath air flow rate of 3.0 l min−1. To minimize the particle loss, ambient aerosols were drawn into the SMPS+CPC system through a 1 m long flexi-ble and conductive tube with an inner diameter of 0.8 cm. Due to significant diffusion loss of particles with size below 10 nm and diffusion broadening effect in the transfer
10
function, it is important to understand the efficiency (or penetration rate) of the DMA for the accurate measurement of airborne particles. An experimental system determining the aerosol losses in the DMA and the calibration of the SMPS was established and discussed in Wang et al. (2012). In addition, since the Grimm CPC is not widely used, the discrepancy between Grimm CPC and TSI CPC reported by Schlatter (2006) was
15
used to compare our results with other studies.
To understand the relationships among newly formed particles and trace gases, am-bient O3, carbon monoxide (CO), sulfur dioxide (SO2) and nitric oxide (NO)
concentra-tions were monitored. O3 was measured using a commercial UV photometric
instru-ment (Model 400E, Teledyne instruinstru-ment, CA). SO2was measured by pulsed UV
fluo-20
rescence (Model 100E, Teledyne instrument, CA). CO was measured with a gas filter correlation, non-dispersive infrared analyzer (Model 300EU, Teledyne instrument, CA) with a heated catalytic scrubber to convert CO to carbon dioxide (CO2) for baseline de-termination. NO was detected with a modified commercial MoO/chemiluminescence analyzer (Model 200E, Teledyne instrument, CA). These analyzers were calibrated
25
ACPD
12, 12119–12162, 2012Observation of aerosol size distribution and new
particle formation
H. Guo et al.
Title Page
Abstract Introduction
Conclusions References
Tables Figures
◭ ◮
◭ ◮
Back Close
Full Screen / Esc
Printer-friendly Version
Interactive Discussion
Discussion
P
a
per
|
Dis
cussion
P
a
per
|
Discussion
P
a
per
|
Discussio
n
P
a
per
|
To investigate the potential associations of individual VOCs and carbonyl compounds with NPF and particle growth, non-methane hydrocarbons (NMHCs) and carbonyl sam-ples were collected on high O3 episode days (O3≥100 ppbv) i.e. on 27 October–2
November 2010, based on the prediction of meteorological conditions and the review of the PN concentrations on previous days, which were usually related to strong solar
5
radiation, cool and dry air, and low number concentrations of pre-existing large size particles.
Ambient VOC samples were collected using cleaned and evacuated 2-l electro-polished stainless steel canisters. A flow-controlling device was used to collect 1-h integrated samples. Hourly samples were consecutively collected from 09:00 to 16:00
10
with additional samples collected at 00:00, 03:00, 07:00, 18:00 and 21:00 per day. Finally, 91 VOC samples were collected at TMS on the seven days. The detailed ana-lytical systems and the quality control and assurance for VOC analyses are described in Guo et al. (2009a).
Carbonyl samples were collected on the same sampling days using the silica
car-15
tridges impregnated with acidified 2,4-dinitrophenylhydrazine (DNPH). Air samples were drawn through the cartridge at a flow rate of 0.8–0.9 l min−1 for 120 min (2 h); the flow rate through the cartridges was monitored with a rotameter which was cali-brated before and after each sampling. An O3 scrubber was connected to the inlet of
the DNPH–silica cartridge to prevent interference from O3. During these sampling days,
20
carbonyls samples were consecutively collected from 07:00 to 21:00 every two hours with additional samples collected at 00:00 and 03:00. Finally, 70 carbonyl samples were collected during this sampling period. All cartridges were stored in a refrigerator at 4◦C after sampling. The sampled carbonyl cartridges were eluted slowly with 2 ml of acetonitrile into a 2-ml volumetric flask. A 20-µl aliquot was injected into the high
25
ACPD
12, 12119–12162, 2012Observation of aerosol size distribution and new
particle formation
H. Guo et al.
Title Page
Abstract Introduction
Conclusions References
Tables Figures
◭ ◮
◭ ◮
Back Close
Full Screen / Esc
Printer-friendly Version
Interactive Discussion
Discussion
P
a
per
|
Dis
cussion
P
a
per
|
Discussion
P
a
per
|
Discussio
n
P
a
per
|
Pre-fired and pre-weighed quartz fabric filters were used to collect PM2.5 samples
for 24–48 h by a high-volume sampler (1.15–1.18 m3min−1). The collected filters were weighted to determine the PM2.5 mass using the standard gravimetric method, and
then were stored in 4◦C refrigerator before chemical analysis.
To analyze inorganic ionic species in PM2.5, i.e. ammonium (NH+4), sulfate (SO 2−
4 ),
5
and nitrate (NO−3), sample filters were ultrasonically extracted with 10 ml of Milli-Q water for 30 min. The water extracts were filtered through a syringe filter (0.2 µm PTFE mem-brane) to remove filter debris and suspended insoluble particles and then stored in a bottle. The 100 µl extracts were injected into an ion chromatography (Dionex Corpo-ration, ICS-1000) system for analysis. The detailed operations of the IC instrument are
10
described in Wu and Wang (2007). In addition, organic carbon (OC) and elemental car-bon (EC) were measured on a 0.526 cm2punch from each filter by thermal optical re-flectance (TOR) following the IMPROVE protocol on a DRI Model 2001 thermal/optical carbon analyzer (Atmoslytic Inc., Calabasas, CA, USA) (Chow et al., 2005).
The meteorological conditions were continuously monitored using a mini-weather
15
station (Vantage Pro TM & Vantage Pro 2 – TM Weather Stations, Davis Instruments), which consists of two components: a sleekly designed integrated sensor suite (ISS) to measure outdoor weather conditions, and a data-receiving console to receive the weather data wirelessly. The weather station was placed on the rooftop of a building at the TMS site. Temperature, relative humidity, solar radiation, UV light, wind speed and
20
direction were recorded during the sampling period.
2.4 Data processing and analysis
2.4.1 Data processing
The first step was to divide the size distribution into 5.5–10 (nucleation mode,Nnuc), 10–
100 (Aitken mode,NAit), and 100–350 nm (accumulation mode,Nacc), and to calculate
ACPD
12, 12119–12162, 2012Observation of aerosol size distribution and new
particle formation
H. Guo et al.
Title Page
Abstract Introduction
Conclusions References
Tables Figures
◭ ◮
◭ ◮
Back Close
Full Screen / Esc
Printer-friendly Version
Interactive Discussion
Discussion
P
a
per
|
Dis
cussion
P
a
per
|
Discussion
P
a
per
|
Discussio
n
P
a
per
|
the total concentration of particles in each size class through the formula:
Np−q=α q X
p
N(dp) (1)
whereNp−q is the number concentration in each size class, N(dp) is the number con-centration in the size interval dp+ ∆dp and α is a normalization factor obtained from the equation:
5
α=log(dp+ ∆dp)−log(dp) (2)
The SMPS data covered 44 channels spaced in the logarithmic scale. Calculation of the log differences between size channels in these three size modes gave an averageα -value of 0.03812, 0.040202, 0.049418 forNnuc,NAitandNacc, respectively. The total PN
concentration represented PN concentration from 5.5 to 350 nm in mobility diameter.
10
In this study, some data of particle size distributions from late September to early October were unavailable due to the malfunction of the DMA instrument caused by very high humidity during this period. The mean PN concentrations in different size classes were calculated with a 95 % confidence level (p <0.05). The linear and power correlations between the tested parameters were indicated by a squared correlation
15
coefficientR2.
2.4.2 Definition of a particle formation event
In this study, nucleation events were classified into three groups (Classes Ia, Ib and II) according to the classification scheme developed by Dal Maso et al. (2005), follow-ing the criteria that the particle mode must start in the distinct nucleation mode size
20
ACPD
12, 12119–12162, 2012Observation of aerosol size distribution and new
particle formation
H. Guo et al.
Title Page
Abstract Introduction
Conclusions References
Tables Figures
◭ ◮
◭ ◮
Back Close
Full Screen / Esc
Printer-friendly Version
Interactive Discussion
Discussion
P
a
per
|
Dis
cussion
P
a
per
|
Discussion
P
a
per
|
Discussio
n
P
a
per
|
event is any other Class I event where the particle formation and growth rate still can be determined. A Class II event represents the event where the accuracy of formation rate calculation is questionable due to data fluctuation even though the banana shapes are still observable.
2.4.3 Calculation of formation rate, growth rate and condensational sink
5
In this study, particle formation rates (FR) were represented and quantified using the number concentrations of particles (5.5–10 nm) at the start and end of a linear increase period (dN10/dt), without considering the effects of both coagulation and transport due
to the small influence on particle production of homogenous nucleation in relatively clean air masses (Jeong et al., 2010). In this study dN10/dtis a measure of the intensity
10
of nucleation mode particle formation in the event, rather than the nucleation rate, which is typically defined as the number of nuclei clusters growing larger than 1 nm.
The observed growth rate (GR) of the newly formed particles was quantified by the evolution of geometric mean diameters (GMD) of particles from the start to the end of the particle formation events: GMD for each size distribution was used to examine
15
particle growth processes (Dal Maso et al., 2005):
GR=∆GMD
∆t (3)
The condensation sink (CS) of newly formed particles, presented as the loss rate of molecules onto existing particles, was estimated by integrating over the aerosol size distribution as follows (Kulmala et al., 2005):
20
CS=2πD
Z
DpβM(Dp)n(Dp)dDp=2πD X
i
βMiDpiNi (4)
ACPD
12, 12119–12162, 2012Observation of aerosol size distribution and new
particle formation
H. Guo et al.
Title Page
Abstract Introduction
Conclusions References
Tables Figures
◭ ◮
◭ ◮
Back Close
Full Screen / Esc
Printer-friendly Version
Interactive Discussion
Discussion
P
a
per
|
Dis
cussion
P
a
per
|
Discussion
P
a
per
|
Discussio
n
P
a
per
|
3 Results and discussion
3.1 Overview of meteorological conditions and major pollutants
3.1.1 Day-to-day variations
Figures S1–S3 show the temporal variations of PN concentration (5.5–350 nm), trace gases (SO2, NO, CO and O3) and meteorological conditions (UV,T, RH and wind) at
5
the TMS site in September, October and November 2010, respectively. In general, the PN concentration was the highest in November and the lowest in September, consis-tent with O3mixing ratio. The increase in PN concentration was often associated with elevated CO, NO, SO2and O3(see Figs. S1–S3), such as on 8–9 and 16–21
Septem-ber, 23–24 and 27–31 OctoSeptem-ber, 1–3, 8–12, 17–19 and 26–27 NovemSeptem-ber, 2010. These
10
fine particle increase events were probably attributed to primary emissions from local sources and regional transport, and secondary formation via chemical reactions.
During the sampling period, September is the wettest month in 2010 (RH: 91.2±1.3 %, mean ±95 % C.I.) and the hottest month among these three months
(23.8±0.5◦C). More than half of the rainfall was attributed to the two tropical cyclones,
15
namely Lionrock and Fanapi. At the beginning of the sampling campaign, the weather in Hong Kong was fine and very hot on 6 and 7 September owing to the subsiding air associated with severe tropical storm Lionrock. On 15 September, Fanapi was formed over the Western North Pacific to the east of the Luzon Strait. Due to the subsiding air ahead of Fanapi, local weather was generally fine and hot from 16 to 19 September.
20
At the last week of September, the northeast monsoon brought generally fine condi-tion to Hong Kong. Affected by the tropical cyclones and northeast monsoon, the PN concentration and SO2, CO, O3 mixing ratio increased on 8–9 September and 16– 21 September, likely associated with primary emissions and regional transport (see Fig. S1).
25
ACPD
12, 12119–12162, 2012Observation of aerosol size distribution and new
particle formation
H. Guo et al.
Title Page
Abstract Introduction
Conclusions References
Tables Figures
◭ ◮
◭ ◮
Back Close
Full Screen / Esc
Printer-friendly Version
Interactive Discussion
Discussion
P
a
per
|
Dis
cussion
P
a
per
|
Discussion
P
a
per
|
Discussio
n
P
a
per
|
during the last six days of the month. The monsoon mainly brought fine and dry weather on 23 and 24 October, and reached the South China coast on the morning of 26 Oc-tober. Affected by the intense monsoon, local temperature dropped progressively to a minimum of 15.7◦C on 28 October – the lowest of the month. A clear and typical NPF and growth event occurred on 28 October (see Sect. 3.2.1). Cool and very dry
condi-5
tions with occasionally strong winds on high ground persisted for the last 5 days of the month, accompanied with the events of NPF and growth observed on 27–31 October and the O3episode days occurred on 29–31 October (maximum O3: 110.4 ppbv on 31 October) (see Fig. S2).
The mean temperature and relative humidity in November were the lowest (T:
10
17.1±0.5◦C; RH: 77.7±1.6 %) among the three months. A dry northeast monsoon
over Southern China brought fine and dry weather to Hong Kong on the first three days of the month. An episode of NPF events was consistently observed from 1–3 November. Affected by a broad cloud band over the coastal areas of Guangdong, the weather became rainy and cooler from 4 to 6 November. It remained fine and dry from
15
8 to 12 November during which another episode of NPF events occurred. Dominated by the northeast monsoon, local weather was mainly fine apart from some haze be-tween 17 and 24 November, during which an ozone episode was recorded mainly due to regional transport on 17–19 November. On 26 November, another NPF event was observed under a cool and dry weather condition, mainly caused by the reinforcement
20
of the northeast monsoon reaching the South China coastal areas (see Fig. S3 and Sect. 3.2).
3.1.2 Diurnal variations
Meteorological conditions and gaseous pollutants
Figure 2 shows mean diurnal variations of SO2, NO, CO, O3and meteorological
con-25
ACPD
12, 12119–12162, 2012Observation of aerosol size distribution and new
particle formation
H. Guo et al.
Title Page
Abstract Introduction
Conclusions References
Tables Figures
◭ ◮
◭ ◮
Back Close
Full Screen / Esc
Printer-friendly Version
Interactive Discussion
Discussion
P
a
per
|
Dis
cussion
P
a
per
|
Discussion
P
a
per
|
Discussio
n
P
a
per
|
The diurnal variation of solar radiation indicated the time of sunrise (06:00 local time LT) and sunset (18:00 LT) was similar in September, October and November. Diurnal patterns of O3 exhibited a high peak in the afternoon and relatively low
concentra-tions at night and in the morning. The mean daily O3 mixing ratio was the highest in
November (67.4±3.0 ppbv), and the lowest in September (37.7±3.6 ppbv). The daily 5
maximum O3 mixing ratio appeared at 14:00∼15:00 LT, likely due to photochemical
reactions and/or regional transport. The average daily maximum O3 mixing ratio was
70.2±6.3 ppbv.
In contrast, broad peaks of SO2and NO were observed at 10:00∼15:00 LT and at
10:00 LT, respectively, a slight delay compared to the time (08:00∼09:00) of peaks
10
usually appeared at the urban site, perhaps due to the influence of valley breeze which brought the urban primary pollutants from mountain foot to the summit. The peak NO value (5.3±0.5 ppbv) at TMS was much lower than those at urban sites (Guo et al., 2009a).
Particle number concentration and size distributions
15
i) Mean particle number concentration
In this study, the mean total number concentration in the size range of 5.5–350 nm at the mountain site was 7.86±0.66×103cm−3, falling into the range of typical values
(5–25×103cm−3) reported for the suburban/urban sites of North America and Europe.
However, the mean PN levels at TMS were lower than that at a coastal site in Hong
20
Kong (Yao et al., 2010), and was about 50 % less than those at some rural sites in China such as Yufa (17.0×103cm−3) (Yue et al., 2009) and Xinken (16.3×103cm−3)
(Liu et al., 2008), probably due to the different altitudes of sampling sites and the emission sources near the sites. In contrast, the PN level at TMS was much higher than that (2.03×103cm−3) at a remote background station i.e. Mt. Waliguan in North-25
ACPD
12, 12119–12162, 2012Observation of aerosol size distribution and new
particle formation
H. Guo et al.
Title Page
Abstract Introduction
Conclusions References
Tables Figures
◭ ◮
◭ ◮
Back Close
Full Screen / Esc
Printer-friendly Version
Interactive Discussion
Discussion
P
a
per
|
Dis
cussion
P
a
per
|
Discussion
P
a
per
|
Discussio
n
P
a
per
|
synoptic winds over the TMS site, which brought polluted air masses from mainland China to Hong Kong. Furthermore, the mean values for nucleation mode (Nnuc, 5.5–
10 nm), Aitken mode (NAit, 10–100 nm), and accumulation mode (Nacc,100–350 nm)
were 1.27±0.18×10³, 1.63±0.35×10³, and 0.75±0.08×103cm−3 in September,
respectively; 0.63±0.05×10³, 5.65±0.76×10³, and 0.74±0.06×103cm−3in
Octo-5
ber, respectively; and 1.74±0.13×10³, 6.06±0.85×10³, and 1.11±0.12×103cm−3 in November, respectively. The mean highest Nnuc (1.74±0.13×10
3
cm−3) was ob-served in November, suggesting frequent nucleation-mode particle formation at the TMS site during this period.
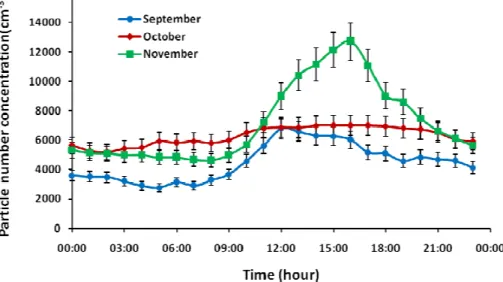
ii) Diurnal variations of particle number concentration and size distribution
10
Figure 3 shows the diurnal variations of PN concentration (5.5–350 nm) in September, October and November at TMS. As illustrated, the diurnal pattern of PN concentra-tion was different for each of the three months. In September, the PN concentration began to rise at 08:00, reached its peak at noon, and then gradually decreased. In Oc-tober, the PN concentration did not show significant difference between daytime and
15
nighttime, likely due to many rainy and cloudy days in early and middle October. The relatively higher PN concentration in October than in September was possibly caused by the O3 episode event occurred in late October (i.e. 27–31 October). In November, the PN concentration increased at 08:00, reached the peak value at 16:00, and then decreased. The typical diurnal pattern of PN concentration in September and
Novem-20
ber i.e. maxima at noon and afternoon and minima at night and early morning, similar to that of O3, implied that there might be photochemical formation of new particles.
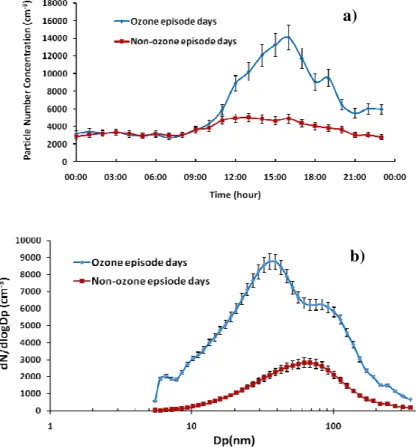
To further investigate the influence of photochemical reaction on NPF at TMS, the diurnal patterns of PN concentration and size distribution on O3 episode and non-O3 episode days during the sampling period are drawn in Fig. 4a, b. It is noteworthy that
25
a day with the maximum O3 mixing ratio higher than 100 ppb was defined as an O3
episode day, while a day with the maximum O3mixing ratio lower than 50 ppb was
ACPD
12, 12119–12162, 2012Observation of aerosol size distribution and new
particle formation
H. Guo et al.
Title Page
Abstract Introduction
Conclusions References
Tables Figures
◭ ◮
◭ ◮
Back Close
Full Screen / Esc
Printer-friendly Version
Interactive Discussion
Discussion
P
a
per
|
Dis
cussion
P
a
per
|
Discussion
P
a
per
|
Discussio
n
P
a
per
|
observed between O3 and non-O3 episode days (see Fig. 4a). During daytime hours (i.e. 08:00∼18:00), the PN concentration on O3 episode days was much higher than
that on non-O3 episode days. The PN concentration started to increase at 08:00 and
reached a peak value at 16:00 on O3 episode days, whereas only a low and broad peak was observed on non-O3episode days. The high and sharp peak at daytime on
5
O3 episode days was likely attributed to local and/or regional photochemical particle
formation and, to a lesser extent, the effect of valley breeze which brought PN in urban area (foot of the mountain) to the sampling site (i.e. summit of the mountain). On the other hand, the low and broad peak on non-O3 episode days was probably due to the
influence of valley breeze and regional transport. Indeed, further inspection on the size
10
distributions of PN on O3episode days found that there was a small peak at nucleation mode, which indicated nucleation mode particle burst occurred on O3 episode days.
Moreover, the peak diameter for the Aitken mode was 32 nm, smaller than 65 nm on non-O3 episode days, indicating that Aitken mode particles on O3 episode days were probably from condensational growth and coagulation of nucleation mode particles,
15
and from primary emissions such as traffic.
3.2 Classification of new particle formation events
According to the classification scheme developed by Dal Maso et al. (2005), the typical Class Ia events occurred on 28 October, 1, 9 and 12 November, 2010 at TMS. The examples of Class Ib observed in this study included 29 October, 2, 8 and 26
Novem-20
ber, 2010. On 27 and 30 October, 11 and 28 November, Class II events were mainly observed.
The mean growth rate for the nucleation events was calculated by the slope of GMD against time during the period of particle growth until 25 nm. By computation, the growth rates of Class I events observed at TMS were from 2.95 to 5.00 nm h−1
25
ACPD
12, 12119–12162, 2012Observation of aerosol size distribution and new
particle formation
H. Guo et al.
Title Page
Abstract Introduction
Conclusions References
Tables Figures
◭ ◮
◭ ◮
Back Close
Full Screen / Esc
Printer-friendly Version
Interactive Discussion
Discussion
P
a
per
|
Dis
cussion
P
a
per
|
Discussion
P
a
per
|
Discussio
n
P
a
per
|
These NPF events were often associated with elevated SO2 and O3. Hence, two Class Ia cases were studied to identify the sources and mechanisms that were respon-sible for NPF and growth in this study. Detailed description was provided as follows:
Case I – new particle formation under a clean background
New particle formation event (nucleation mode) on 28 October was clearly observed
5
after raining on 27 October, in line with the fact that nucleation events often occur after a sharp decrease in concentrations of pre-existing particles with large surface area. The minimum temperature of 12.5◦C recorded on 28 October was the lowest in October since 1988. The NFP started when wind speed increased to achieve maxi-mum (5.26 m s−1). As shown in Fig. 5, the nucleation mode appeared in the
measure-10
ment range at about 10:00 and increased substantially with an observable growth rate (2.95 nm h−1). The nucleation mode particle concentration (Nnuc) increased rapidly from
∼1.28×103cm−3 to 23.5×103cm−3 at noon with a formation rate of 4.11 cm−3s−1. The nucleation modes shifted towards Aitken modes during the afternoon until 16:00, perhaps due to the condensation growth and coagulation of the nucleation mode
parti-15
cles with larger particles. Since the concentration of around 0.2–1×106cm−3of sub-5-nm particles is needed to induce a growth rate of 1 sub-5-nm h−1by self-coagulation (Kulmala et al., 2004b), in this event the initial nucleation mode particle concentration of below 3×104cm−3indicated that self-coagulation only made a minor contribution to the par-ticle growth. In addition, after 14:00, the GR decreased with the condensation sink
20
(CS) increased from 0.0186 s−1to 0.0377 s−1, indicating increased large surface area particles scavenged potential condensable vapors responsible for particle growth. Af-ter 16:00, the total PN concentration decreased rapidly, perhaps due to the dilution effect and coagulation losses. Obviously synchronous increases of O3with increased PN concentration suggested the photochemical reaction may contribute to the
parti-25
cle formation. Meanwhile, simultaneously slow increase of SO2, decrease of CO, and
ACPD
12, 12119–12162, 2012Observation of aerosol size distribution and new
particle formation
H. Guo et al.
Title Page
Abstract Introduction
Conclusions References
Tables Figures
◭ ◮
◭ ◮
Back Close
Full Screen / Esc
Printer-friendly Version
Interactive Discussion
Discussion
P
a
per
|
Dis
cussion
P
a
per
|
Discussion
P
a
per
|
Discussio
n
P
a
per
|
a result of breakup of the morning inversion that mixed SO2-enriched and CO-depleted air from aloft and diluted the accumulated urban emissions (Zhang et al., 2004).
The correlations of organic aerosol precursors i.e. VOCs and carbonyls with nucle-ation mode PN concentrnucle-ations were analyzed to preliminarily investigate the formnucle-ation mechanism of the event on 28 October. The concentrations of biogenic VOC (BVOC)
5
and anthropogenic VOC (AVOC) species, which were demonstrated to be the potential precursors of secondary organic aerosols (SOA) reached the maxima at 07:00∼09:00
(i.e. BVOCs: isoprene 96 pptv,α-pinene 24 pptv,β-pinene 6 pptv, myrcene 5 pptv and limonene 329 pptv, and AVOCs: propene 510 pptv, toluene 6079 pptv, ethyltoluenes 180 pptv and triethylbenzenes 246 pptv), 1–3 h earlier than the time when the 5.5 nm
10
nucleation mode particles were observed. It is known that the oxidation products of BVOCs and AVOCs have a potential contribution to the new aerosol formation and growth (Griffin et al., 1999; Kulmala et al., 2004a; Hatch et al., 2011); and there is a time delay before VOC turns to condensable species which promote nucleation. Hence, the correlation of hourly PN with VOC species measured an hour earlier was explored
15
in this study. The BVOCs i.e. isoprene, α-pinene and β-pinene and the AVOCs i.e. propene, ethyltoluenes and triethylbenzenes showed stronger correlations with Nnuc
than other VOCs species (see Table 1). Good correlations ofNnucwith isoprene,α- and
β-pinenes, propene and aromatics suggested that BVOCs and AVOCs could contribute to the NPF event. Indeed, chamber study suggested that the possible mechanism was
20
the oxidation of VOCs which generated condensable oxygenated VOCs (e.g., Ng et al., 2008). In the atmosphere, methacrolein (MAC) and methyl vinyl ketone (MVK) are the major intermediate products generated from isoprene oxidation. In this event MAC and MVK showed moderate linear correlations with Nnuc (R
2
=0.414 and 0.677, respec-tively), suggesting that oxidation of BVOCs was a pathway to the nucleation mode
25
particles.
Additionally, the correlation of Nnuc with O3 mixing ratio (R 2
=0.485) was much higher than that with SO2 (R
2
ACPD
12, 12119–12162, 2012Observation of aerosol size distribution and new
particle formation
H. Guo et al.
Title Page
Abstract Introduction
Conclusions References
Tables Figures
◭ ◮
◭ ◮
Back Close
Full Screen / Esc
Printer-friendly Version
Interactive Discussion
Discussion
P
a
per
|
Dis
cussion
P
a
per
|
Discussion
P
a
per
|
Discussio
n
P
a
per
|
Table 2). All the evidences above suggested that the NPF observed on 28 October was likely due to the photochemical formation via VOC oxidation processes.
Case II – new particle formation under a polluted background
Another NPF event (nucleation mode) was clearly observed on 1 November (Fig. 6). Compared to the nucleation event occurred on 28 October, the background PN
con-5
centration on 1 November before particle nucleation was higher, which might inhibit nucleation process due to high concentrations of the pre-existing large surface area particles. However, on the morning of 1 November, the winds turned to north direc-tion with speeds from calm to light wind, and the CO levels sharply decreased at the start of this event, probably due to the rise of the boundary layer height which caused
10
the breakup of the morning inversion and diluted the accumulated pollutants, providing a relatively clean atmosphere (Figs. 6 and S5). Consequently, with rapid increase of solar radiation intensity and temperature, the nucleation mode appeared in the observ-able range at about 10:00 and the nucleation mode PN concentration increased rapidly from∼3.93×103cm−3to 5.47×103cm−3in two hours (growth rate: 5.0 nm h−1). Same
15
as that on 28 October, the nucleation modes shifted towards Aitken modes in the af-ternoon until 14:00 on 1 November, indicating the growth of nucleation mode particles into Aitken mode particles. At 14:00∼18:00, the Aitken mode PN concentration
re-mained a stable and high level. No obvious increase inNnuc in these four hours might
be explained by the fact thatNnuc were anti-correlated with aerosol surface area
con-20
centrations, i.e. lowerNnuc were recorded during the periods of higher aerosol surface
area concentrations. This is consistent with the observations reported in other stud-ies (Guo et al., 2008; Liu et al., 2008). It was also supported by the condensation sink in this event that increased from 0.0228 s−1to 0.0455 s−1during the condensation process, which inhibited the nanometer-scale particle nucleation causing a decreased
25
Nnuc concentration from 5.47×10 3
cm−3 to 1.36×103cm−3. After 18:00, the wind
ACPD
12, 12119–12162, 2012Observation of aerosol size distribution and new
particle formation
H. Guo et al.
Title Page
Abstract Introduction
Conclusions References
Tables Figures
◭ ◮
◭ ◮
Back Close
Full Screen / Esc
Printer-friendly Version
Interactive Discussion
Discussion
P
a
per
|
Dis
cussion
P
a
per
|
Discussion
P
a
per
|
Discussio
n
P
a
per
|
transported from local urban areas and/or PRD region had high number concentrations of Aitken mode and accumulation mode particles.
In this event, only isoprene and limonene showed strong correlations withNnuc(see
Table 1). No correlations were found between anthropogenic VOCs andNnuc. Diff
er-ent from the ever-ent on 28 October, the concer-entrations of most BVOC species started
5
to increase at 07:00 and reached the maximum concentrations at 13:00, i.e. iso-prene 118 pptv,α-pinene 10 pptv, andβ-pinene 6 pptv, though myrcene and limonene reached the maximum concentrations at 07:00, i.e. myrcene 6 pptv and limonene 33 pptv. The various temporal variations and correlations of different BVOCs with the
Nnuc indicated different oxidation processes of VOCs on these two events (i.e. 28
Oc-10
tober and 1 November). Additionally, the correlation between O3mixing ratio andNnuc
(R2=0.491) was slightly higher than that of SO2(R 2
=0.314), while CO (R2=0.013) and NO (R2=0.121) both had no obvious correlations with Nnuc, confirming that the
nucleation mode particles observed on 1 November were likely formed during the pro-cesses of photochemical reactions (Table 2). Given that the transformation from
gas-15
phase pollutants to nucleation mode particles requires sufficient time, there may be a delay between the measured gaseous pollutant i.e. SO2 and nucleation mode par-ticles. Indeed, a much better correlation between SO2 mixing ratio and theNnuc with
2-h lag was found (R2=0.637), suggesting the possible involvement of H2SO4
va-por or/and SO2oxidation products in this nucleation event. Since the SO2background
20
concentration in the PRD was much higher than that required in nucleation events ob-served in clean environments, the nucleation of sulfuric acid should be dominant in this event apart from the contributions of oxidation of BVOCs. More detailed discussion is given in Sect. 3.3.2.1.
Previous studies on new particle growth indicate that particle growth rate depends
25
on temperature and concentrations of available condensable vapor (Kulmala et al., 2004a). It is also reported that the semi- or no-volatile oxidation products of VOCs ac-count for more than 70 % of the materials for the particle growth, compared to H2SO4
ACPD
12, 12119–12162, 2012Observation of aerosol size distribution and new
particle formation
H. Guo et al.
Title Page
Abstract Introduction
Conclusions References
Tables Figures
◭ ◮
◭ ◮
Back Close
Full Screen / Esc
Printer-friendly Version
Interactive Discussion
Discussion
P
a
per
|
Dis
cussion
P
a
per
|
Discussion
P
a
per
|
Discussio
n
P
a
per
|
Moreover, Riipinen et al. (2011) found that lower-volatility SOA is able to grow into freshly nucleated particles more effectively than semi-volatile SOA. In these years, formaldehyde concentration increased dramatically in Hong Kong (Guo et al., 2009b). Although the vapor pressures of formaldehyde, acetaldehyde and acetone as major ox-idation products of VOCs are too high to take part into aerosol nucleation and growth
5
processes, in this event, a relatively strong correlation between formaldehyde andNnuc
(R2=0.597) and moderate correlations of acetaldehyde and acetone withNnuc
sug-gested that these primarily emitted carbonyls or intermediate products of BVOC ox-idation could be further oxidized into semi- or no-volatile compounds, contributing to the particle growth. Additionally, compared to the event on 28 October, both MAC and
10
MVK showed weak linear correlations withNnuc (R 2
=0.042 for MAC and R2=0.063 for MVK), whereas their mother species i.e. isoprene showed a good power correla-tion withNnuc in this event, suggesting isoprene oxidation might play an important role inNnuc formation and growth, and other primary emissions of MVK and MAC
weak-ened the correlations between photochemically produced MVK/MAC andNnuc. Further
15
investigation on the relationship between MAC and MVK found that most of the data points fell within the boundaries of lines 2:1 and 4:1, confirming the impact of regional industrial emissions on the MVK to MAC ratios (Guo et al., 2012).
3.3 Characteristics of new particle formation events
3.3.1 Effect of meteorological parameters on new particle formation
20
To investigate the favorable weather conditions for NPF at TMS, meteorological data in the NPF events are summarized (Table 3).
Global radiation has been identified to influence NPF. In this study, the lowest mean global solar radiation intensity from 08:00 to 16:00 on a NPF day (i.e. 28 Novem-ber) was 389.3 Wm−2, whereas the highest level was 565.5 Wm−2 on 1 November.
25
ACPD
12, 12119–12162, 2012Observation of aerosol size distribution and new
particle formation
H. Guo et al.
Title Page
Abstract Introduction
Conclusions References
Tables Figures
◭ ◮
◭ ◮
Back Close
Full Screen / Esc
Printer-friendly Version
Interactive Discussion
Discussion
P
a
per
|
Dis
cussion
P
a
per
|
Discussion
P
a
per
|
Discussio
n
P
a
per
|
the solar radiation intensity was as low as 46 Wm−2, indicating that the occurrence of NPF depended not only on the presence of intense sunlight but also on the properties of the present air masses (Wehner and Wiedensohler, 2003).
In this study, temperatures on the NPF days were lower (12.5∼19.7◦C) than the average temperature of the whole sampling period. For example, the minimum
tem-5
perature on 28 October was 12.5◦C when NPF occurred. This study also found that NPF took place at relative humidity of 55–80 %, similar to those reported by O’Dowd et al. (2002).
In the NPF events, the northeast winds were prevailing, mainly due to intense mon-soon over Southern China, which brought cool and very dry weather conditions to Hong
10
Kong. Nevertheless, wind speeds did not show any difference between NPF days and the other days.
By inspecting the start time of the NPF events occurred at TMS, it was obvious that all the NPF events were initiated at about 10:00∼11:00, consistent with other studies (Stanier et al., 2004b; Guo et al., 2008; Modini et al., 2009). Stanier et al. (2004b)
15
claimed that nucleation was typically observed starting around 09:00 EST in Pittsburgh, USA. In Eastern Australia, the NPF events usually began at 10:00∼11:00 local time (Guo et al., 2008; Modini et al., 2009), except one case in which a particularly strong nucleation event began early morning (08:00), suggesting some different, or stronger precursor sources than the sources for all other nucleation events (Modini et al., 2009).
20
In this study, the similar start time for all the NPF events indicated that the events were mainly induced and controlled by some certain sources and pathways, which were likely to be the homogeneous and/or heterogeneous nucleation of low volatile condensable gases such as sulfuric acid and some dominated organic compounds. For instance, the diurnal variations of BVOCs i.e. isoprene, α-pinene and β-pinene
25
showed that their mixing ratios steadily increased at 07:00, reached a maximum level in early afternoon, and then gradually decreased to low levels at night, which were consistent with the diurnal pattern of Nnuc or with 1–2 h time lag, indicating that the
ACPD
12, 12119–12162, 2012Observation of aerosol size distribution and new
particle formation
H. Guo et al.
Title Page
Abstract Introduction
Conclusions References
Tables Figures
◭ ◮
◭ ◮
Back Close
Full Screen / Esc
Printer-friendly Version
Interactive Discussion
Discussion
P
a
per
|
Dis
cussion
P
a
per
|
Discussion
P
a
per
|
Discussio
n
P
a
per
|
In addition, low SO2, NO and CO mixing ratios on the NPF days revealed that clean air masses were favorable to the NPF. Moreover, high O3mixing ratios in these events
suggested that photochemical reaction occurred during the NPF processes.
3.3.2 Potential precursors of new particle formation
Trace gases
5
Table 2 shows the growth rate, formation rate and condensation sink of each NPF and growth event observed at TMS, and the correlations of SO2, CO, NO and O3with the
Nnucfor each NPF event. TheNnucshowed a better correlation with O3than with SO2,
CO and NO for most events, except for the event on 26 November, 2010, suggesting that photochemical reactions of VOCs may play a key role in the NPF. In addition,
10
the events observed on 17 October, 1 and 8 November, 2010, showed thatNnuc had
relatively high correlations with both O3and SO2mixing ratios (two hours aheadNnuc),
especially on 1 November, the SO2 even had a better correlation with Nnuc than with
O3. This may indicate that SO2made an important contribution to the NPF in the above
event. Since hydroxyl radicals (OH) and H2SO4vapor were not measured, we used the
15
product of ultraviolet radiation and SO2 (i.e. UV×SO2) as a surrogate parameter for
H2SO4 production (Pet ¨aj ¨a et al., 2009). Better correlation betweenNnuc and the value
of (UV×SO2) (a proxy for the H2SO4production rate) during the nucleation events was
observed, suggesting a critical role played by H2SO4in the nucleation and early growth (see Table 2).
20
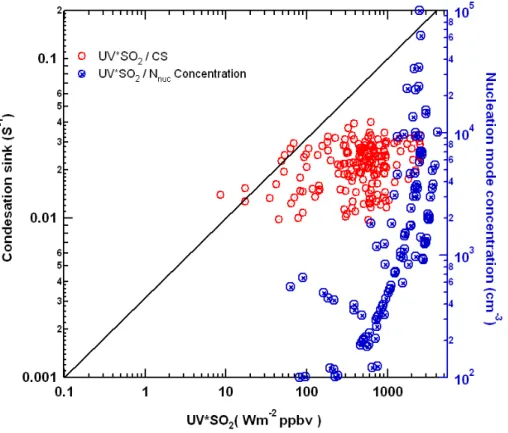
Figure 7 shows the correlation of (UV×SO2) with condensation sink during the NPF
events at TMS. It was used to predict the required H2SO4 production rates for
nu-cleation and growth of particles as a function of CS, RH, and temperature (Stanier et al., 2004b). The panel of Fig. 7 was divided into 2 qualitative regions by a 45◦ line. The lower right region indicated more favorable conditions to nucleation than upper left
25
ACPD
12, 12119–12162, 2012Observation of aerosol size distribution and new
particle formation
H. Guo et al.
Title Page
Abstract Introduction
Conclusions References
Tables Figures
◭ ◮
◭ ◮
Back Close
Full Screen / Esc
Printer-friendly Version
Interactive Discussion
Discussion
P
a
per
|
Dis
cussion
P
a
per
|
Discussion
P
a
per
|
Discussio
n
P
a
per
|
decreased, the nucleation events were likely observed. It can be seen that most of data points fell below the dividing line. Compared to the result reported by Stanier et al. (2004b), most values of UV×SO2 in this study were higher, confirming that this
mountain site was a sulfur-rich environment, providing abundant precursor to the NPF. Indeed, the data points with highNnucconcentrations fell into the right side of the figure,
5
suggesting that nucleation events occurred at high UV×SO2. In other word, the SO2
oxidation products may be the trigger of NPF at TMS. Moreover, the low and relatively constant condensational sink values with low temperature and relative humidity (cold and dry) were the favorable conditions for nucleation at the site.
VOCs and carbonyl compounds
10
Generally, oxidation of compounds with different positions of unsaturated bonds and number of carbon atoms in the molecules can result in different aerosol growth rates and SOA mass yields (Griffin et al., 1999). In this study, it was found that the BVOCs showed much stronger correlations withNnuc than the AVOCs in most cases, mainly
due to the higher reactivity of BVOCs against the important atmospheric oxidants
15
OH, NO3 and O3 (Table 1) (e.g., Atkinson, 2000). Particularly, isoprene, α-pinene
and β-pinene had a good to moderate correlation with Nnuc (R 2
isoprene=0.303–0.653,
Rα2−pinene=0.307–0.498 and R 2
β−pinene=0.418–0.705), indicating that these species
might be the major potential contributors to NPF on these events at TMS. The higher correlations of isoprene withNnuc than those ofα-pinene and β-pinene in most NPF
20
events found in this study are consistent with a previous study, in which the contri-butions of isoprene to SOA were found to be higher than those of α- andβ-pinenes (Fu and Kawamura, 2011). Occasionally, other BVOCs i.e. myrcene and limonene (i.e.
Rmyrcene2 =0.672 on 2 November and R 2
limonene=0.705 on 1 November), and some
AVOC species i.e. xylenes and toluene also had high correlations with Nnuc (i.e.
25
ACPD
12, 12119–12162, 2012Observation of aerosol size distribution and new
particle formation
H. Guo et al.
Title Page
Abstract Introduction
Conclusions References
Tables Figures
◭ ◮
◭ ◮
Back Close
Full Screen / Esc
Printer-friendly Version
Interactive Discussion
Discussion
P
a
per
|
Dis
cussion
P
a
per
|
Discussion
P
a
per
|
Discussio
n
P
a
per
|
dominated by one or two BVOC species, but by a number of factors such as the mixing ratios of BVOCs, AVOCs, O3, OH and NOx levels, and the degree of oxidation due to
the different reaction sensitivity of individual VOCs (Hallquist et al., 2009).
Additionally, it was found that the correlation coefficientR2 for the power curves of BVOCs vs.Nnucwas much higher than that of their linear correlation, and the power
ex-5
ponent of isoprene,α-pinene andβ-pinene concentrations was from 1.05 to 2.54, 0.99 to 2.23 and 1.12 to 2.31, respectively. The recent studies on SOA formation by BVOCs found that as the BVOC species were oxidized by O3 and OH, various products with
differing volatilities were formed. When these products exceeded their saturation va-por pressure, homomolecular and heteromolecular homogeneous nucleation between
10
H2SO4and organic vapors could occur with an exponent coefficient in the range of 1 to 2 (e.g., Paasonen et al., 2010). In this study, the exponents of isoprene,α-pinene and
β-pinene withNnuc mainly fell into the range of 1–2, suggesting that both sulfuric acid
and organic vapor may play important roles on NPF at TMS.
Laaksonen et al. (2008) concluded that oxidation products of α-pinene and other
15
monoterpenes were not only present in the freshly nucleated particles, but also de-termined their growth rates. In addition, increased studies focused on the potential SO2/acidity contribution to secondary aerosol formation and growth through
heteroge-neous reactions in the presence of an acid catalyst (e.g., Hatch et al., 2011). Moreover, Villani et al. (2009) reported that the particle growth can be drastically influenced by
20
some volatile compounds in a humid environment, although these organic compounds present at low concentrations. In this study, two NPF events occurred on 27 and 30 October, with the highest GR (9.44 nm h−1) and lowest GR (1.53 nm h−1), respectively, among the six NPF events were compared. The ambient air was cleaner and humid-ity was higher on 27 October than that on 30 October, and the correlation coefficient
25
ratio of BVOCs to AVOCs (RBVOCs2 /RAVOCs2 ) and RUV2 ×SO2 were higher on 27 October
ACPD
12, 12119–12162, 2012Observation of aerosol size distribution and new
particle formation
H. Guo et al.
Title Page
Abstract Introduction
Conclusions References
Tables Figures
◭ ◮
◭ ◮
Back Close
Full Screen / Esc
Printer-friendly Version
Interactive Discussion
Discussion
P
a
per
|
Dis
cussion
P
a
per
|
Discussion
P
a
per
|
Discussio
n
P
a
per
|
humidity, which was related to GR by a positive linear correlation (R2=0.68) for the six NPF events.
Different from the NPF event on 27 October, the GR on 30 October may be dom-inated by the interactions between biogenic and anthropogenic aerosol precursors. Recent evidence suggested that chemical interactions between anthropogenic and
bio-5
genic VOCs were important in the formation of secondary aerosols (e.g., Brock et al., 2003). In this study, based on strong correlations between Nnuc and AVOC species
and moderate correlations betweenNnuc and BVOC species, the SOA formation may
be dominated by AVOCs oxidation and/or be mediated by anthropogenic pollutants on the transformation of BVOCs to SOA on 30 October, 2010. The low formation rate and
10
growth rate may be related to the increased condensation and the coagulation sinks caused by a large number of preexisting aerosol particles, inhibiting the formation and growth of freshly nucleated particles on 30 October 2010.
Particulate matter
Further investigation on the major inorganic chemical species i.e. sulfate (SO24−),
ni-15
trate (NO−3) and ammonium (NH+4) and OC/EC in PM2.5collected from 7 September to
26 November 2010 showed that the correlations between ion mass concentrations in PM2.5 and PN concentration were weak, i.e.R2=0.214 for NH+4,R2=0.025 for NO−3 and R2=0.252 for SO24−. Due to strong and frequent photochemical formation from 29 October to 08 November and from 22 to 27 November, 2010, new particles formed
20
from VOC species may contribute a significant fraction to the PN concentration in the atmosphere at TMS. Consequently, the correlations between inorganic ion mass con-centrations and the PN concentration were weakened. This can be further evidenced by the fact that the OC/EC ratios obtained during the NPF events were 2.16∼2.53. Typically, EC is emitted from combustion sources with limited chemical
transforma-25
ACPD
12, 12119–12162, 2012Observation of aerosol size distribution and new
particle formation
H. Guo et al.
Title Page
Abstract Introduction
Conclusions References
Tables Figures
◭ ◮
◭ ◮
Back Close
Full Screen / Esc
Printer-friendly Version
Interactive Discussion
Discussion
P
a
per
|
Dis
cussion
P
a
per
|
Discussion
P
a
per
|
Discussio
n
P
a
per
|
reactions among primary gaseous VOCs in the atmosphere. Therefore, The OC/EC ra-tios exceeding 2.0 have been used to indicate the presence of SOA (e.g., Turpin et al., 1990). The average OC/EC ratio at TMS (i.e. 2.32), indicated a certain contribution of SOAs to the increase in PN concentration.
4 Conclusions
5
Particle number concentrations and size distributions were measured at a suburban site near the mountain summit of TMS from September to November 2010. The over-all average concentration of nucleation mode (Nnuc, 5.5–10 nm), Aitken mode (NAit,
10–100 nm), and accumulation mode (Nacc,100–350 nm) were 0.65±0.05×10 3
cm−3, 4.75±0.63×103cm−3and 0.86±0.07×103cm−3, respectively. The high PN concen-10
tration was likely attributed to local photochemical particle formation and/or regional transport of aged particles. The dry monsoon season begun in late October and early November created favorable conditions for NPF. The NPF events were observed on 12 out of 35 days at TMS based on the evolution of particle size distributions and PN concentrations. Back trajectory analyses suggested that particle nucleation and growth
15
events were associated with less polluted cool and dry air from the PRD region caused by the winter monsoon.
Good to moderate correlations between O3 andNnuc were found for almost all NPF
events, suggesting that NPF events were closely related to photochemical reactions. Initial inspection on the potential precursors of the NPF events at TMS revealed that
20
Nnuchad good correlations with (UV×SO2) on some days i.e. 8 November, with BVOCs
on other days i.e. 29 October and 2 November, with both (UV×SO2) and BVOCs
on 1 November, with both BVOCs and AVOCs on 28 October, and with VOCs and (UV×SO2) on 27 October. The results suggested that SO2products, BVOCs and
AV-OCs might be the main contributors to Nnuc. The SO2 products might dominate the
25