Submitted2 May 2016
Accepted 6 September 2016
Published4 October 2016
Corresponding author
Andrew Noymer, noymer@uci.edu
Academic editor
Claus Wilke
Additional Information and Declarations can be found on page 11
DOI10.7717/peerj.2531 Copyright
2016 Tate et al.
Distributed under
Creative Commons CC-BY 4.0 OPEN ACCESS
Did the 1918 influenza cause the
twentieth century cardiovascular
mortality epidemic in the United States?
Steven Tate1, Jamie J. Namkung2and Andrew Noymer3
1Pritzker School of Medicine, University of Chicago, Chicago, IL, United States 2Program in Public Health, University of California, Irvine, CA, United States
3Department of Population Health and Disease Prevention, University of California, Irvine, CA,
United States
ABSTRACT
During most of the twentieth century, cardiovascular mortality increased in the United States while other causes of death declined. By 1958, the age-standardized death rate (ASDR) for cardiovascular causes for females was 1.84 times that for all other causes, combined (and, for males, 1.79×). Although contemporary observers believed that cardiovascular mortality would remain high, the late 1950s and early 1960s turned out to be the peak of a roughly 70-year epidemic. By 1988 for females (1986 for males), a spectacular decline had occurred, wherein the ASDR for cardiovascular causes was less than that for other causes combined. We discuss this phenomenon from a demographic point of view. We also test a hypothesis from the literature, that the 1918 influenza pandemic caused the cardiovascular mortality epidemic; we fail to find support.
SubjectsVirology, Cardiology, Epidemiology, Infectious Diseases, Public Health
Keywords Heart disease, Influenza, Epidemiology, Demography, Public health
INTRODUCTION
The twentieth century witnessed a slow-building increase of heart disease mortality, fol-lowed by a fall (Stallones, 1980); this pattern has been called an ‘‘epidemic’’ (Doll, 1987; Mar-mot, 1992). The decline of heart disease mortality in the last 50 years remains incompletely explained (Wilmot et al., 2015)—for instance, it occurred during an increase in obesity (Fle-gal, 2005;Carroll et al., 2015), which is thought to be a major risk factor for cardiovascular mortality (Flegal et al., 2007; Lavie, Milani & Ventura, 2009; Marinou et al., 2010). Azambuja & Duncan (2002a)proposed a creative hypothesis, that the 1918 influenza pandemic can explain this heart disease epidemic. We test the influenza hypothesis using historical data on heart disease mortality in the United States, disaggregated by age, sex, and period. Our analysis finds no support for the hypothesized role of the 1918 influenza pandemic. We begin by reviewing the history of American heart disease mortality, followed by an exploration of the influenza hypothesis in light of age-, sex- and period-specific mortality data. We then describe and implement a cohort test of the influenza hypothesis, using pre/post-1918 birth cohorts and data on heart disease mortality.
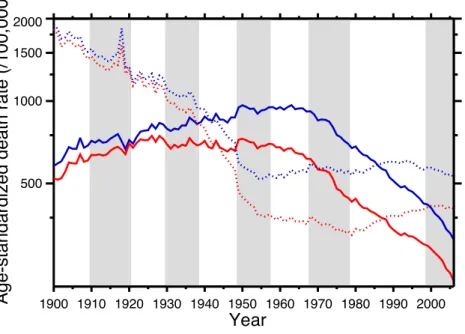
Figure 1 Age-standardized death rates, United States Death Registration Area (1900–32) and United States (1933–2006).Solid lines: heart disease. Dotted lines: all other causes excluding external causes (see text). Males, blue; females, red. Rates calculated by the authors from data listed in theAppendix. Alternat-ing shadAlternat-ing marks disease classification from ICD-1 to ICD-10. Year 2000 standard population used.
epidemic pattern of heart disease mortality in the United States in the twentieth century.
Figure 1also shows the age-standardized death rate for all other causes combined, excluding accidents, homicide, and suicide (dotted lines). Data sources are listed inAppendix, as is a tabulation of which ICD codes comprise heart disease (we define heart disease broadly, including the major cardiovascular diseases). This data set, which is available in the
Supplemental Information, is potentially useful for others studying heart disease in the twentieth century.
The ASDR for non-cardio mortality shows a consistent decline, 1900–1955 (punctuated by the 1918 influenza pandemic), followed by a plateau and slight increase, 1965–2006. On the other hand, heart disease mortality shows a slow increase through the late 1940s, followed by a plateau until the late 1960s, and then a steep decline. Remarkably, from the early-1940s to the mid-1980s (i.e., where the solid lines are above the dotted lines inFig. 1), the age-standardized death rate for cardiac causes exceeded that for all other causes combined (excluding violent causes). Indeed,Fig. 1demonstrates that the decline in non-violent all-cause mortality in the last 30 years is driven by the decline in cardiac mortality.
We thus hypothesize that whatever immuneinflammatory mechanism caused a sex and age mortality pattern in 1918–1919 which differed from that of incidence of respiratory symptoms during the pandemic (seeFig. 1) also ‘‘primed’’ survivors in a similar fashion, predisposing them to future development of CHD. If that were the case, then the relative distribution of influenza-related deaths among individuals ages 15–49 in 1918–1919 (a proxy for the distribution of some particular kind of immune-inflammatory response to infection across the range of exposed birth cohorts) should predict the occurrence of CHD mortality in survivors from the corresponding birth cohorts (from about 1870 to 1915) in the subsequent years (Azambuja & Duncan, 2002a, pp. 558–559).
This neatly explains the rising side of the heart disease mortality epidemic. Cohort replacement takes care of the decline: ‘‘Since the flu epidemic was restricted (to 1918–19), new generations of unexposed individuals were then responsible for the later decline in CHD mortality’’ (Castilho & Gouveia, 2002; see alsoSichieri, 2002;Ferreira, 2002;Werneck, 2002;Azambuja & Duncan, 2002b). Note, in Fig. 1, that the epidemic of cardiovascular mortality begins (although ambiguously) after 1919; this is congruent with the with the hypothesis.Azambuja & Levins (2007), andAzambuja (2008)discuss similar data. The pandemic hypothesis is based on aggregate data, and in the following section we similarly use aggregate data (albeit finer-grained) to test it.
RESULTS
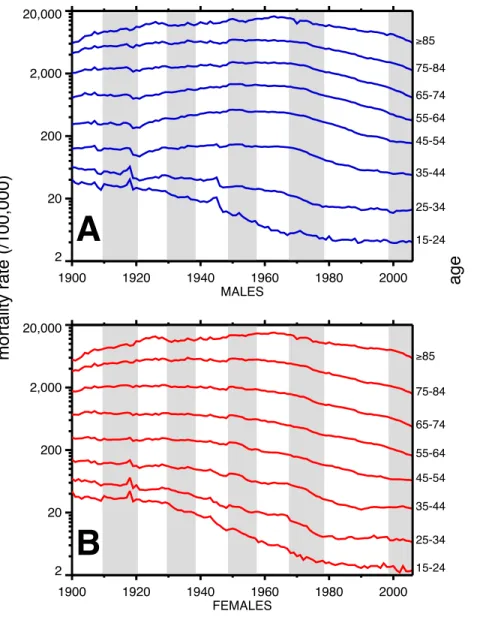
A breakdown, by age, of heart disease mortality in the same time span is presented inFig. 2. The epidemic pattern depicted inFig. 1is present in ages 35 and above (more for males), but is more subdued when viewed as age-specific data slices. The year 1918 (presumably related to the influenza pandemic, since it was such a large and unusual event) is a pivot point in the heart disease data, especially for males, and most strongly in age groups 15–24 and 25–34. Not coincidentally, these were the peak ages of pandemic mortality (cf.Fig. 3). Coincident with the pandemic, heart disease death rates go up, perhaps due to classifica-tion errors or comorbidities. Heart disease death rates then fall steeply in 1919. For example, for men aged 25–34 the cardiac death rate fell from the highest value in the twentieth century, in 1918, to the lowest value to date in the twentieth century, in 1919 (64.8 to 42.4 per 100,000). This has been characterized elsewhere as a harvesting effect, whereby those who died in the 1918 flu (whether their deaths were recorded as influenza or not) were sicker than average, therefore making a healthier than average surviving population in 1919, with lower death rates compared to the staus quo ante (Noymer, 2009).
In older age groups, especially 35–44, 45–54, and 55–64, and more for males, the post-1918 dip in cardiovascular death rates is followed by a rebound, which can be regarded as the beginning of the twentieth century heart disease epidemic. Note that the changes in heart disease mortality in the wake of the 1918 flu are age-dependent, and, to a large extent, sex dependent, with females showing no similar changes at ages 45 and above in 1919 and thereafter.
Figure 2 Heart disease age-specific death rates, United States Death Registration Area (1900–32) and United States (1933–2006).(A) Males, (B) females. Age groups are labeled on the right-hand vertical axes. Data sources and component causes listed in theAppendix. Alternating shading marks disease classifica-tion from ICD-1 to ICD-10.
1997). No pattern changes appear to be due to succession of ICD versions, with the possible exception of the transition from ICD 5 to 6 in 1949, in which there is an uptick in mortality rates at ages 35–84 (somewhat more pronounced for women), in the year of the change. Another noteworthy pattern is the sharp decline, more for males, in cardiovascular mortality below age 35, around 1945. This is due to declines in rheumatic heart disease mortality associated with the invention of antibiotics (Crimmins, 1981).
1Technically, it is the incidence net of
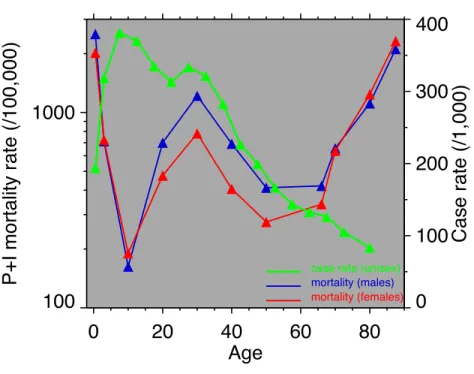
survivorship, but given the differing scales involved (compare the left and right axis ofFig. 3), incidence is a good first-order approximation.
Figure 3 Pneumonia and influenza age-mortality profile, United States Death Registration Area, 1918.(Left vertical axis. Males, blue; females, red. FromUS Department of Health, Education, and Welfare (1956).) And influenza case rate or ‘‘attack rate.’’ (Right vertical axis, green. FromFrost (1919).)
males (i.e.,Fig. 2A) at ages 15–24, 25–34, 35–44 and 45–54. All these ages should respond similarly, if the 1918 influenza were a watershed moment in cardiovascular mortality. It is important to note that inFig. 3,survivorsmatter more than the dead (cf.Sheps, 1958), so the key curve is the incidence.1 What is especially inconsistent with the influenza hypothesis is that cardiovascular mortality declines in the wake of the flu for ages 15–24 and 25–34, whereas it increases for 35–44 and 45–54. These cohorts all experienced unusual flu mortality in 1918, which is the marker, according to the influenza hypothesis, for an enhanced heart disease response. The heterogeneous response is not expected under the hypothesis. What is more, women, who were affected by the flu, albeit somewhat less than men, show no after-effects of cardiovascular mortality in the wake of the 1918 pandemic (Fig. 2B).
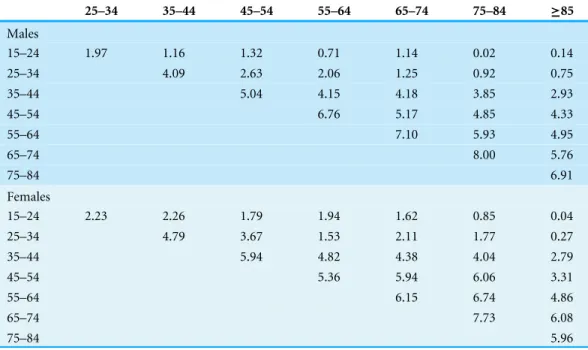
Table 1 Goodman–Grunfeld test statistics for co-movement of data series inFig. 2. The test statistics follow a normal distribution, so any number≥1.96 can be regarded as significant at the 5% level in a
two-sided test.
25–34 35–44 45–54 55–64 65–74 75–84 ≥85
Males
15–24 1.97 1.16 1.32 0.71 1.14 0.02 0.14
25–34 4.09 2.63 2.06 1.25 0.92 0.75
35–44 5.04 4.15 4.18 3.85 2.93
45–54 6.76 5.17 4.85 4.33
55–64 7.10 5.93 4.95
65–74 8.00 5.76
75–84 6.91
Females
15–24 2.23 2.26 1.79 1.94 1.62 0.85 0.04
25–34 4.79 3.67 1.53 2.11 1.77 0.27
35–44 5.94 4.82 4.38 4.04 2.79
45–54 5.36 5.94 6.06 3.31
55–64 6.15 6.74 4.86
65–74 7.73 6.08
75–84 5.96
signs of first differences of two series. That is to say, when one series goes up (year-to-year) that the other one does as well, and the same with declines. It is unusual for two mortality time series to be in perfect lock-step; this test for co-movement gives a statistical measure of the tendency for two series to co-move. Pure period effects (e.g., this year has lenient mortality, next year, severe, and so on) predict statistically-significant co-movements between the time series inFig. 2.
Table 1gives every pairwise Goodman–Grunfeld test of the time series inFig. 2(within sex). Reading across each row ofTable 1gives the G–G test statistic, comparing that mortal-ity time series to older age groups. Reading down each column compares with younger age groups. Adjacent age groups are on the diagonal, which is always the strongest relationship, with the exception of females, age≥85 (where the relationship is trivially stronger for co-movement with the 65–74 age group).Table 1is highly suggestive that adjacent age groups are moving together, as period effects shape the time series—-indeed, most cells are signifi-cant (≥1.96), so, basically, the time series at all ages are movingen massefrom year-to-year.
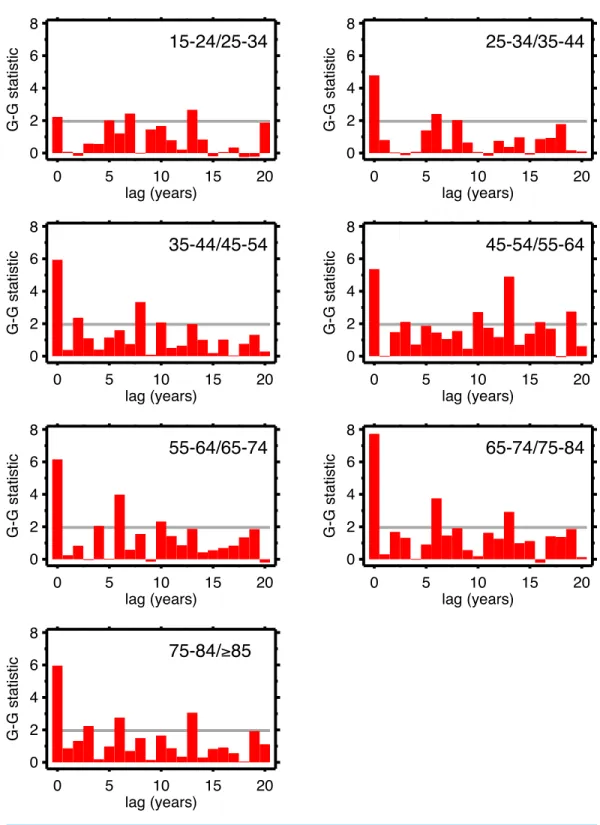
but, because of the lag, 1930 to 1931 (then 1931 to 1932...) for the 25–34 age group, and so on. Since those 15–24 in 1920 are 25–34 in 1930, the comparison with 10-year lag is, substantially, comparing the same group of people. Of all the lags we tested (1–20 years) cohort overlap peaks at 10 years, and is zero beyond 20 years. At lags other than 10 years, we are looking at mixtures of adjacent (10-year) birth cohorts. If there are are cohort effects, we expect to see a bar graph of the test statistics having a local or global maximum at a lag of 10.
Figures 4(males) and5(females) are bar graphs of the G–G test statistic of age-adjacent cardiovascular mortality rates, at lags 0–20, as discussed above. For every age combination (separately by sex) across Figs. 4and5, the maximum co-movement occurs at lag 0, indicating that period effects predominate. What is more, the lags don’t show any preference for 10 years. The data inFig. 2are more consistent with period effects than with the cohort (viz influenza) hypothesis. These data are the same as have been used to argue in favor of the influenza hypothesis (e.g., Fig. 1 inAzambuja & Levins, 2007), except that they have been disaggregated by age.
We are alternately considering period, and cohort, perspectives, all the while stratifying by age and sex. This is not a unified age-period-cohort (A-P-C) framework in the formal way that term is used in demographic research (Hobcraft, Menken & Preston, 1982)). This is intentional, as the A-P-C approach has received justified criticism (e.g.,Rodgers, 1982; Mason, 1991;Smith, 2004;Luo, 2013). The exploratory approach (Tukey, 1977) used herein, combined with the above G-G tests, seems more suited to the data and questions at hand.
DISCUSSION
The idea that diseases or exposures can affect individuals after a long delay, and can influence outcomes of seemingly-unrelated diseases, has a long pedigree (Derrick, 1927;Kermack, McKendrick & McKinlay, 1934;Frost, 1939; Merrell, 1947;Kuh & Davey Smith, 1993) discuss the history. The work of Barker and collaborators, onin uteroexposures, is a special case of the larger phenomenon. This strand of work began in the 1980s (e.g.,Barker & Osmond, 1986;Barker et al., 1989;Barker, 1990), and has spawned a huge literature of its own. The 1918 influenza has been fertile subject matter in this vein (Almond & Mazumder, 2005;Almond, 2006(see alsoBrown & Thomas, 2013);Lin & Liu, 2014).Azambuja & Dun-can’s (2002a) hypothesis that exposure to the 1918–19 influenza pandemic preconditioned later heart disease mortality also belongs in the category of early or delayed influences.
We analyzed data on cardiovascular death rates, by age and sex. Looking at all age groups and long time spans permits age, period, and cohort perspectives. We find salient evidence for period effects, with adjacent time series (e.g., 25–34 and 35–44) strongly co-moving, statistically. In other words, changes seen in one age group from year to year are almost always seen in the adjacent age group (and, indeed, in age groups beyond that).
on, at least until out-selection of the dead has diminished the putative scarring effect. By looking at 10-year age groups with 10-year lags, we looked at the mortality experiences of the same cohort over time. Under the null hypothesis of cohort effects, other lags should produce less strong co-movement, since the cohort overlap is much less (for example, 10-year age data and a 5-year lag). We see no preference for 10 years among all the lags in the G–G test statistics, which we interpret as lack of support for cohort effects.
This study has a number of limitations.Preston (1976)makes the point that cardiovas-cular diseases are especially subject to misclassificiation as causes of death. This invites the alternate hypothesis that the decline in cardiovascular mortality could be due to improve-ments in death classification which move similar deaths to non-cardiac causes. However, our broad definition of cardiovascular mortality (cf. Appendix) would seem to buffer against this. So does the fact, also noted byPreston (1976), that cardiovascular causes are often the replacement for causes such as ‘‘senility’’ that nowadays are regarded as so-called garbage codes (in other words, technical improvements over time can increase as well as diminish cardiovascular death counts).
The available data are in ten-year age groups, which are wider than ideal. Five-year age groups (unavailable in the historical data) would be preferable because they are more detailed than the data at our disposal, while still being wide enough to smooth digit-preferences (e.g., heaping of deaths of 75 year-olds in 1975) that plague single-year data. Individual-level data, such as a modern epidemiological cohort study, with measured expo-sure to the 1918 influenza, would be the best, but are unavailable. The influenza hypothesis as regards cardiovascular mortality was framed using aggregate data, and, we believe, can be tested further using aggregate data that is more granular (age groups). The 20th century cardiovascular mortality epidemic remains somewhat mysterious. The role of the rise and fall of tobacco smoking also should be considered; the timing and sex-specific aspects align with the patterns of cardiovascular mortality (Bongaarts, 2014).
CONCLUSION
We find the hypothesis that the 1918 influenza pandemic played a key role in the 20th century cardiovascular mortality epidemic to be creative and original. However, it is not congruent with the available data on long-term changes in heart disease mortality, when arrayed by sex ×age ×period. A complete explanation of the twentieth century cardiovascular mortality epidemic in the United States remains elusive.
ACKNOWLEDGEMENTS
APPENDIX: ICD CODES FOR “HEART DISEASE”
See the table below:
Years ICD Codes used Data source
1900–1909 1 47, 64–66, 77–86, 142 A
1910–1920 2 47, 64–66, 77–85, 142 A
1921–1929 3 51, 74, 75, 83, 87–90, 91b,c, 92–96, 151 A
1930–1938 4 56, 82, 90–95, 97–103 A
1939–1948 5 58, 83, 90–103 A
1949–1957 6 330–334, 400–468 A (1949–53); B (1954–57)
1958–1967 7 330–334, 400–468 B (1958–59); C (1960–67)
1968–1978 8 390–448 D
1979–1998 9 390–448 E
1999–2006 10 I00–I78 F
Data sources:
A US Department of Health, Education, and Welfare (1956) B National Center for Health Statistics (2005) C National Center for Health Statistics (2004a) D National Center for Health Statistics (2004b) E National Center for Health Statistics (2000) F National Center for Health Statistics (2009)
ADDITIONAL INFORMATION AND DECLARATIONS
Funding
The authors received no funding for this work.
Competing Interests
Andrew Noymer is an Academic Editor for PeerJ.
Author Contributions
• Steven Tate and Andrew Noymer conceived and designed the experiments, performed the experiments, analyzed the data, wrote the paper, prepared figures and/or tables, reviewed drafts of the paper.
• Jamie J. Namkung analyzed the data, wrote the paper, reviewed drafts of the paper.
Data Availability
The following information was supplied regarding data availability: The raw data has been supplied asSupplemental File.
Supplemental Information
REFERENCES
Almond D. 2006.Is the 1918 influenza pandemic over? Long-term effects ofin utero influenza exposure in the post-1940 U.S. population.Journal of Political Economy 114(4):672–712DOI 10.1086/507154.
Almond D, Mazumder B. 2005.The 1918 influenza pandemic and subsequent health outcomes: an analysis of SIPP data.American Economic Review: Papers and Proceed-ings95(2):258–262 DOI 10.1257/000282805774669943.
Azambuja MI. 2008.Connections: can the 20th century coronary heart disease epidemic reveal something about the 1918 influenza lethality?Brazilian Journal of Medical and Biological Research41(1):1–4DOI 10.1590/S0100-879X2006005000192.
Azambuja MIR, Duncan BB. 2002a.Similarities in mortality patterns from influenza in the first half of the 20th century and the rise and fall of ischemic heart disease in the United States: a new hypothesis concerning the coronary heart disease epidemic. Cadernos de Saúde Pública18(3):557–566.
Azambuja MIR, Duncan BB. 2002b.The authors reply.Cadernos de Saúde Pública 18(3):568–574DOI 10.1093/aje/kww067.
Azambuja MI, Levins R. 2007.Coronary heart disease (CHD)—one or several diseases? Perspectives in Biology and Medicine50(2):228–242DOI 10.1353/pbm.2007.0013. Barker DJP. 1990.The fetal and infant origins of adult disease.British Medical Journal
301(6761):1111DOI 10.1136/bmj.301.6761.1111.
Barker DJP, Osmond C. 1986.Infant mortality, childhood nutrition, and ischaemic heart disease in England and Wales.Lancet 327(8489):1077–1081
DOI 10.1016/S0140-6736(86)91340-1.
Barker DJP, Osmond C, Winter PD, Margetts B, Simmonds SJ. 1989.Weight in infancy and death from ischaemic heart disease.Lancet 334(8663):577–580
DOI 10.1016/S0140-6736(89)90710-1.
Bongaarts J. 2014.Trends in causes of death in low-mortality countries: implications for mortality projections.Population and Development Review40(2):189–212
DOI 10.1111/j.1728-4457.2014.00670.x.
Brown R, Thomas D. 2013.On the long term effects of the 1918 US influenza pandemic. Mimeo, Duke University.Available athttps:// sites.duke.edu/ ryanbrown/ files/ 2013/ 09/ 1918Flu_Brown_Thomas_20131.pdf.
Carroll MD, Navaneelan T, Bryan S, Ogden CL. 2015. Prevalence of obesity among children and adolescents in the United States and Canada. In:NCHS data brief. Vol. 211. Hyattsville: National Center for Health Statistics.Available athttp:// www.cdc. gov/ nchs/ data/ databriefs/ db211.pdf.
Castilho EA, Gouveia N. 2002.Biological (anti)terrorism by mother nature?Cadernos De Saúde Pública18(3):567–568DOI 10.1590/S0102-311X2002000300006.
Crimmins EM. 1981.The changing pattern of American mortality decline, 1940–77, and its implications for the future.Population and Development Review7(2):229–254
Derrick V. PA. 1927.Observations on (1) errors of age in the population statistics of England and Wales, and (2) the changes in mortality indicated by the national records [with discussion].Journal of the Institute of Actuaries58:117–159
DOI 10.1017/S0020268100031474.
Doll R. 1987.Major epidemics of the 20th century: from coronary thrombosis to AIDS. Journal of the Royal Statistical Society: Series A (Statistics in Society)150(4):373–395
DOI 10.2307/2982044.
Ferreira MU. 2002.Association between infuenza and coronary heart disease: how convincing is available evidence?Cadernos De Saúde Pública18(3):568–569
DOI 10.1590/S0102-311X2002000300004.
Flegal KM. 2005.Epidemiologic aspects of overweight and obesity in the United States. Physiology & Behavior86(5):599–602DOI 10.1016/j.physbeh.2005.08.050.
Flegal KM, Graubard BI, Williamson DF, Gail MH. 2007.Cause-specific excess deaths associated with underweight, overweight, and obesity.Journal of the American Medical Association298(17):2028–2037DOI 10.1001/jama.298.17.2028.
Frost WH. 1919.The epidemiology of influenza.Public Health Reports34(33):1823–1836
DOI 10.2307/4575271.
Frost WH. 1939.The age selection of mortality from tuberculosis in successive decades. American Journal of Hygiene30-SectionA(3):91–96.
Goodman LA, Grunfeld Y. 1961.Some nonparametric tests for comovements between time series.Journal of The American Statistical Association56(293):11–26
DOI 10.1080/01621459.1961.10482086.
Hetzel AM. 1997. US vital statistics system: major activities and developments, 1950–95. In:DHHS Publication No. (PHS) 97-1003. Hyattsville: National Center for Health Statistics.
Hobcraft J, Menken J, Preston S. 1982.Age, period, and cohort effects in demography: a review.Population Index48(1):4–43DOI 10.2307/2736356.
Johnson NPAS, Mueller J. 2002.Updating the accounts: global mortality of the 1918– 1920 ‘Spanish’ influenza pandemic.Bulletin of the History of Medicine76(1):105–115
DOI 10.1353/bhm.2002.0022.
Kermack WO, McKendrick AG, McKinlay PL. 1934.Death-rates in Great Britain and Sweden: some general regularities and their significance.Lancet223(5770):698–703
DOI 10.1016/S0140-6736(00)92530-3.
Kuh D, Davey Smith G. 1993.When is mortality risk determined? Historical insights into a current debate.Social History of Medicine6(1):101–123DOI 10.1093/shm/6.1.101. Lavie CJ, Milani RV, Ventura HO. 2009.Obesity and cardiovascular disease: risk factor,
paradox, and impact of weight loss.Journal of The American College of Cardiology 53(21):1925–1932DOI 10.1016/j.jacc.2008.12.068.
Lin M-J, Liu EM. 2014.Doesin uteroexposure to illness matter? The 1918 influenza epi-demic in Taiwan as a natural experiment.Journal of Health Economics37:152–163
Luo L. 2013.Assessing validity and application scope of the intrinsic estimator approach to the age-period-cohort problem.Demography50(6):1945–1967
DOI 10.1007/s13524-013-0243-z.
Marinou K, Tousoulis D, Antonopoulos AS, Stefanadi E, Stefanadis C. 2010.Obesity and cardiovascular disease: from pathophysiology to risk stratification.International Journal of Cardiology138(1):3–8DOI 10.1016/j.ijcard.2009.03.135.
Marmot M. 1992. Coronary heart disease: rise and fall of a modern epidemic. In:
Marmot M, Elliott P, eds.Coronary heart disease epidemiology: from aetiology to public health. Oxford: Oxford University of Press, 3–19, chapter 1.
Mason WM. 1991.Freedman is right as far as he goes, but there is more, and it’s worse; Statisticians could help.Sociological Methodology21:337–351DOI 10.2307/270942. Merrell M. 1947.Time-specific life tables contrasted with observed survivorship.
Biometrics3(3):129–136DOI 10.2307/3001948.
National Center for Health Statistics. 2000.Death rates for 72 selected causes, by 10-year age groups, race, and sex: United States, 1979–98.Available athttp:// www.cdc.gov/ nchs/ data/ statab/ gm290-98.pdf (accessed on 21 March 2013).
National Center for Health Statistics. 2004a.Death rates for 60 selected causes, by 10-year age groups, race, and sex: United States, 1960–67.Available athttp:// www.cdc. gov/ nchs/ data/ dvs/ mx196067.pdf (accessed on 21 March 2013).
National Center for Health Statistics. 2004b.Death rates for 69 selected causes, by 10-year age groups, race, and sex: United States, 1968–78.Available athttp:// www.cdc. gov/ nchs/ data/ dvs/ mx196878.pdf (accessed on 21 March 2013).
National Center for Health Statistics. 2005.Death rates for 64 selected causes, by 10-year age groups, race, and sex: United States, 1950–59.Available athttp:// www.cdc.gov/ nchs/ data/ dvs/ mx1950_59.pdf (accessed on 21 March 2013).
National Center for Health Statistics. 2009.Death rates for 113 selected causes, by 10-year age groups, race, and sex: United States, 1999–2006.Available athttp:// www.cdc. gov/ nchs/ data/ dvs/ MortFinal2006_Worktable290r.pdf (accessed on 21 March 2013). Noymer A. 2009.Testing the influenza-tuberculosis selective mortality hypothesis with
Union Army data.Social Science & Medicine 68(9):1599–1608
DOI 10.1016/j.socscimed.2009.02.021.
Preston SH. 1976.Mortality patterns in national populations: with special reference to recorded causes of death. New York: Academic Press.
Rodgers WL. 1982.Estimable functions of age, period, and cohort effects.American Sociological Review47(6):774–787DOI 10.2307/2095213.
Sheps MC. 1958.Shall we count the living or the dead?New England Journal of Medicine 259(25):1210–1214DOI 10.1056/NEJM195812182592505.
Sichieri R. 2002.Debate on the paper by Azambuja & Duncan.Cadernos De Saúde Pública18(3):567–568.
Smith HL. 2004.Response: cohort analysis redux.Sociological Methodology34:111–119
DOI 10.1111/j.0081-1750.2004.00149.x.
Tukey JW. 1977.Exploratory data analysis. Reading: Addison-Wesley.
US Department of Health, Education, and Welfare. 1956. Death rates by age, race, and sex. United States, 1900–1953: selected causes. In:Vital statistics—special reports. Washington, D.C.: National Office of Vital Statistics, 1–31.
Werneck GL. 2002.Debate on the paper by Azambuja & Duncan.Cadernos De Saúde Pública18(3):569DOI 10.1590/S0102-311X2002000300005.
Wilmot KA, O’Flaherty M, Capewell S, Ford ES, Vaccarino V. 2015.Coronary heart disease mortality declines in the United States from 1979 through 2011: evidence for stagnation in young adults, especially women.Circulation132(11):997–1002